Kiowa County is a plains landscape where grassland and agriculture divide almost the entire 2025 map. Grassland covers 54.91% and agriculture 41.08%, with broad grass-dominated areas in the west and larger farm blocks becoming more common toward the east.
This page compares current land cover, forest and farmland, impervious surfaces, and mapped class differences from 1985 to 2025. Four original JPG maps are available together in one ZIP for printing, presentations, classroom use, and closer examination of farm blocks, wetlands, and reservoir areas.
Table of Contents
Eastern Kiowa County is a patchwork of large agricultural blocks
Agriculture accounts for 41.08% of Kiowa County, making it the second-largest current class. On the eastern half, yellow agricultural blocks cover long stretches of the map and often form large rectangles separated by thinner grassland strips or road-like lines.
The pattern becomes less continuous toward the west. Farm blocks remain present, but grassland takes over more of the background and individual agricultural areas are more isolated. The countywide percentage therefore hides a clear regional difference in where farming is concentrated.
Kiowa County’s Comprehensive Plan identifies agriculture as the backbone of the county economy and lifestyle. It also calls for most unincorporated land to remain agricultural until more intensive use is considered beneficial, while encouraging residential, commercial, and industrial growth around established communities such as Eads, Sheridan Lake, and Haswell.
That planning language should not be confused with the NLCD agricultural class. Zoning and policy describe legal or intended land use, while the map classifies the visible surface. The two sources are useful together for context, but they answer different questions.
Only a few tiny clusters rise above a 0.28% mean impervious surface
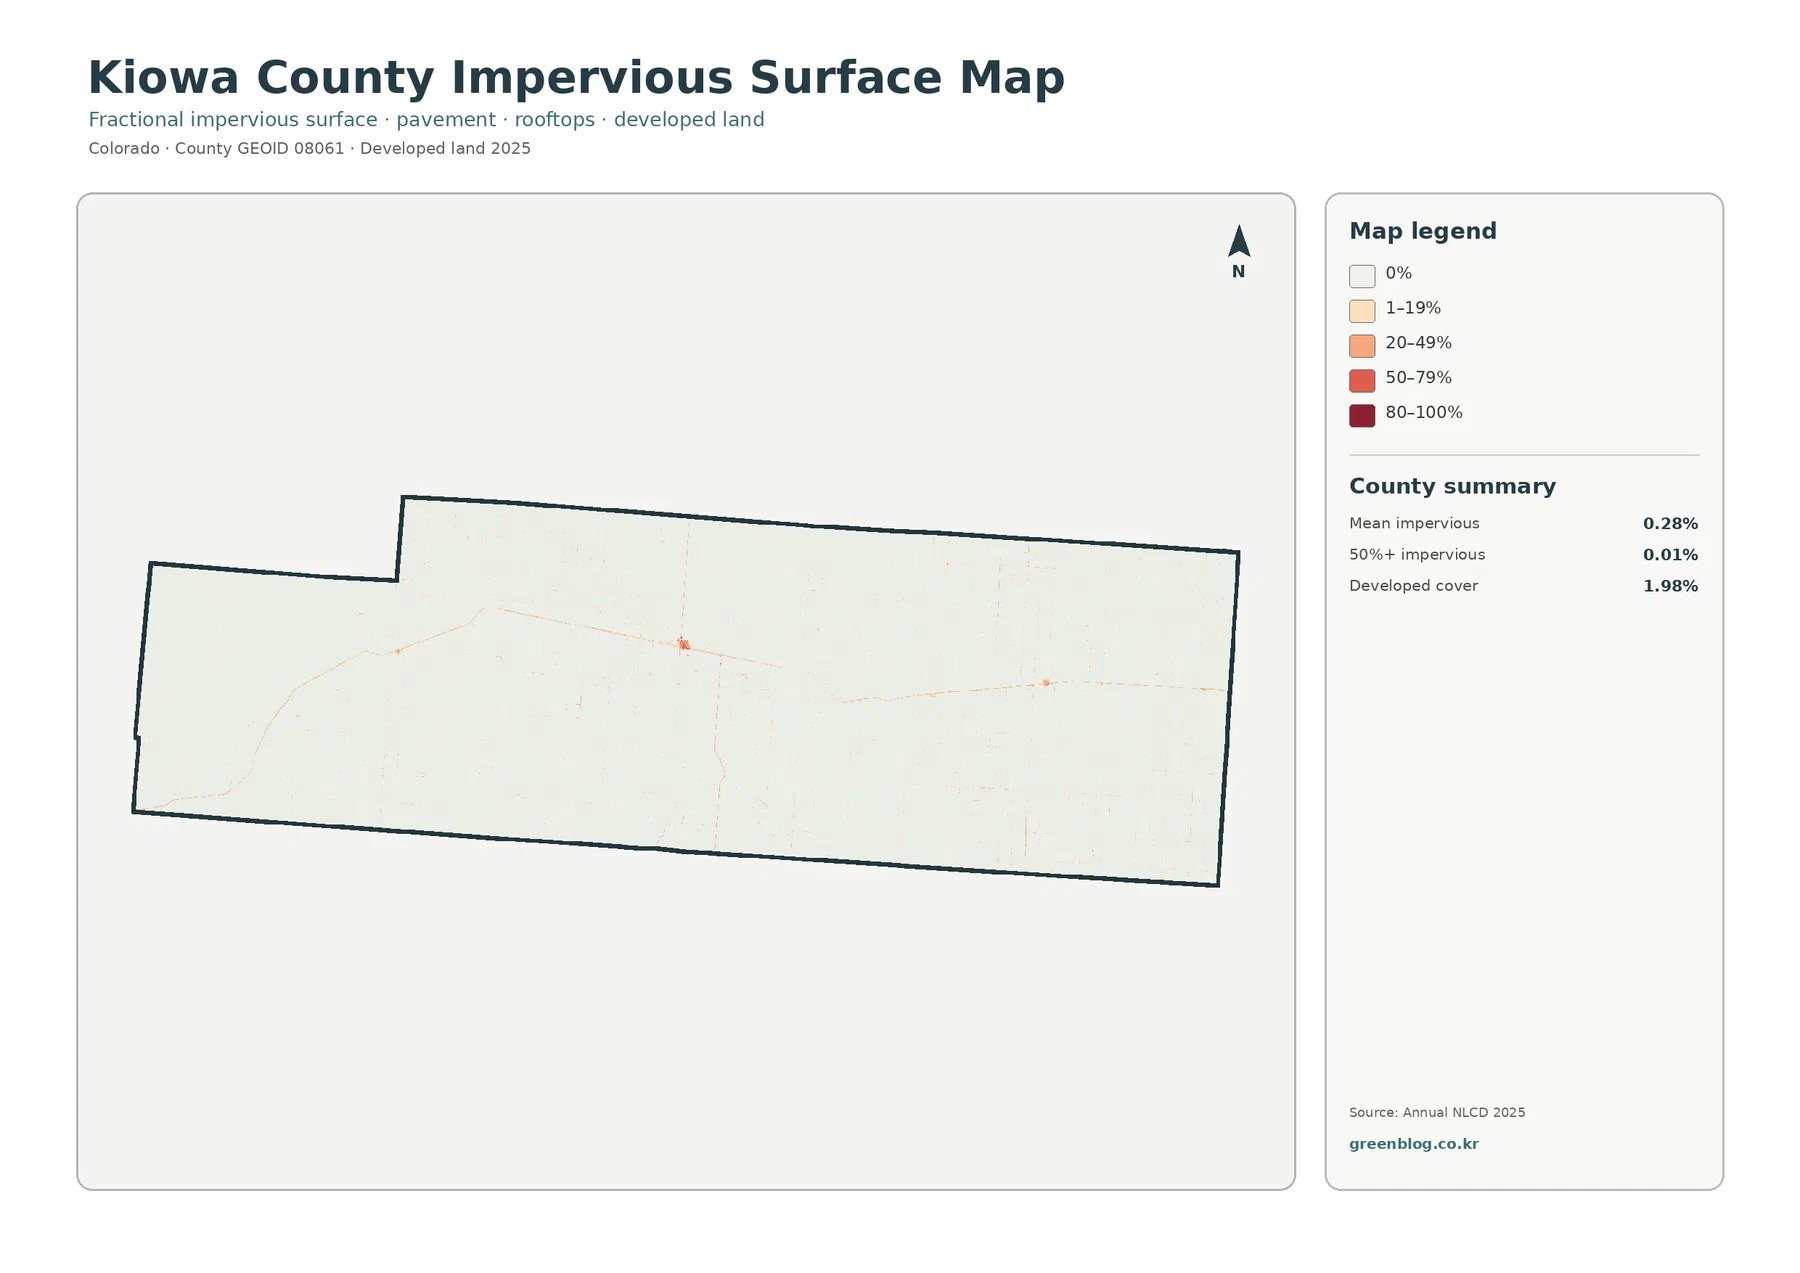
Mean imperviousness is only 0.28%, and cells mapped at 50% or greater imperviousness cover just 0.01% of Kiowa County. Most of the map is almost white because crops, grass, soil, and other permeable surfaces occupy nearly all of the county.
A small red-orange cluster near the central portion is the clearest hard-surface concentration, with another smaller cluster farther east. Faint linear traces connect or extend away from these points, but high imperviousness remains rare across the agricultural landscape.
Developed land cover is 1.98%, considerably higher than the mean impervious percentage but still small countywide. A developed cell can contain streets or buildings along with lawns, exposed soil, and vegetation, so the two measurements are not expected to match.
The map is useful for showing how compact settlement remains within a very large rural county. It is not precise enough to measure road width, locate individual buildings, or establish town boundaries, because each raster cell represents a generalized 30-meter area.
The 2025 map makes the west-to-east grassland and farming shift easy to see
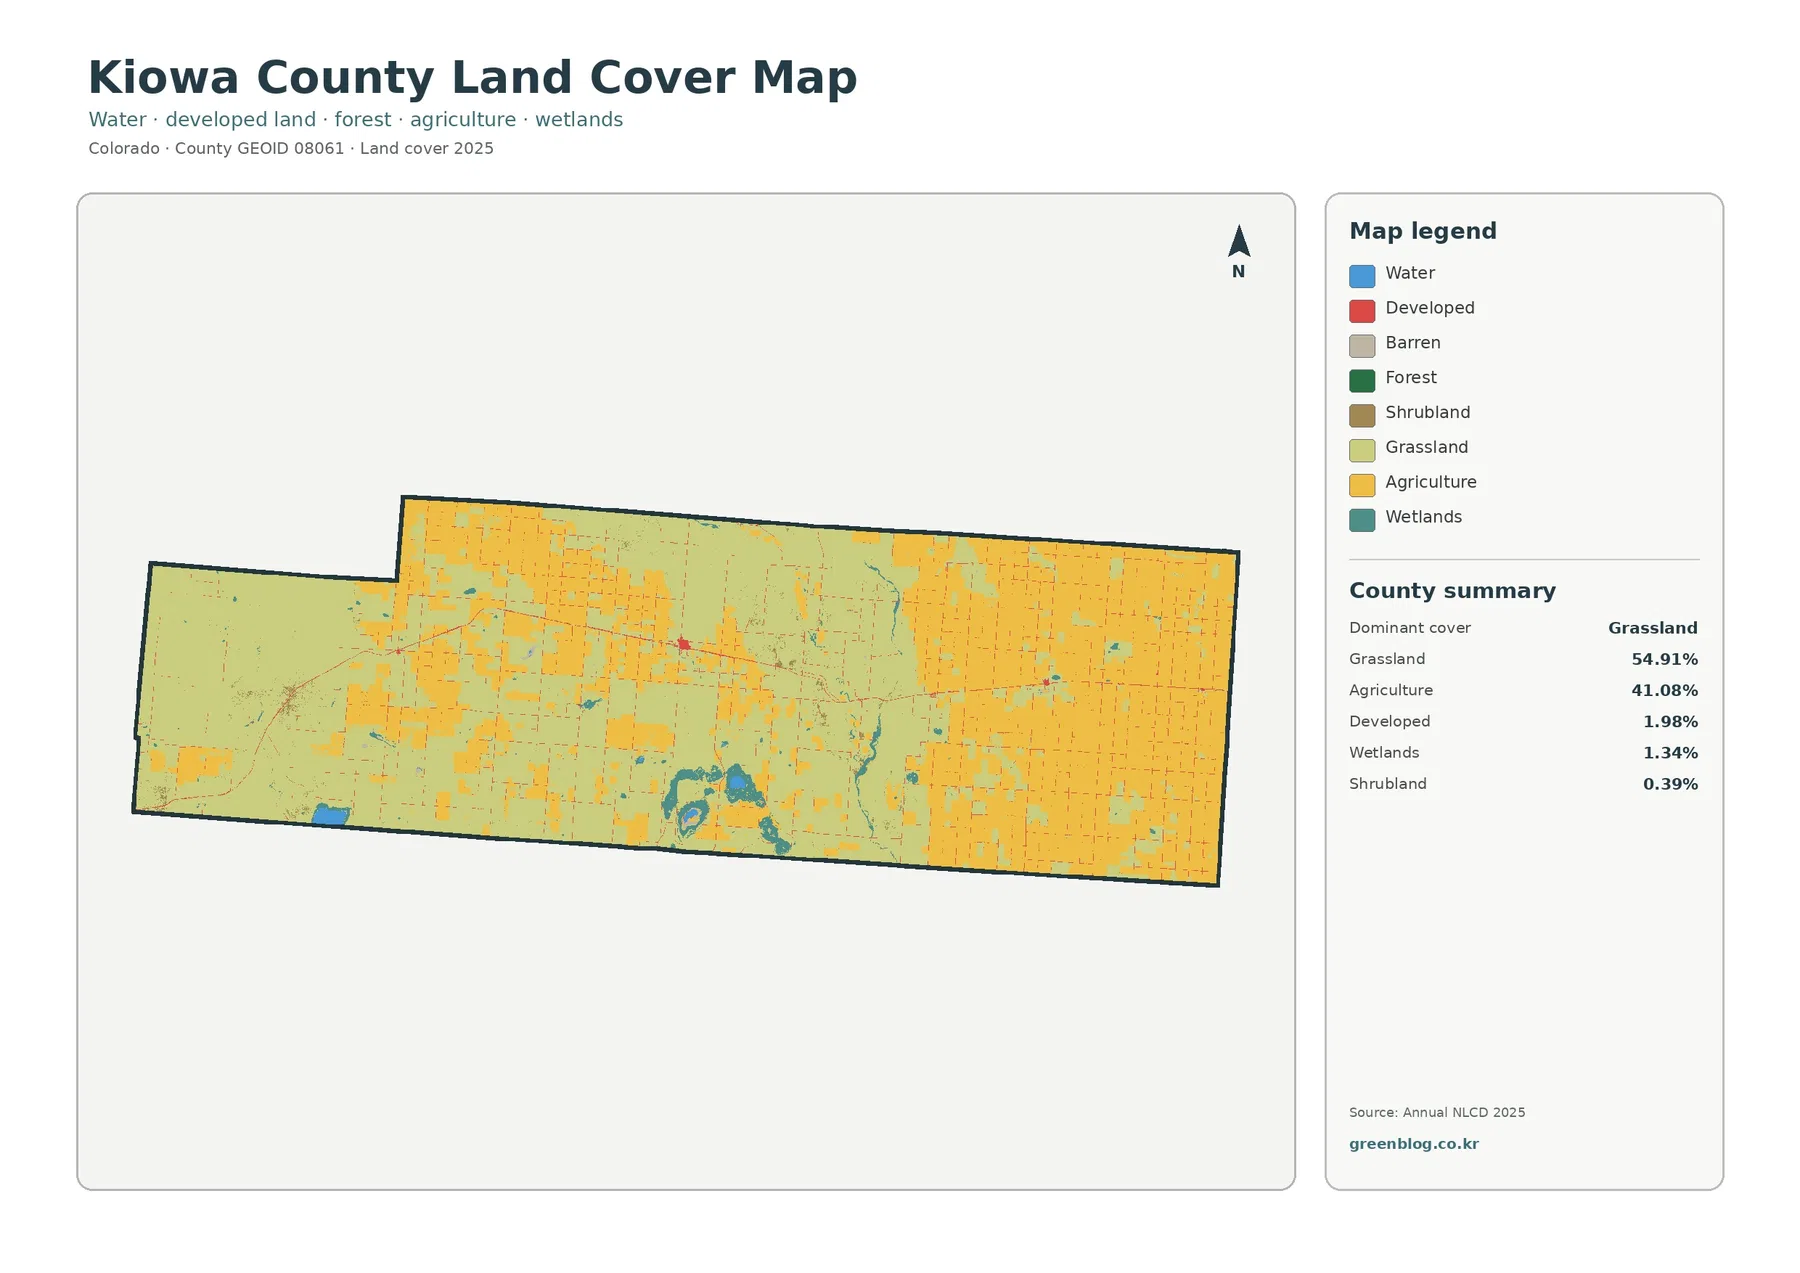
At 54.91%, grassland is the dominant current class. It covers most of the western extension and remains important through the center, where agricultural blocks are mixed into a broad pale-green background. In the east, yellow agriculture becomes much more extensive.
Forest is 0.00% in the supplied county summary, an unusual result compared with many Colorado counties. That does not mean there are literally no individual trees or shelterbelts anywhere; it means forest does not register as a meaningful countywide NLCD cover share in this 2025 summary.
Wetlands account for 1.34% and form small blue-green patches and narrow features, especially in the southern-central area. Water is only 0.22%, yet several blue patches stand out because they are concentrated rather than evenly dispersed.
Shrubland is just 0.39%, so tan shrub cover is a minor part of the county landscape. The county’s main surface story is therefore much simpler than in the Rocky Mountain counties: grassland and agriculture dominate, with localized water, wetlands, and settlement.
Queens State Wildlife Area gives the southern reservoir cluster a real geographic reference
Colorado Parks and Wildlife identifies Queens State Wildlife Area in Kiowa County and provides access from Eads to a group of reservoirs that includes Nee Noshe, Upper Queens, and Lower Queens. CPW regulations also list Nee Gronda and Nee So Pah reservoirs in Kiowa County.
The current land-cover map has a noticeable cluster of blue water and blue-green wetland cover in the southern-central county. The raster image does not label individual reservoirs, so the safest interpretation is to use Queens SWA as official regional context rather than assigning every blue shape to a specific named reservoir.
Concentration explains why water can be visually important even at only 0.22% countywide. A few reservoirs grouped within a limited area stand out against miles of grassland and cropland, while isolated small water cells elsewhere may barely be visible.
Reservoir and wetland conditions can change with water management, drought, and seasonal conditions. NLCD should be used as a surface-cover snapshot, not a substitute for current reservoir operations or access rules. Those details are better checked through Colorado Parks and Wildlife.
With no mapped forest share, the simplified view becomes a farm-versus-grassland map
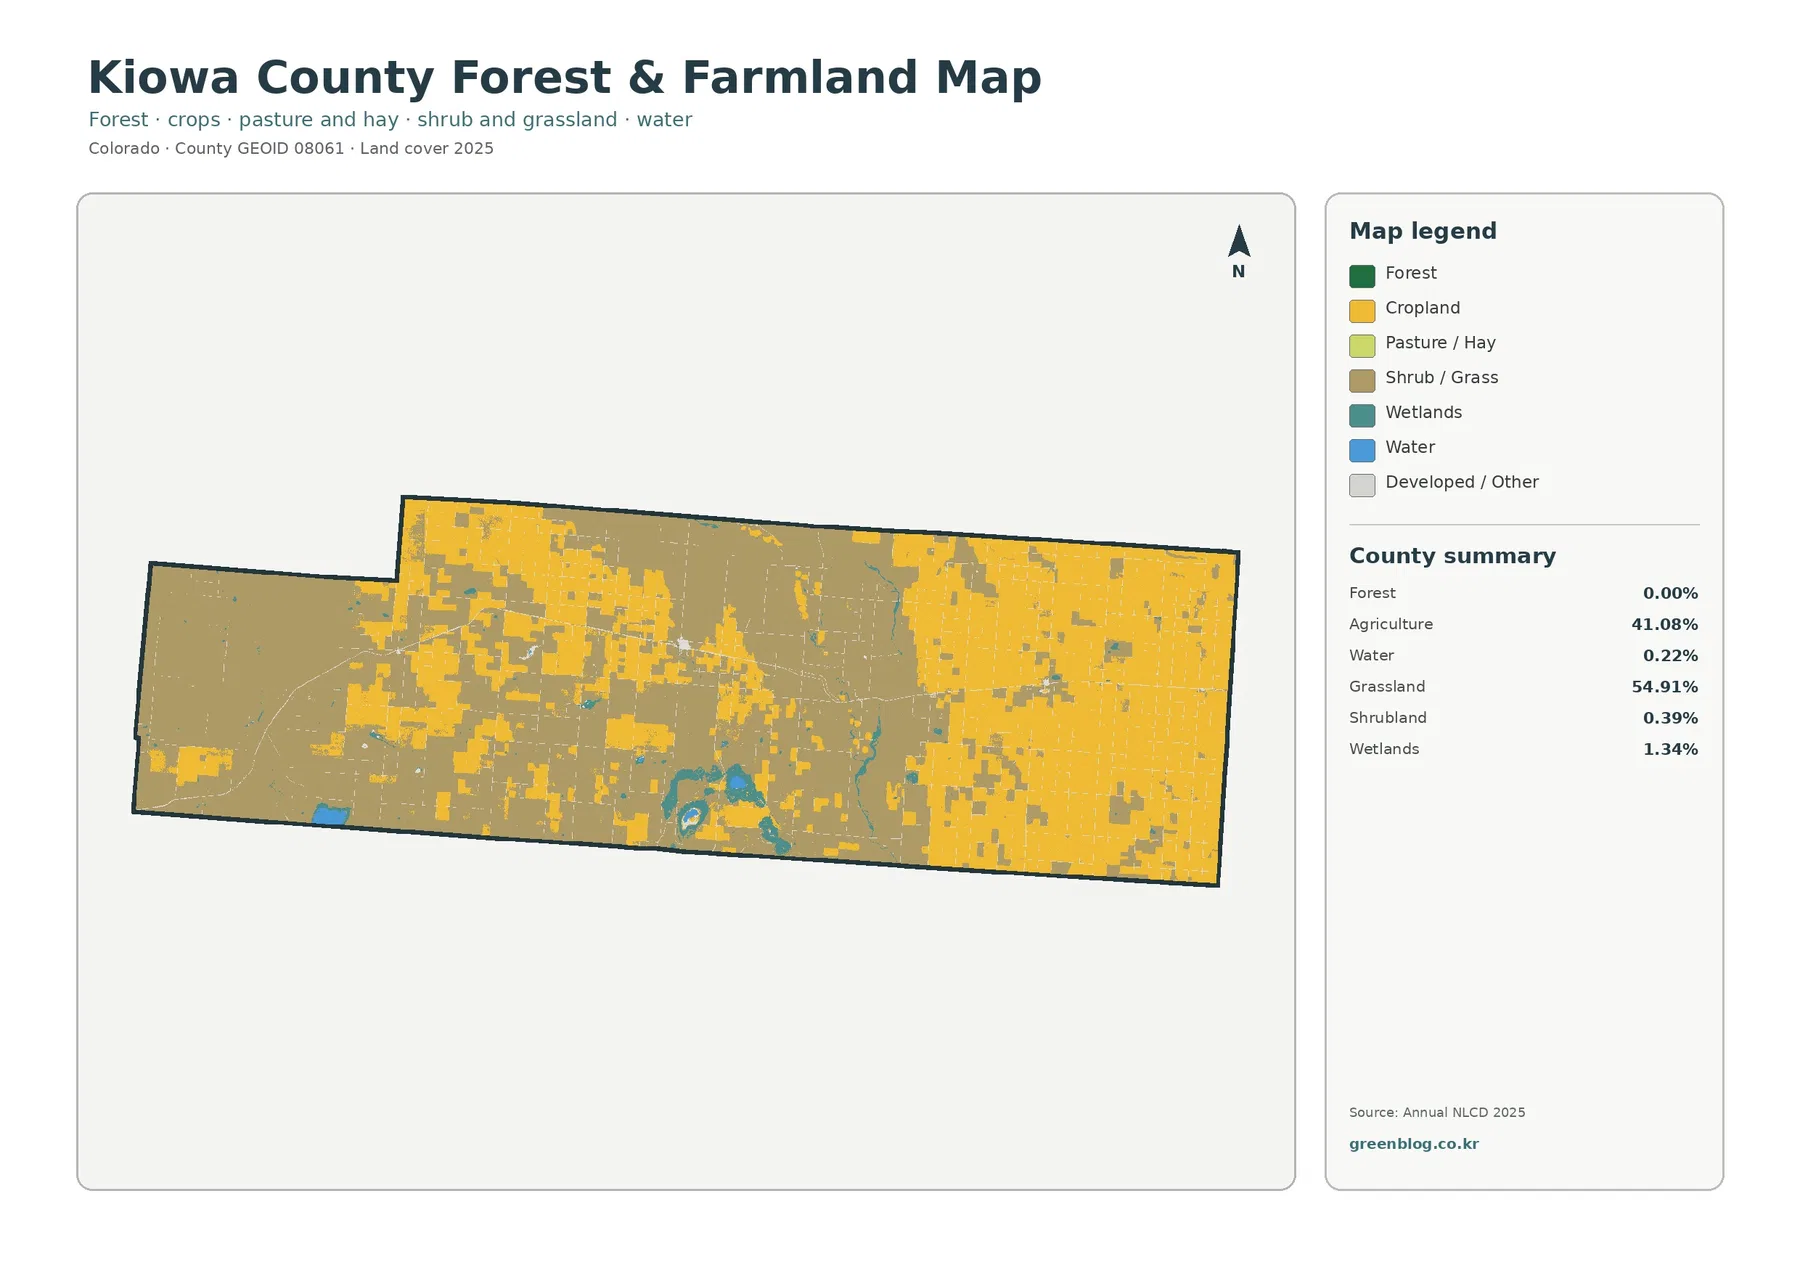
Because forest is 0.00% in the supplied summary, this map has a different role than its counterpart in mountain counties. Its main value is separating yellow agricultural cover from the broader shrub-and-grass category with fewer colors.
The eastern side is visibly more agricultural, while the western extension and much of the west-central county retain a larger share of open grass cover. Central Kiowa County contains the most complicated mixture, with farm blocks, grass, developed-or-other patches, and wetlands appearing close together.
A mapped agricultural cell is not a surveyed farm parcel. Thirty-meter raster cells can contain crops, exposed soil, grass, roads, and other surfaces at the same time. Ownership, crop type, irrigation status, and legal land use require separate agricultural or county records.
The comprehensive plan adds a useful local policy perspective because it emphasizes maintaining agriculture across the unincorporated county while concentrating more intensive growth around existing communities. That planning goal helps explain why the built footprint is so small compared with the farm-and-grass landscape.
Agricultural loss dominates the 17.93% class-difference map
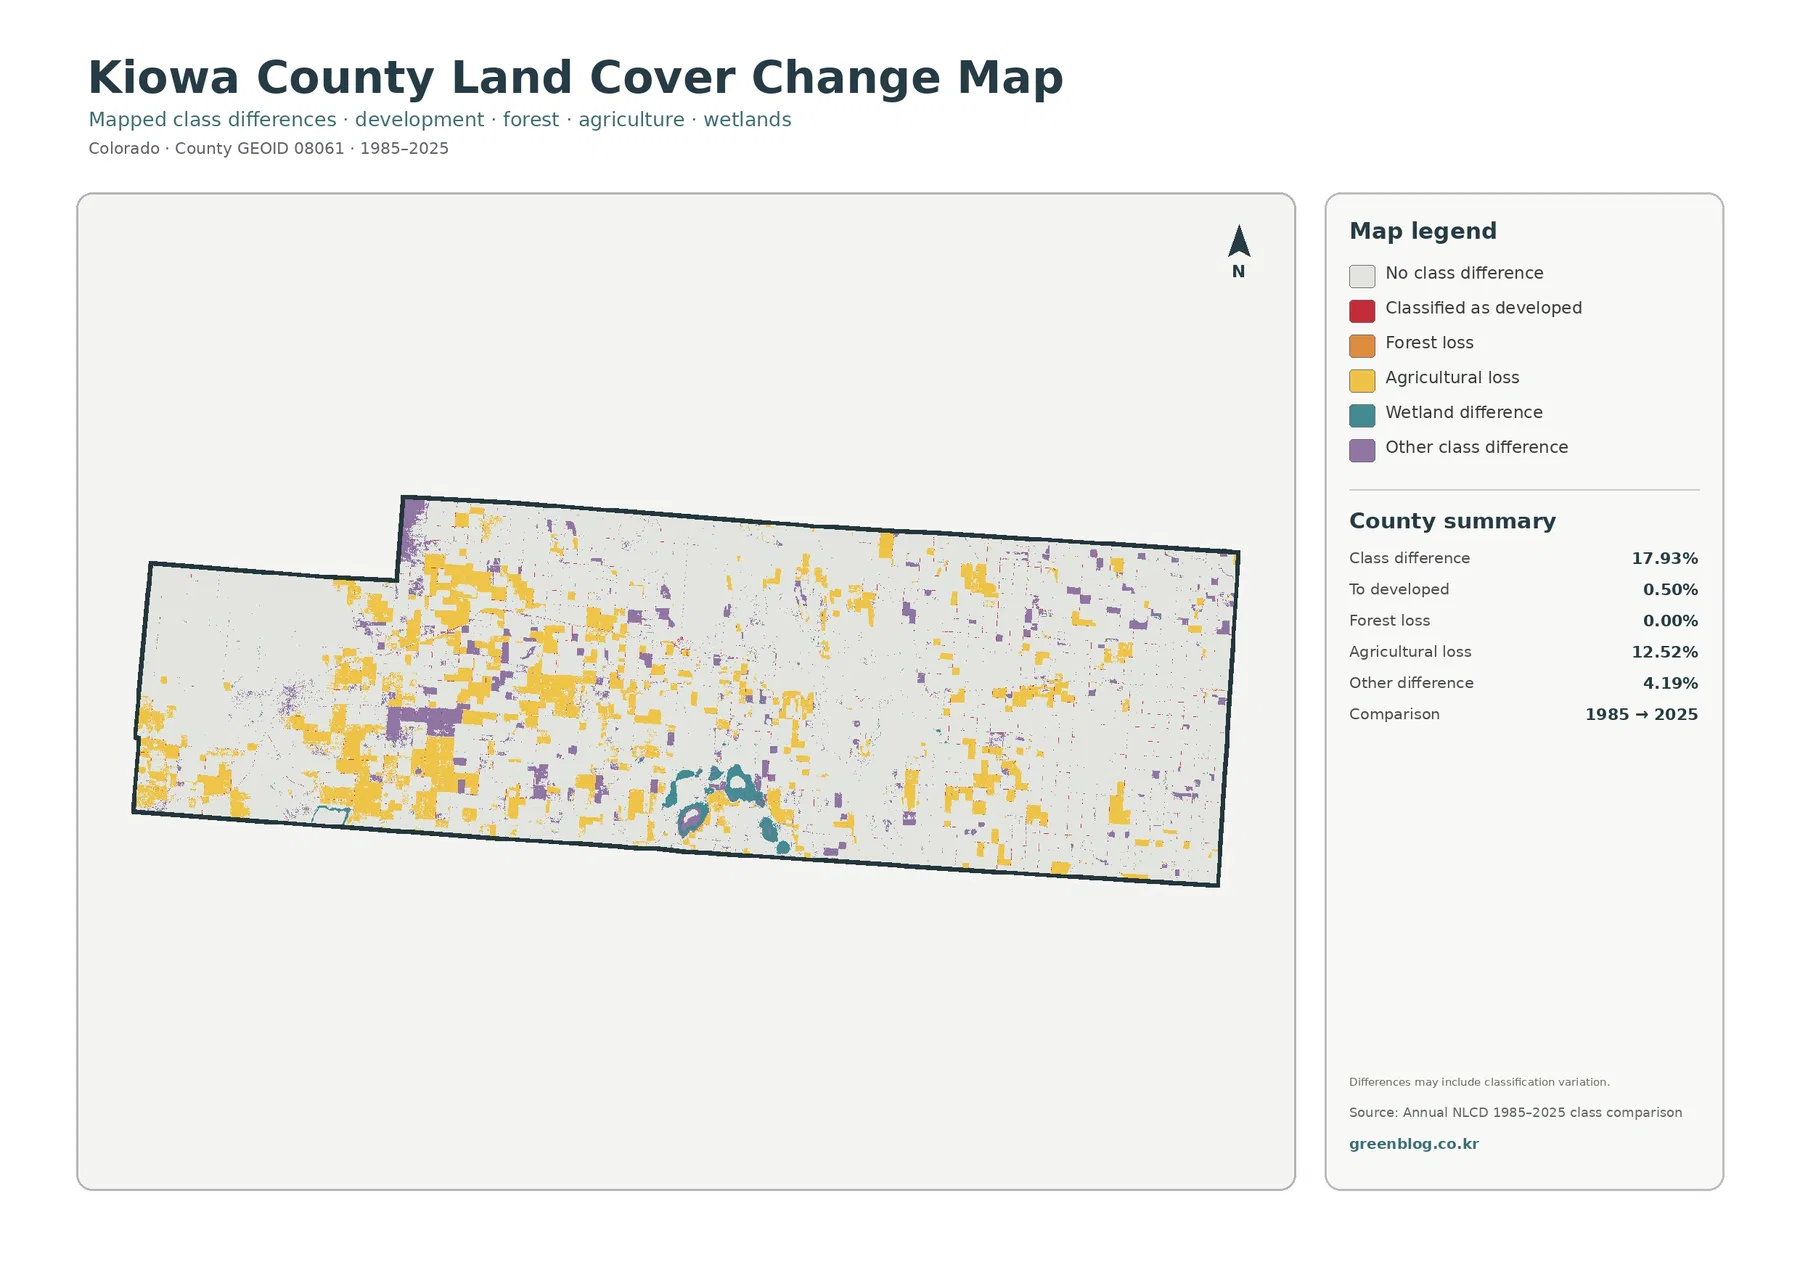
Mapped classes differ across 17.93% of Kiowa County between 1985 and 2025. Agricultural loss is the largest category at 12.52%, followed by other class difference at 4.19% and conversion to developed at 0.50%. Forest loss is 0.00%.
Yellow agricultural-loss patches occur in the west, center, and east, often as rectangular blocks that resemble the geometry of current agricultural cover. Some areas contain many adjacent change patches, while other farm blocks remain in the no-class-difference background.
Blue-green wetland-difference pixels are especially noticeable around the southern reservoir and wetland cluster. The change layer does not identify why those classes differ between the two dates. Water levels, vegetation conditions, land management, and classification variation may all require separate evidence.
The 12.52% agricultural-loss category cannot simply be subtracted from the current 41.08% agricultural share to reconstruct a 1985 total. One number is a current land-cover percentage; the other is a two-date change category.
Eads, the eastern farm blocks, and Queens reservoirs make useful comparison anchors
The Eads area is a practical anchor for the small developed footprint. Current land cover shows a broader developed class, while the impervious layer narrows attention to the hardest surfaces within the settlement area.
Eastern Kiowa County is the best place to explain agricultural concentration. Large farm blocks dominate the current map, and the change layer adds numerous agricultural-loss patches. Keeping those two maps side by side prevents change categories from being mistaken for present land cover.
The southern reservoir district provides a third kind of landscape. Water and wetlands occupy a small share of the county but become visually important where they are concentrated near Queens State Wildlife Area.
Together, these three references show why Kiowa County is more than a single agricultural percentage. Grassland remains dominant, farming is extensive but uneven, development is compact, and reservoir wetlands create a distinct local feature.
Thirty-meter cells are useful for county patterns, not parcel or field boundaries
Annual NLCD is raster data produced with 30-meter cells. A cell can contain crops, grass, soil, water, pavement, or buildings at the same time, yet the land-cover product assigns a representative class. Fractional imperviousness estimates hard-surface share separately.
That generalization matters for narrow roads, small wetlands, and reservoir shorelines. Water at 0.22%, shrubland at 0.39%, and highly impervious cells at 0.01% can nearly disappear at a small map scale unless they are geographically concentrated.
The change map adds another limitation: a different class in 1985 and 2025 does not automatically reveal a physical cause. Agricultural loss may reflect real surface change, but the map alone cannot identify management decisions, crop rotations, drought, or classification variability.
Current land-cover and impervious maps represent 2025. Changes after that year, including cropping patterns, construction, reservoir conditions, or wetland shifts, may not appear. Current decisions should be checked against newer county or agency information.
Choose the Kiowa County map according to the question you need to answer
Start with the general land-cover map for the complete county picture. It combines western grassland, eastern agriculture, small developed clusters, wetlands, water, and minor shrubland in one legend.
The forest-and-farmland version is better for a simple grassland-versus-agriculture comparison. Imperviousness is useful when the question concerns how little hard surface exists outside settlements, while the change map is the right choice for 1985–2025 agricultural differences.
For teaching or presentations, compare the western grassland, eastern farm blocks, and southern Queens reservoir area at the same scale. Those three areas capture the county’s most distinctive land-cover patterns without relying on generic plains descriptions.
Pair current land cover with the change map whenever discussing the 12.52% agricultural-loss category. That keeps current agricultural extent separate from the locations whose classifications changed between the two selected years.
Download four original Kiowa County JPG maps
The downloadable ZIP contains four original JPG files: general land cover, forest and farmland, impervious/developed land, and 1985–2025 land-cover change. The WebP images on the page are optimized for quick viewing, while the JPG files are better for enlarging field patterns, reservoir wetlands, and sparse development.
Keep the map title, year, and legend with each image when reusing it. Current agriculture and agricultural loss, current developed cover and conversion to developed, and developed cover and imperviousness are related but different measurements.
Frequently Asked Questions
What are the dominant land-cover classes in Kiowa County?
Grassland is the largest 2025 class at 54.91%, followed by agriculture at 41.08%. Grassland is broader in the west, while large agricultural blocks become much more common toward the east.
Does 0.00% forest mean there are literally no trees in Kiowa County?
No. It means forest does not register as a meaningful countywide share in the supplied 2025 NLCD summary. Individual trees, shelterbelts, or very small wooded areas can still exist without producing a measurable forest percentage at this scale.
Can 12.52% agricultural loss be subtracted from the current 41.08% agricultural share?
No. Agricultural loss is a 1985–2025 change category, while 41.08% describes current 2025 agricultural cover. They measure different things and cannot be subtracted to reconstruct an earlier agricultural percentage.
Map File Information
The download ZIP contains four original Kiowa County land-cover JPG maps.
- Included Files: Use only the versions confirmed in the article and supplied images
- File Type: Use the confirmed download contents
- Intended Use: Printing, education, presentations, and map-based projects
Related Maps
- Adams County Colorado Land Cover Map
- Alamosa County Colorado Land Cover Map
- Arapahoe County Colorado Land Cover Map
Sources and References
- MRLC Annual NLCD Data – official access point for Annual NLCD products and data.
- USGS Annual NLCD Land Cover Classification – official documentation for interpreting Annual NLCD classes and 30-meter raster data.
- Kiowa County Comprehensive Plan – official local planning context for agriculture and growth around Eads, Sheridan Lake, and Haswell.
- Colorado Parks and Wildlife – Queens State Wildlife Area – official information about Kiowa County reservoirs including the Nee Noshe area and related wildlife lands.
- U.S. Census Bureau TIGER/Line Shapefiles – official geographic boundary reference.
Green Map creates custom-edited map images using open geographic data sources such as geoBoundaries, Natural Earth, OpenStreetMap, and government open data.
These maps are edited visual materials, not raw data files, and are provided for education, documents, presentations, and graphic reference.