Clay County has a 2025 land-cover pattern built around three large contrasts: broad forest across the west and interior, a substantial developed footprint in the north, and water and wetlands along the eastern side. The county summary lists forest at 37.87%, developed cover at 21.07%, wetlands at 17.01%, water at 5.79%, shrubland at 5.63%, and agriculture at 5.54%.
This page includes the full land-cover view, a forest-and-farmland map, an impervious-surface map, and a 1985–2025 class-comparison map. The four original JPG files are available together in one ZIP, making the set useful for printing, classroom work, presentations, and county-to-county comparison.
Table of Contents
A county where forest remains the largest cover while development is strongly concentrated
The broadest visual feature is the dark-green forest that covers much of western and central Clay County. That pattern changes toward the north, where developed land becomes much more prominent, and again along the eastern edge, where water and wetlands form a long boundary zone. Reading those areas together is more useful than reducing the county to a single dominant color.
Forest is the largest mapped category at 37.87%. It forms large connected areas in the west and continues through parts of the central and southern interior. In the northern part of the county, however, green areas are more frequently broken by developed cover, so the continuity of forest varies considerably from one part of the map to another.
Developed cover accounts for 21.07%. The strongest red concentrations appear in the northeast and north-central portions, with additional developed areas extending southward along the eastern side and appearing in a separate southwestern pocket. The pattern resembles several connected settlement and transportation areas rather than one isolated urban center.
Wetlands make up 17.01%, a large share in their own right. Teal areas are especially noticeable near the eastern water edge and in the southeast, but smaller wetland patches also occur within forested parts of the county. Because open water and wetlands are separate classes, the blue and teal areas should not be combined when interpreting the summary values.
Clay County’s Branan Field Master Plan provides useful local context for the north-central pattern. The county describes the planning area between Orange Park and Middleburg as an important growth area and includes a Primary Conservation Network intended to protect connected wetlands and uplands. That planning information helps explain why development and natural cover are both important in the same part of the county, although the supplied land-cover map does not show legal planning boundaries.
Jennings State Forest adds another piece of county-specific context. Florida Forest Service places the forest in northern Clay County and reports about 25,152 acres, with natural communities that include sandhill, flatwoods, seepage slopes, dome swamp, blackwater streams, and other habitats. The official forest boundary should be consulted separately, but this information supports the broader observation that large forest and wetland systems remain important in the county.
Impervious surface reveals where the developed footprint is most intense
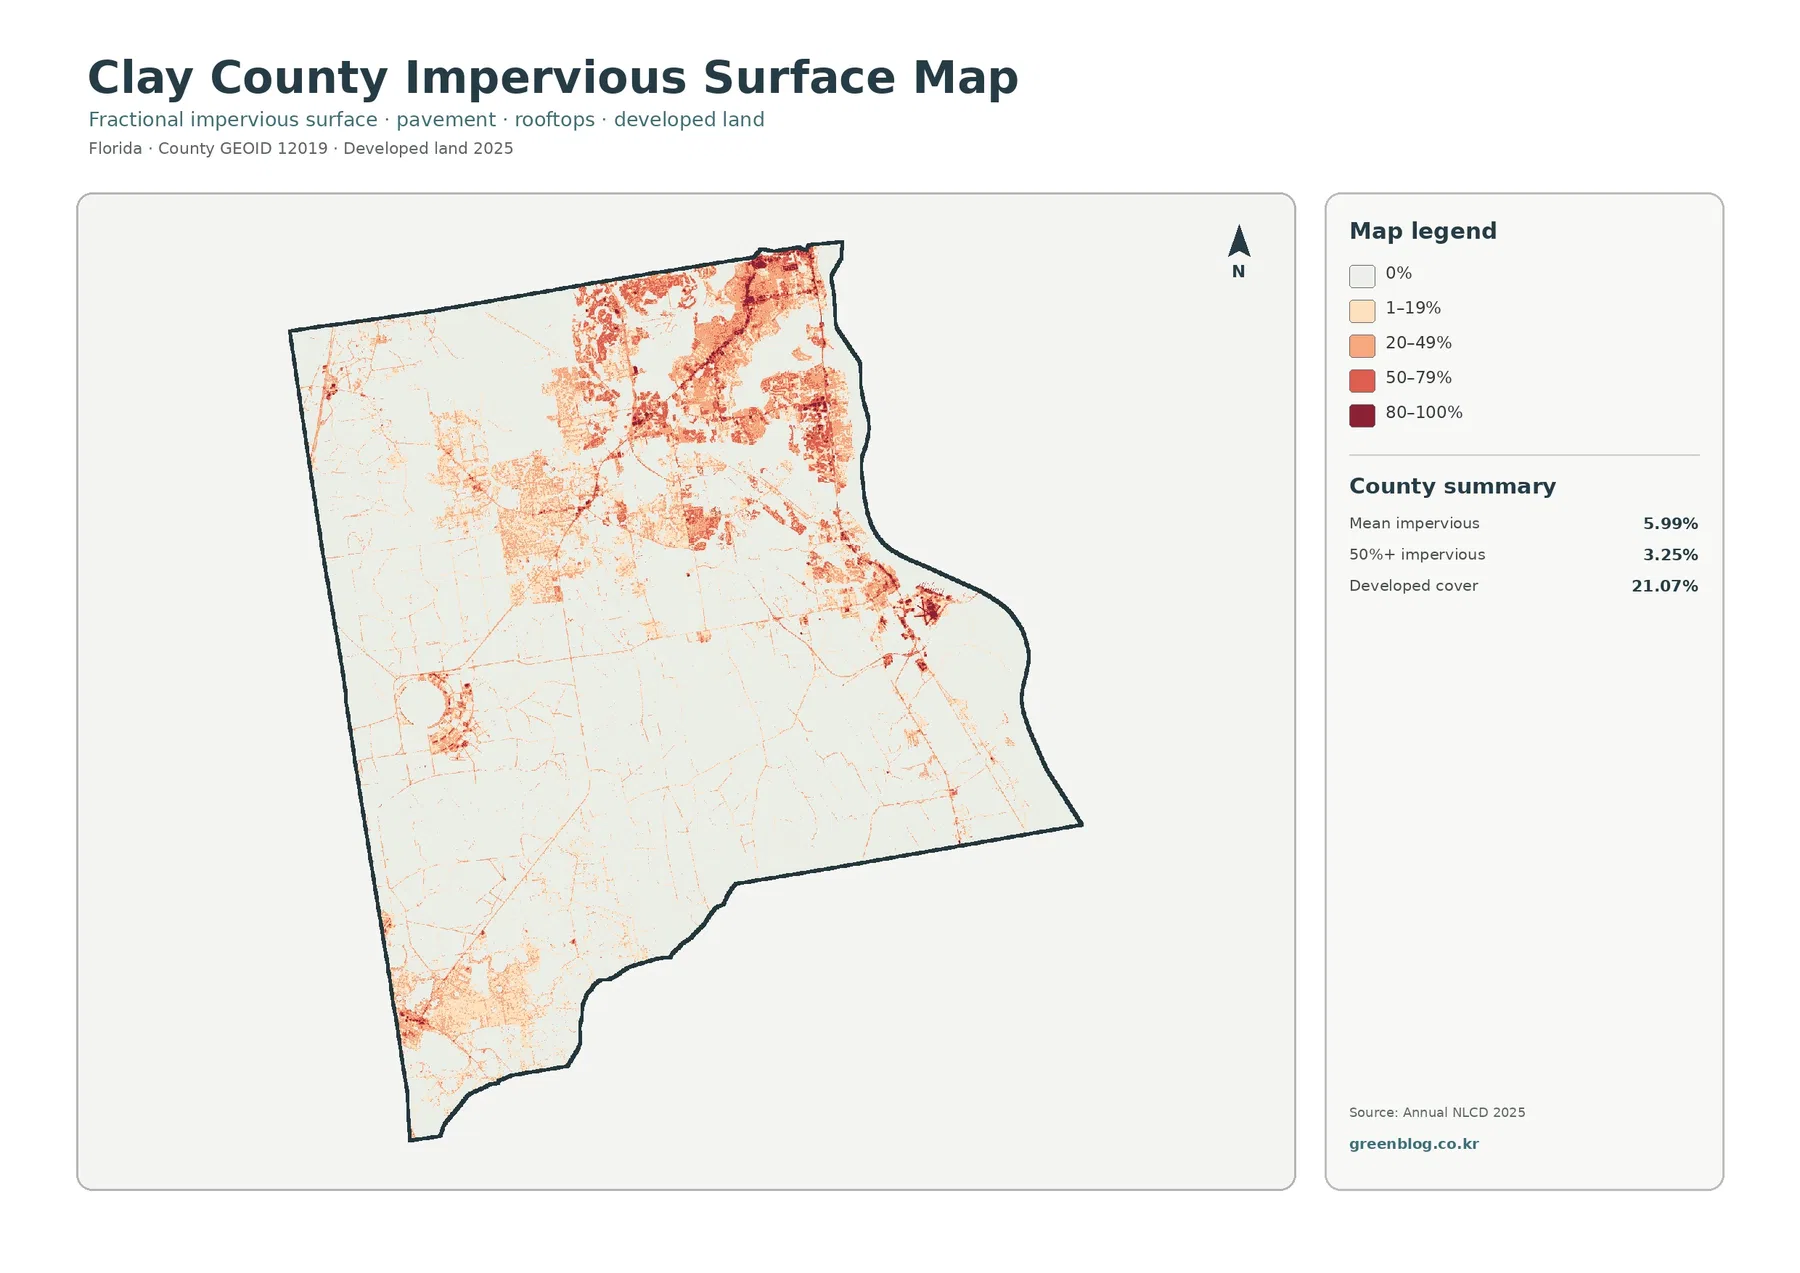
Impervious surface refers to pavement, rooftops, parking areas, and other hard surfaces that do not readily absorb rainfall. Clay County’s mean impervious value is 5.99%, and 3.25% of the county is mapped at 50% impervious or higher. Those values are much lower than the 21.07% developed-cover share because developed land can still contain lawns, trees, open soil, and other permeable surfaces.
The darkest impervious colors cluster in the northeast and north-central portions of the county. These concentrations broadly match the strongest developed areas on the full land-cover map. Thin linear features also connect many of the darker patches, which is consistent with transportation and built-surface corridors, although this is not a road map and does not identify individual streets.
A second developed concentration appears along the east-central side, while a separate cluster is visible toward the southwest. In contrast, much of the western forest interior remains very pale. That internal variation is the reason a single countywide average should never be used as a substitute for the map itself.
The Branan Field Master Plan is useful context for the concentration north of the county’s center. Clay County describes the area between Orange Park and Middleburg as a long-term growth-management focus involving transportation, public facilities, development, and environmental protection. The impervious map can be used to compare current surface intensity with that broader planning context, but it cannot identify the age or cause of individual developments.
High imperviousness should not be treated as a flood-risk map. Hard surfaces can affect runoff, but flood conditions also depend on rainfall, drainage, soil, topography, river levels, and other factors. Property-level decisions should rely on Clay County and FEMA flood resources rather than the color intensity in this image.
For a presentation, placing 21.07% developed cover beside the 5.99% mean impervious value is an effective way to explain that the two measurements describe different things. One classifies land as developed, while the other estimates how much of the surface is actually hard and water-resistant.
The 2025 map makes the west-to-east change easy to see
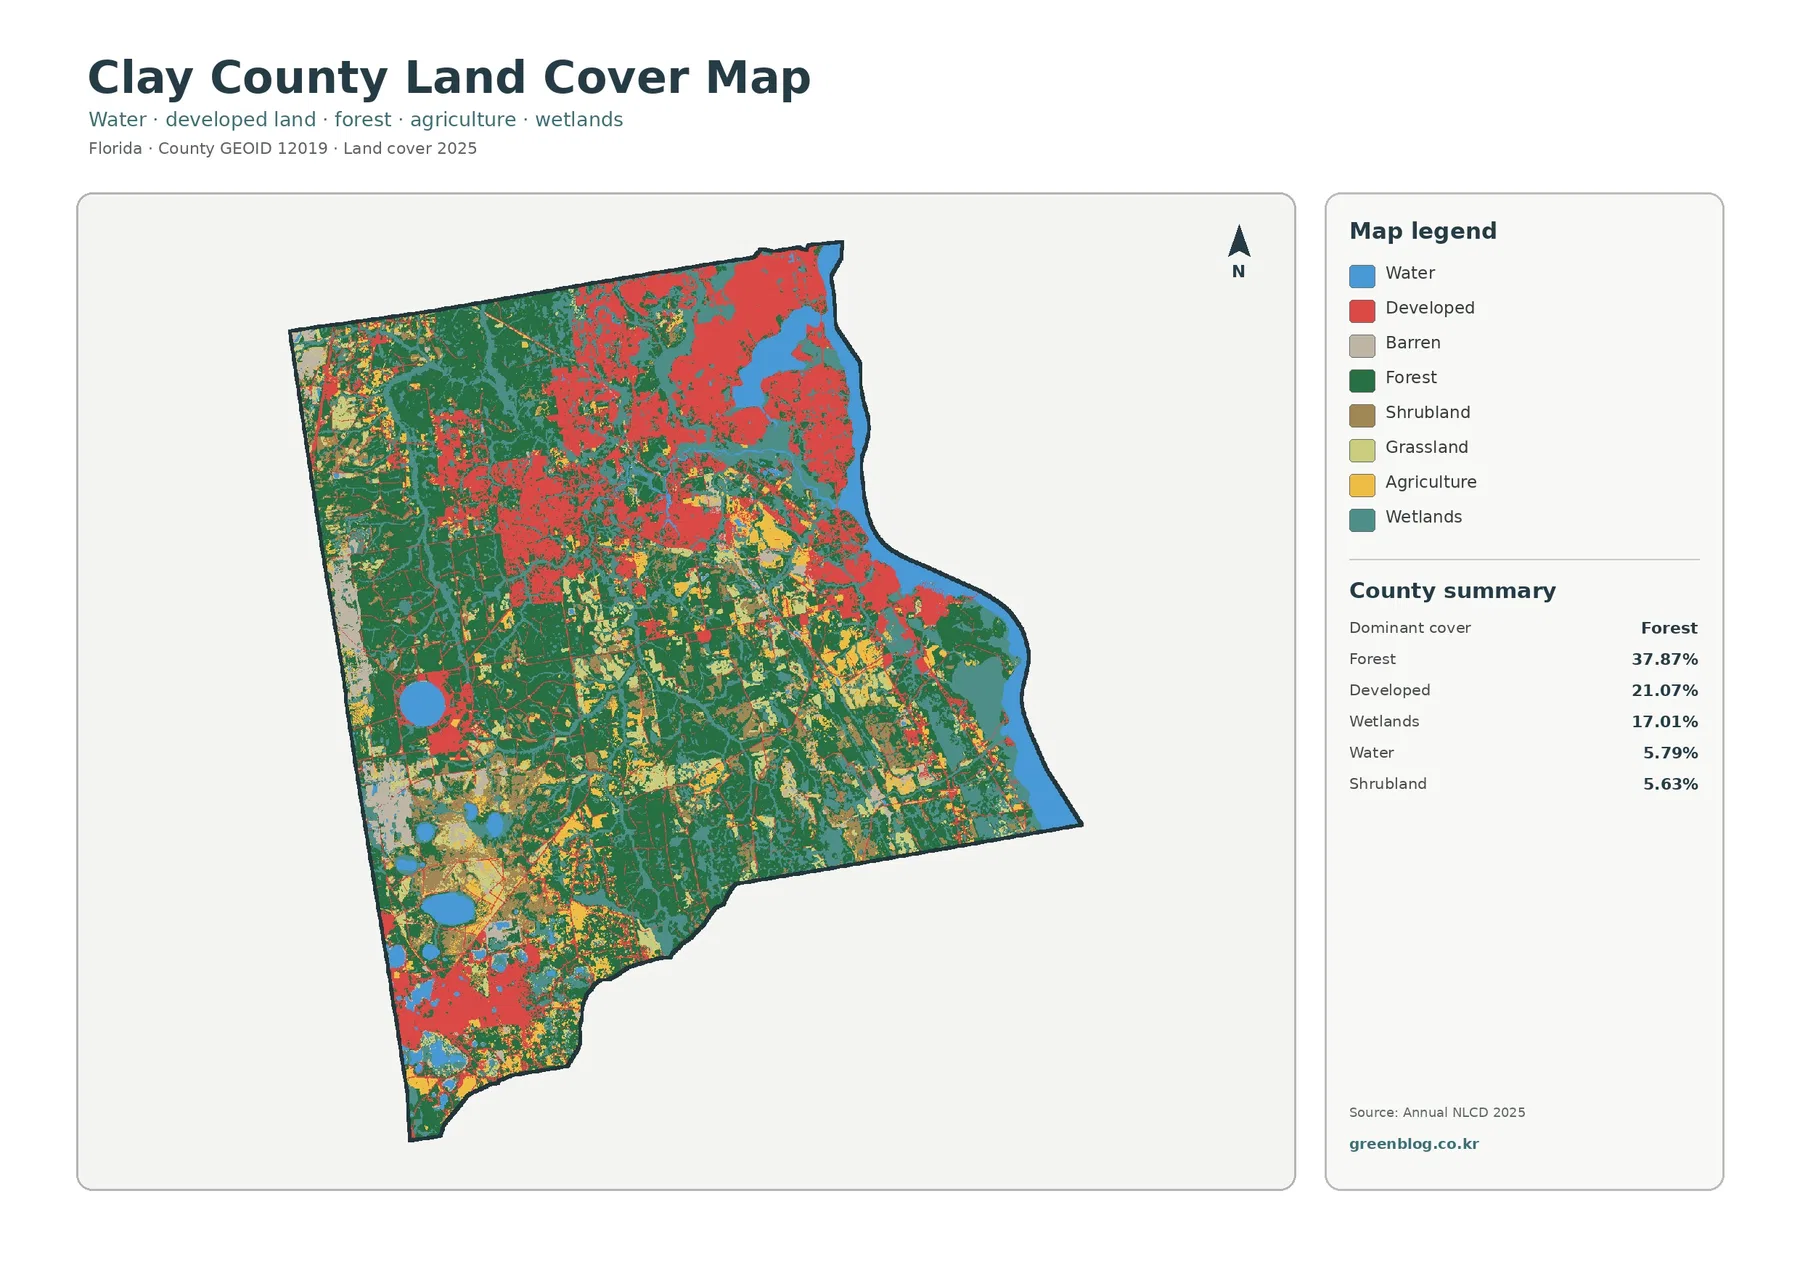
The full land-cover map is the best place to start because it preserves all major classes in one frame. Forest dominates much of the western half, development is strongest in the north and northeast, and the eastern boundary is defined by blue water and adjacent wetlands. The central portion is more mixed, with forest, agriculture, development, shrubland, and wetland patches meeting at short distances.
The broad blue area on the east provides an important geographic reference. Clay County information for Camp Chowenwaw notes that Black Creek meets the St. Johns River, while the North Fork and South Fork connect inland waterways and wetlands to that larger river system. Those official descriptions give useful context to the water-and-wetland pattern visible along the eastern side.
The southeast contains an especially mixed combination of wetlands, forest, water, and developed land. A teal patch on this map identifies a land-cover class, not a surveyed jurisdictional wetland boundary. Wetland regulation, parcel status, and development eligibility require separate official mapping and site-specific information.
Agriculture represents 5.54% of the county. Yellow agricultural areas are much smaller than the major forest and developed zones, but they recur through parts of the center, west, and south. Their distribution is easier to understand when the countywide percentage is considered together with their actual locations rather than treated as one continuous agricultural district.
Shrubland at 5.63% and grassland at 4.35% occupy smaller shares. They appear as scattered patches within the larger forest, agricultural, and developed pattern instead of forming a single dominant open landscape. In Clay County, the major story remains the combination of forest, development, wetlands, and water.
Water totals 5.79%. The St. Johns River edge contributes an obvious part of that share, but interior lakes and waterways also appear in blue. For that reason, the county’s water percentage should not be described as if it came from the eastern river alone.
The 1985–2025 comparison needs to be read as classification difference, not a single change rate
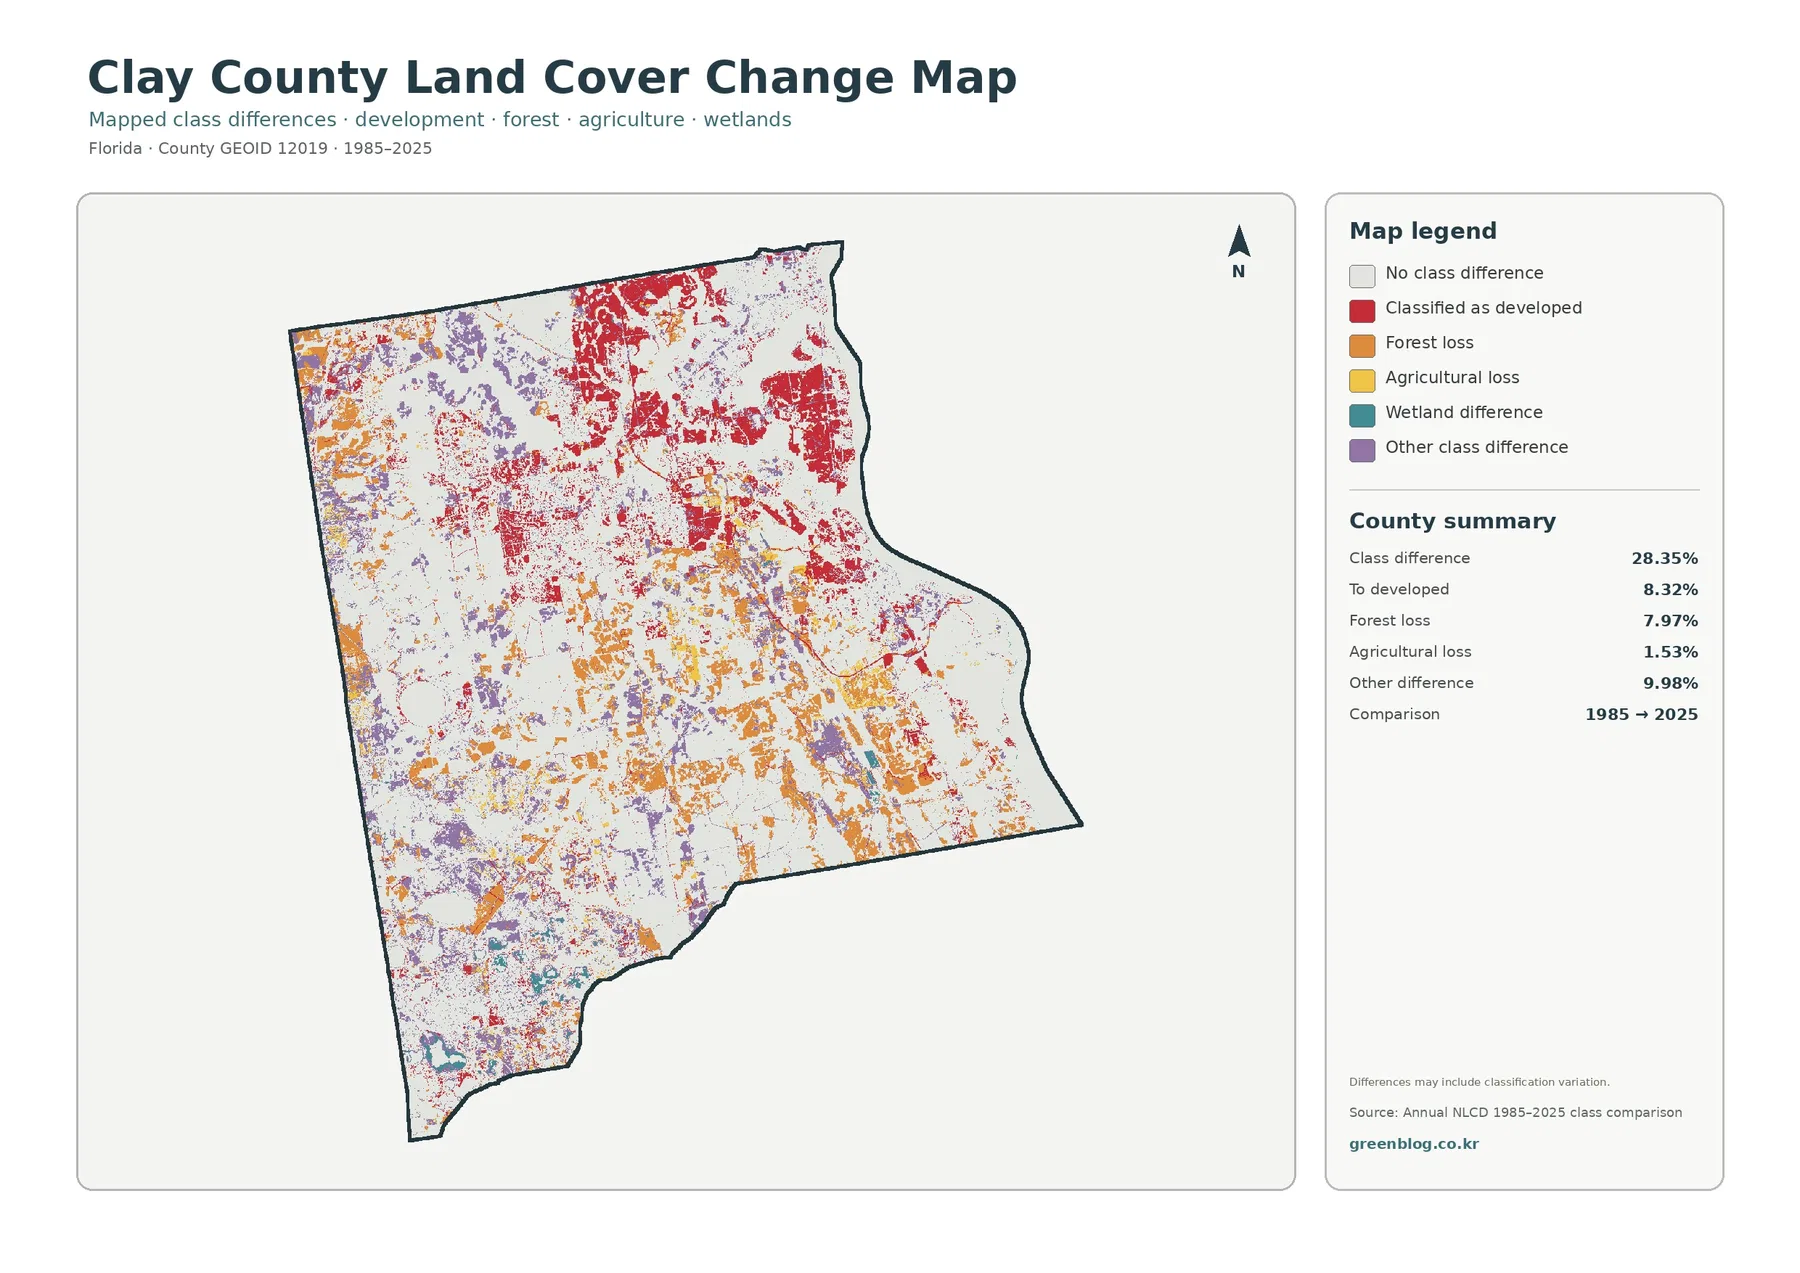
The change map reports a total class difference of 28.35% between 1985 and 2025. That figure represents cells whose mapped class differs between the two endpoints. It should not be interpreted as proof that 28.35% of the county underwent one permanent physical change, because classification methods and image conditions can also contribute to differences.
The summary lists 8.32% as classified to developed. Red change areas are most noticeable in the north and north-central parts of the county, with smaller patches continuing through the center and east. Comparing those cells with the 2025 map is useful for locating places where long-term class differences overlap today’s developed footprint.
Forest loss is listed at 7.97%. Orange areas are spread through the west, center, and south rather than being confined to one location. The category identifies a class transition away from forest between the two endpoints, but it does not by itself reveal whether the cause was development, agriculture, harvesting, natural disturbance, or a classification difference.
Agricultural loss is much smaller at 1.53%. Yellow change cells occur around some of the agricultural areas, but the endpoint comparison cannot show every intermediate land-cover state. A site could have changed more than once between 1985 and 2025, and that full history is not contained in a two-date map.
Other class difference accounts for 9.98%, the largest of the detailed summary categories. Purple patches are distributed in several parts of the county, especially the west, center, and south. Because this category combines differences not assigned to the highlighted development, forest-loss, or agriculture-loss classes, it should be mentioned whenever the overall 28.35% value is discussed.
Wetland differences also appear in teal. Wetlands can be difficult to classify consistently along narrow edges or in areas where water levels and vegetation vary. Those cells are useful as locations for closer investigation, but they should not automatically be described as wetland destruction or wetland creation without additional evidence.
Forest and farmland become clearer when development is pushed into the background
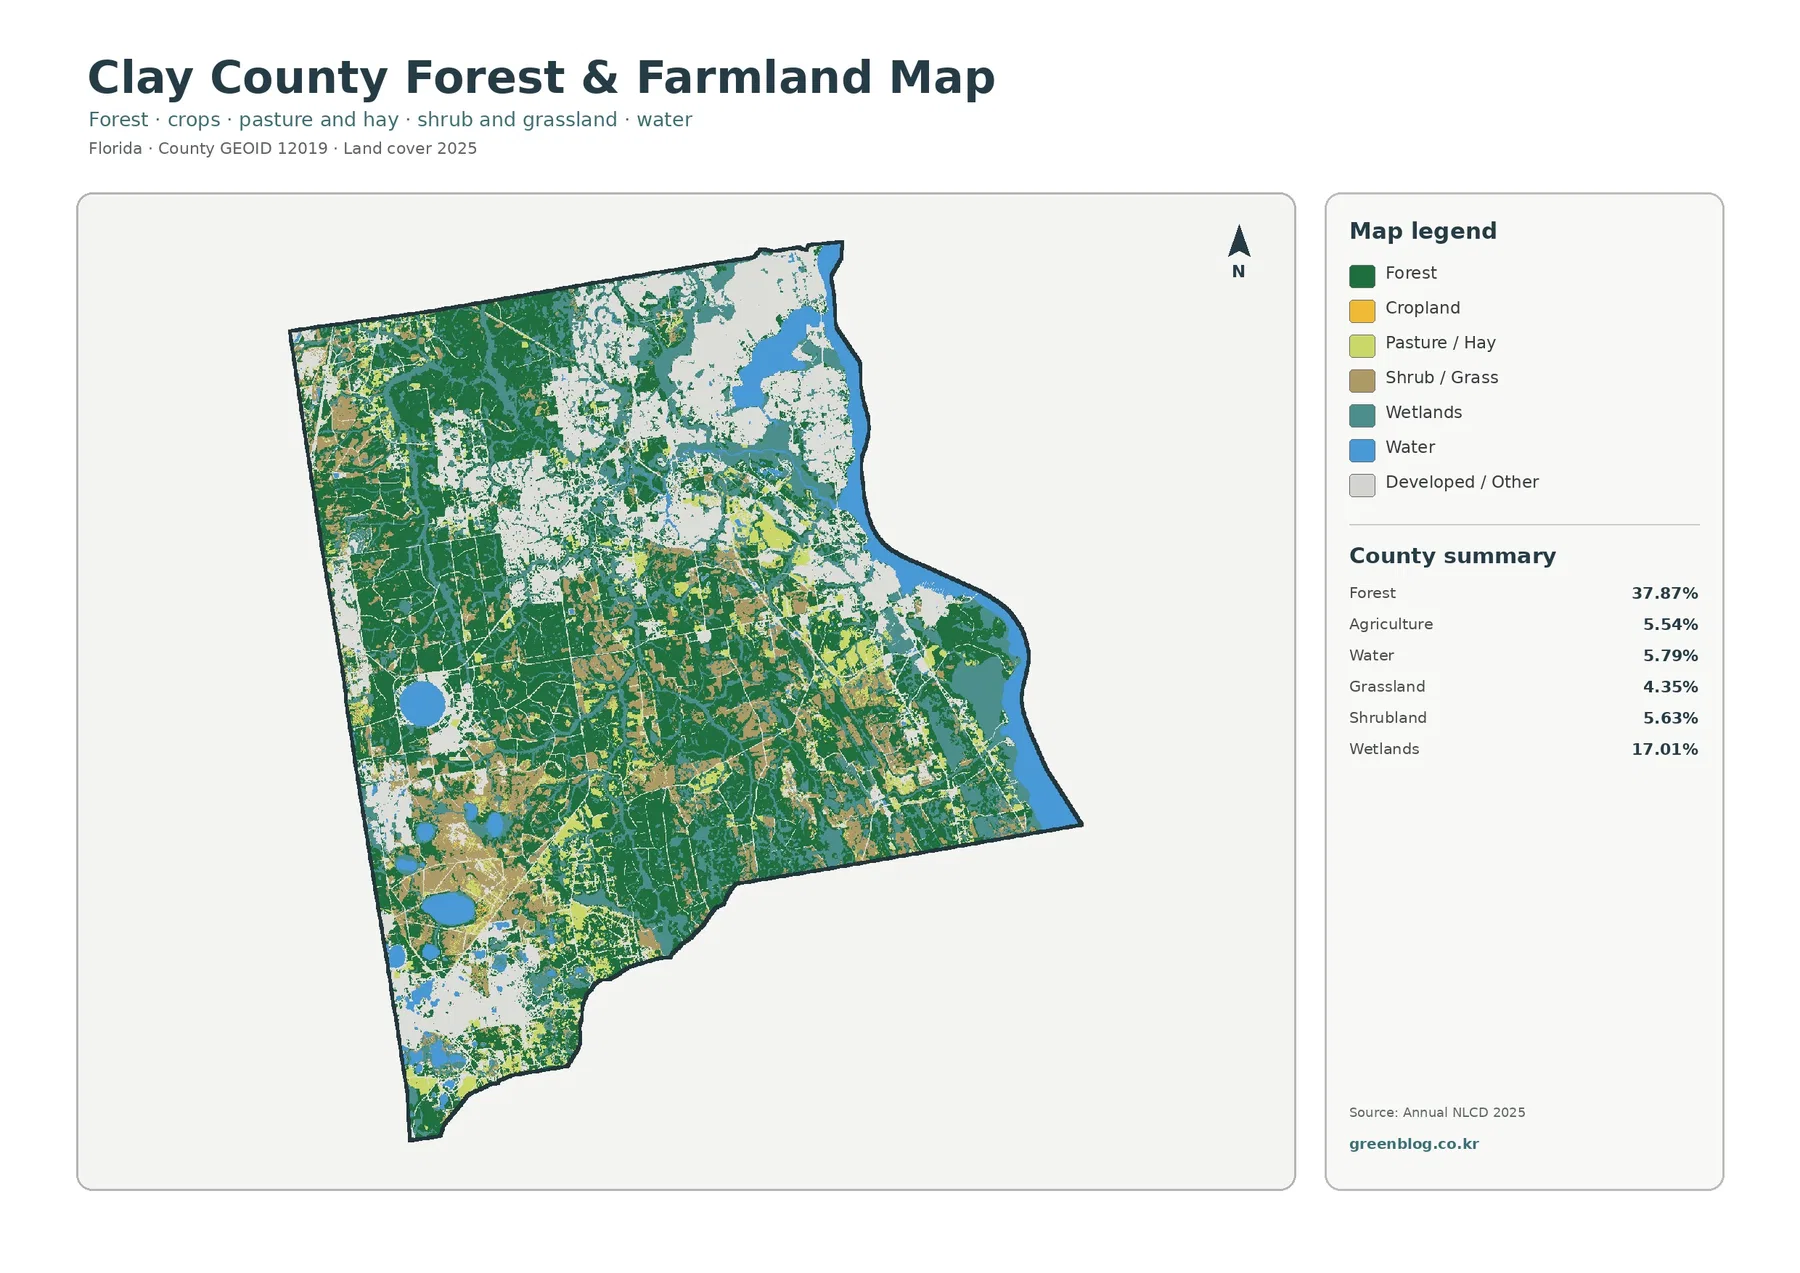
The forest-and-farmland version simplifies the developed and other classes, allowing green forest and agricultural colors to stand out. Broad forest remains obvious across the west and southern interior, while smaller forest patches persist around the more developed north. This view is especially useful when the full map feels too busy for a classroom or presentation.
Jennings State Forest is a strong local reference for understanding the northern and northwestern forest landscape. Florida Forest Service describes more than 15 natural community types there and identifies North Fork Black Creek and other tributaries as important features. The supplied image does not trace the management boundary, so it should not be used to identify whether a particular green cell lies inside the state forest.
Agriculture is modest at the county scale, but the map shows that it is not absent. Cropland and pasture or hay are separated in the legend, and both occur as smaller patches among forest, wetlands, and developed areas. Treating every yellow-green agricultural color as the same kind of farming would erase an important distinction in the map.
Many forest-agriculture edges look irregular and finely divided. Some of that pattern may reflect real landscape boundaries, while some can result from raster classification. A raster divides the ground into cells, and a single cell can contain trees, grass, a road, and open soil. Small patches therefore should not be read as exact parcel outlines.
Clay County’s Forests and Farms Conservation Lands Program shows that working forests, farms, wildlife habitat, and drinking-water resources are active local conservation topics. The program does not designate every forest or agricultural patch shown here, but it provides a useful official source for understanding why those land types matter in county planning and conservation discussions.
For teaching, the contrast between 37.87% forest and 5.54% agriculture is easier to understand on this simplified map than in a table alone. The forest forms large connected areas, while agricultural cover appears in smaller separated blocks. Pairing the percentages with the visible shapes gives students a better sense of scale.
Black Creek and the St. Johns River add geographic context to the mapped wetlands and water
Clay County’s Camp Chowenwaw information describes Black Creek as a blackwater stream that joins the St. Johns River. It also notes that North Fork Black Creek begins at Kingsley Lake and that South Fork is fed by wetlands and smaller streams. These named water features help explain why blue and teal land-cover classes appear both along the eastern edge and within the county.
Jennings State Forest provides another official link between forest and water. Florida Forest Service describes blackwater streams, dome swamps, seepage streams, and ravines connected to North Fork Black Creek. This supports the broader observation that western and northwestern forest is not simply dry upland forest; wetland and stream environments are mixed into the larger green landscape.
The long water edge on the east creates a strong visual contrast with the forested west. Looking across the county from one side to the other shows how open water, wetlands, forest, and development occupy different proportions within a relatively compact area. This is one reason the four-map set works well for regional geography and environmental education.
Official planning information and land-cover data answer different questions. Land cover describes what the surface is classified as, while a comprehensive or master plan addresses policy, growth, conservation, and future land use. They can be compared for context, but a land-cover color should never be substituted for a zoning or planning designation.
Choose the map that matches the question you are trying to answer
For a quick county overview, start with the full 2025 land-cover map. It makes the major proportions tangible by showing where the 37.87% forest, 21.07% developed cover, and 17.01% wetlands are actually located. Water, agriculture, shrubland, and grassland can also be compared without changing maps.
For a lesson or presentation focused on working lands and natural cover, the forest-and-farmland map is simpler. It deemphasizes development and makes forest, cropland, pasture and hay, wetlands, and water easier to distinguish. Adding official Jennings State Forest or county conservation information can make the discussion more locally specific.
Use the impervious-surface map when the question is about built intensity rather than the existence of developed land. The north stands out immediately, and the contrast with the pale western forest is clear. The 5.99% mean and 3.25% at 50% impervious or higher provide useful numerical context without replacing the spatial pattern.
For long-term comparison, begin with the 1985–2025 map and then return to the 2025 land-cover map for the same locations. The 8.32% classified-to-developed and 7.97% forest-loss values identify important categories of difference, but explaining why a location changed requires more dates and local records.
When printing all four maps, an effective sequence is current land cover, forest and farmland, impervious surface, and then long-term comparison. Each map uses the same county outline, so a location can be followed from one page to the next. Keep the legend visible because the colors and categories change between maps.
Practical ways to use the four maps in a report or classroom
A classroom exercise can begin with the question, ‘Where is the largest cover class actually located?’ Students can identify the broad western forest and then connect that pattern to the 37.87% summary value. The next step can be a comparison with the developed north and the water-and-wetland eastern edge.
An environmental presentation can separate forest and wetlands instead of treating all natural land as one category. Forest covers 37.87%, while wetlands account for 17.01%, and each has a different geographic pattern. Official information from Jennings State Forest and Clay County’s conservation program can add local context without changing what the land-cover map itself proves.
A development-focused presentation can pair the 21.07% developed-cover share with the 5.99% mean impervious surface. The difference between the two values helps explain why a developed classification does not mean that every part of the area is paved. The map then shows where harder surfaces are concentrated within that broader developed footprint.
For a change discussion, avoid presenting 28.35% as one simple transformation rate. Breaking the total into 8.32% classified to developed, 7.97% forest loss, 1.53% agricultural loss, and 9.98% other difference gives the reader a much more careful understanding of what the comparison contains.
For printing or slide preparation, the original JPG files in the ZIP below are preferable to screenshots. Each image includes its title, legend, and county summary in a consistent layout. Higher image resolution improves presentation quality, but it does not create parcel-level detail that is absent from the source classification.
Land cover is not zoning, ownership, or a parcel survey
Land cover classifies what is on the ground or surface, such as forest, water, agriculture, wetland, or developed cover. It is different from zoning, legal land use, ownership, tax status, or a determination of whether a property can be built upon. A colored cell should never be used as a legal parcel conclusion.
Annual NLCD is a raster dataset, meaning the landscape is represented as a grid. In the real world, a grid cell may contain trees, grass, pavement, a roof, and bare soil at the same time. The map simplifies that mixture into a class or an impervious estimate, so small boundaries may not line up exactly with features on the ground.
The 2025 map represents the supplied classification year. Construction, vegetation change, flooding, harvesting, or other events after that observation period may not appear. Likewise, the 1985–2025 comparison uses two endpoints and cannot show every intermediate change that may have occurred.
These maps are well suited to county-scale comparison, environmental education, broad planning context, and presentation graphics. They are not a replacement for a survey, parcel map, wetland delineation, flood-zone map, or permitting record. Those decisions require the appropriate current agency data.
Frequently Asked Questions
What is the largest land-cover class in Clay County?
Forest is the largest 2025 class at 37.87%. Developed cover follows at 21.07%, and wetlands account for 17.01%. Water is 5.79%, shrubland 5.63%, and agriculture 5.54%. Forest is especially extensive in the west and interior, while the northern part of the county contains a much stronger developed pattern.
Which map is best for examining the developed north?
Use the full land-cover map to see the entire developed footprint and the impervious-surface map to see where pavement, rooftops, and other hard surfaces are most concentrated. Comparing the two also makes it clear why 21.07% developed cover and 5.99% mean imperviousness are different measures.
Does the 28.35% class difference mean that all of that land physically changed?
No. The value identifies cells classified differently in 1985 and 2025, and some differences may reflect classification or image conditions as well as real land-cover change. The highlighted categories are useful for locating areas to investigate, but they do not establish the cause of a change.
Map File Information
The four original JPG maps used for this Clay County land-cover article are provided together in one ZIP file.
- Included Files: Use only the versions confirmed in the article and supplied images
- File Type: Use the confirmed download contents
- Intended Use: Printing, education, presentations, and map-based projects
Related Maps
- Alachua County Florida Land Cover Map
- Baker County Florida Land Cover Map
- Bay County Florida Land Cover Map
Sources and References
- MRLC Annual NLCD Data – source portal for Annual NLCD land-cover and change data
- USGS Annual NLCD Land Cover Classification – definitions and classification information for land-cover categories
- U.S. Census Bureau TIGER/Line Shapefiles – county boundary data
- Clay County Master Plans – county planning information for Branan Field, Lake Asbury, growth, and conservation
- Clay County Forests and Farms Conservation Lands Program – local conservation information for forests, farms, habitat, and water resources
- Jennings State Forest – official information on forest communities and Black Creek resources in northern Clay County
- Clay County Camp Chowenwaw – Black Creek – official local information on Black Creek, its forks, and the St. Johns River confluence
Green Map creates custom-edited map images using open geographic data sources such as geoBoundaries, Natural Earth, OpenStreetMap, and government open data.
These maps are edited visual materials, not raw data files, and are provided for education, documents, presentations, and graphic reference.