Citrus County has a land-cover pattern that changes sharply between the Gulf side, the developed interior, and large forest and wetland areas farther inland. The 2025 summary lists wetlands at 31.27%, developed cover at 28.05%, forest at 19.66%, agriculture at 10.66%, and water at 7.43%.
Four views are included here: the full 2025 land-cover map, a forest-and-farmland map, an impervious-surface map, and a 1985–2025 class-comparison map. The four original JPG files are also available together in one ZIP for printing, teaching, presentations, and county-to-county comparison.
Table of Contents
Start with the west-to-interior contrast, not a single dominant class
Wetlands are the largest mapped class, but they do not overwhelm every part of Citrus County. Broad wet areas appear along the western side and again near the eastern edge, while developed cover fills a large central and north-central zone. This close balance between 31.27% wetlands and 28.05% developed cover is one of the most useful facts for reading the county as a whole.
Forest adds another major piece of the pattern. At 19.66%, it forms substantial dark-green blocks, especially in the southern interior, rather than appearing only as small fragments. Agricultural cover is smaller at 10.66%, yet the yellow areas are easy to pick out in the north and southeast where they meet forest, wetlands, and developed land.
Water accounts for 7.43%. On the west side, open water and wetlands interlock in an irregular coastal pattern instead of forming a simple shoreline band. Inland lakes and waterways add more blue areas, so it is important to keep the water class separate from the wetland class when comparing percentages.
Official information from Florida State Parks helps explain the Gulf-side setting. Crystal River Preserve State Park protects more than 27,500 acres and includes salt marshes, mangrove islands, pinewoods, hardwood forest, and other natural communities where spring-fed freshwater meets Gulf water. Those local features provide context for the complex western colors, although the land-cover image is not a park-boundary map.
The interior forest also has a clear regional context. Florida Forest Service records show that Withlacoochee State Forest extends into Citrus County and includes the Citrus and Homosassa tracts. The supplied map should not be used to trace those management boundaries, but the state-forest information supports the broader observation that large managed and natural forest areas remain important within the county.
Where pavement and rooftops become concentrated
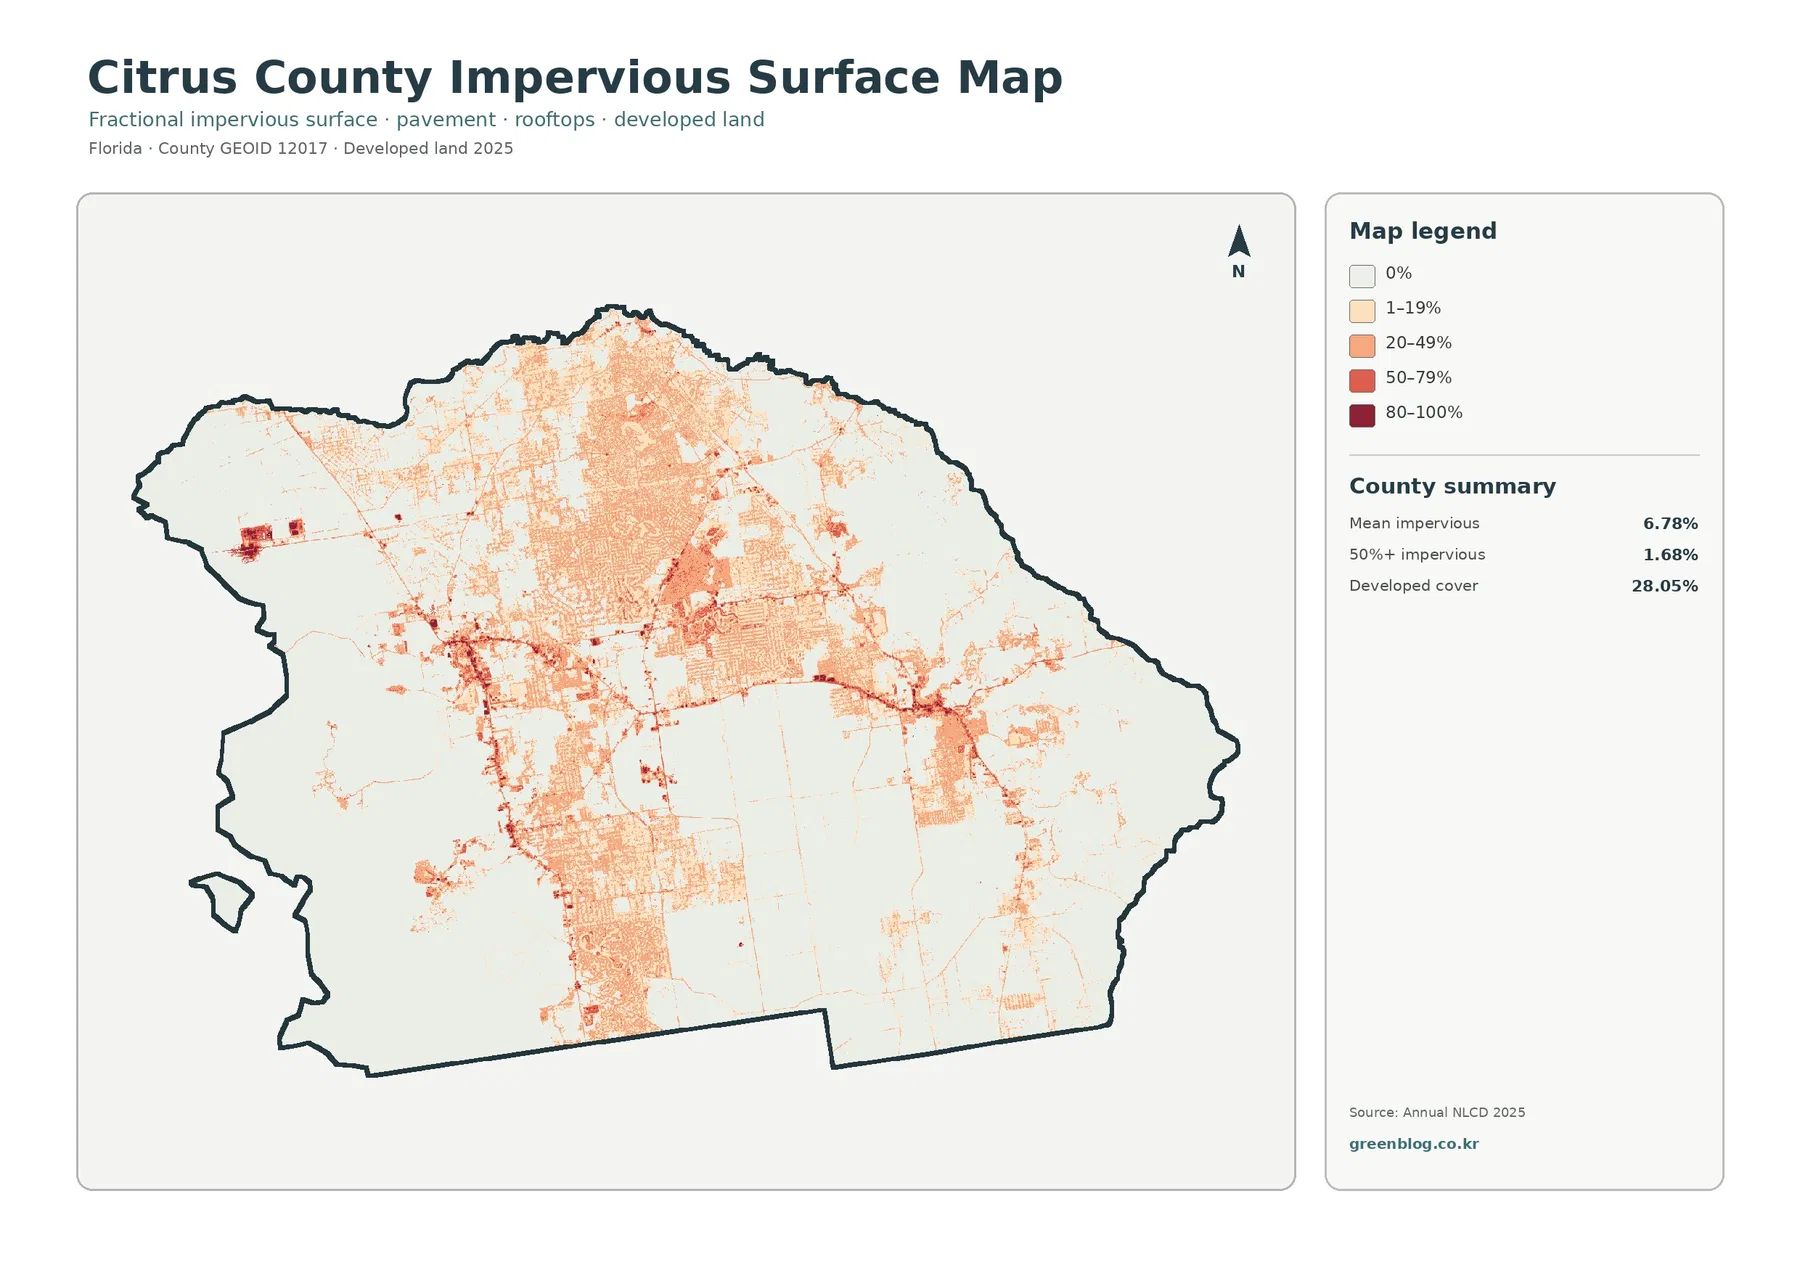
Impervious surface means pavement, rooftops, parking areas, and similar surfaces that do not absorb water easily. The countywide mean is 6.78%, while 1.68% of the county is mapped at 50% impervious or higher. These values are much lower than the 28.05% developed-cover share because developed land can still contain lawns, trees, open soil, and other permeable surfaces.
The strongest impervious colors cluster through the central and north-central portion of the county. A network of thin lines links many of those concentrations, while isolated darker patches appear farther west and south. The pattern is useful for locating dense development, but the image does not identify individual roads, subdivisions, commercial parcels, or building footprints.
Large wetland and forest areas look very different on this map. Much of the western wetland zone and the southern forest block remains pale, with only scattered developed traces. That contrast makes it easier to see that Citrus County is not uniformly urbanized even though developed cover is the second-largest class in the 2025 summary.
Imperviousness can be useful in watershed or planning discussions, but it should not be treated as a flood-risk or water-quality score. A hard-surface concentration may matter for runoff, yet drainage design, rainfall, elevation, soil, groundwater, and nearby water bodies also affect local conditions. Those questions require additional datasets.
For presentations, pairing this map with the general land-cover map is especially effective. The general map tells you where developed land is classified, while the impervious map shows which parts of that developed footprint contain the highest concentration of hard surfaces. The two measures describe related but different properties.
The 2025 land-cover map puts wetlands, development, and forest on one frame
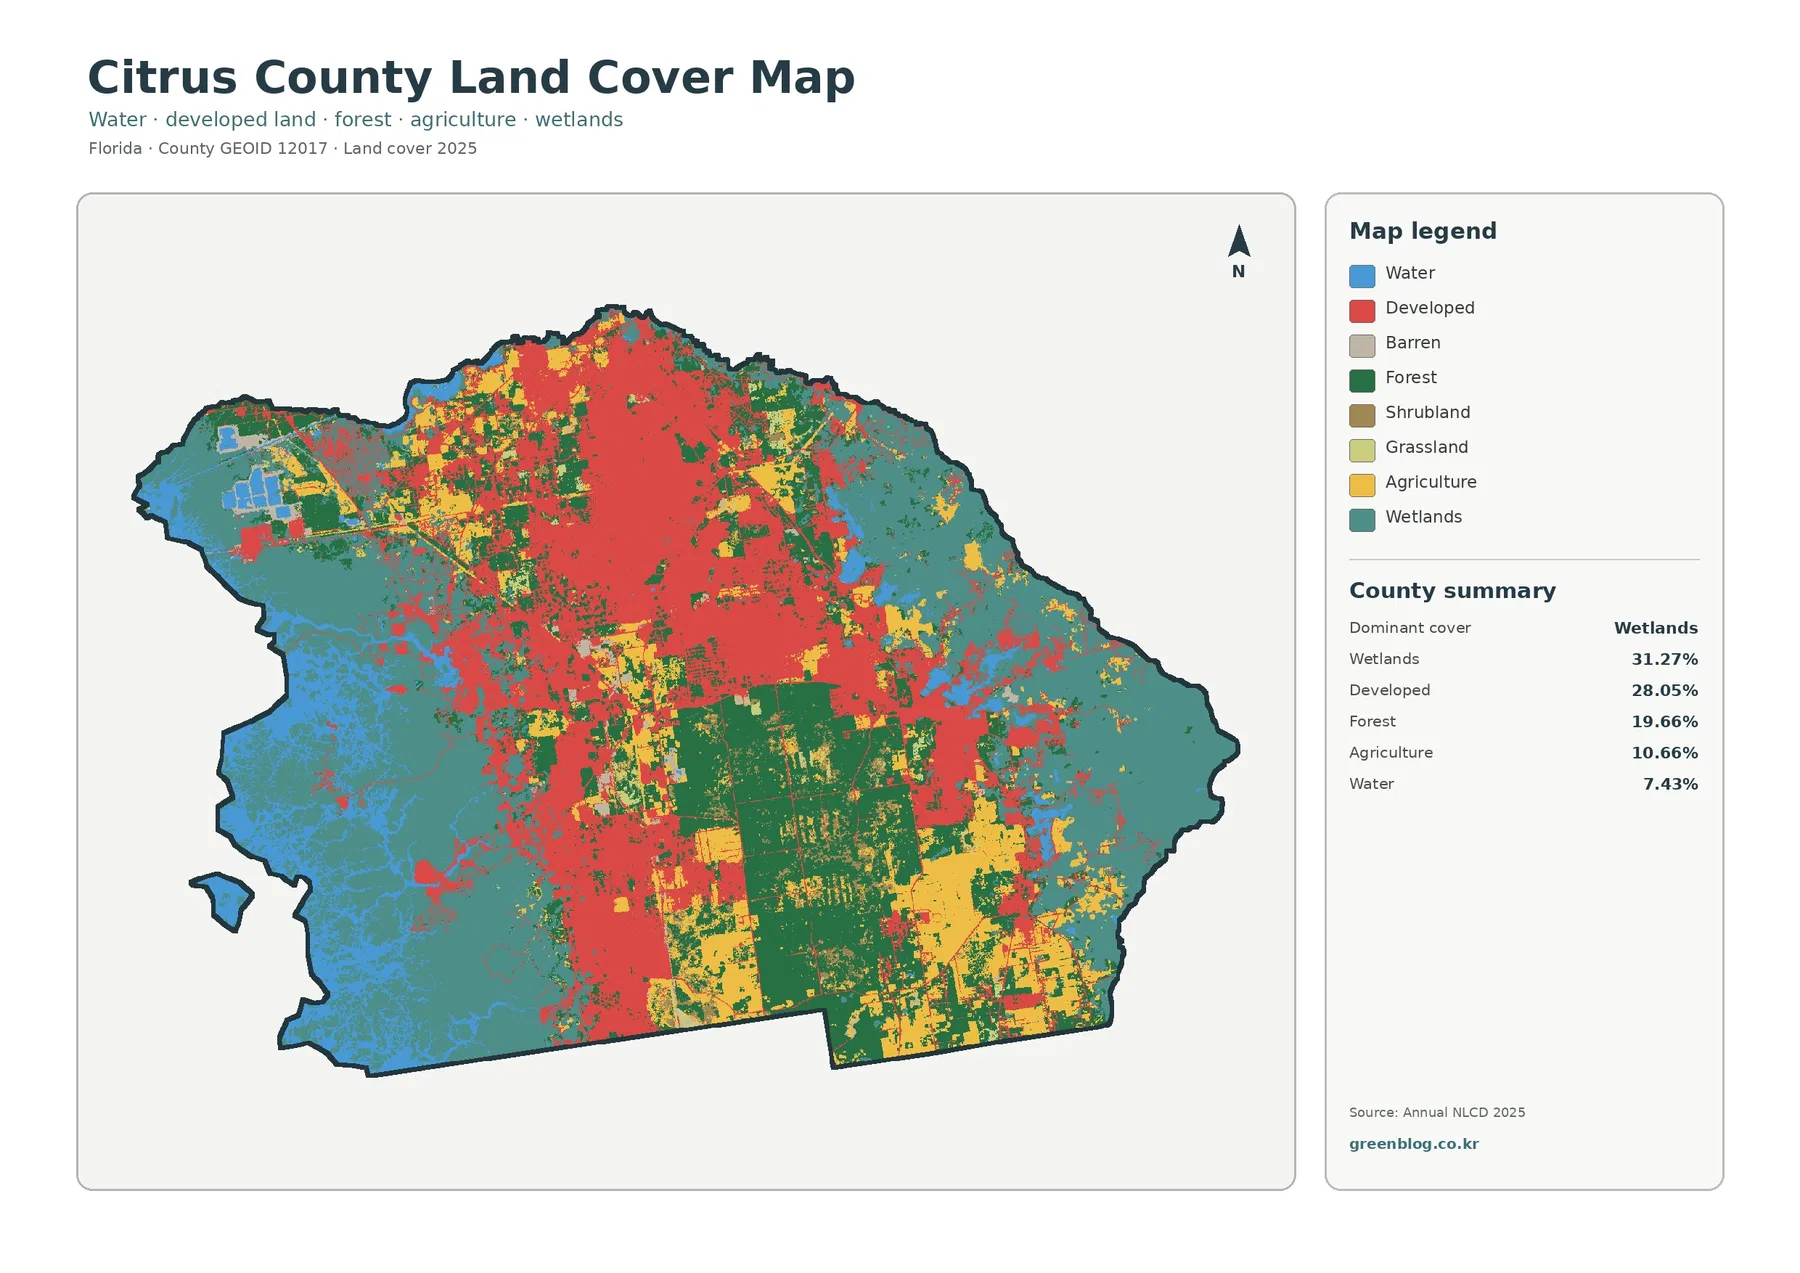
The full map is the best single image for understanding the county. Teal wetlands spread widely along the Gulf side and the eastern edge. Red developed cover dominates much of the center and north-central area, while a large dark-green forest block stands out in the southern interior. Yellow agricultural patches are most visible around the northern and southeastern portions.
The western side deserves a closer look because blue water, teal wetlands, and smaller developed patches occur close together. Southwest Florida Water Management District information identifies the Crystal River and Homosassa spring systems as major Citrus County water features. The map does not label those rivers directly, but the official hydrologic context explains why the Gulf side contains such a complicated mixture of aquatic and wetland cover.
The eastern side has a different appearance. Wetlands and water occur there too, but they are separated from the Gulf shoreline. Regional water-planning material describes the Tsala-Apopka Chain of Lakes as a large interconnected system of lakes, marshes, and open-water pools in Citrus County. That information is helpful background for interpreting inland blue and teal areas without assuming that every wetland patch has the same hydrology.
Developed cover occupies 28.05% of the county, which is unusually important when set beside the wetland share. On the map, the red area is broad rather than confined to one compact city center. Some development appears as dense blocks and some as linear or fragmented patterns, reflecting different levels of built cover rather than a single urban form.
The percentages should always be read with the geography. A county can have the same numerical share of wetlands or development as another place and still look completely different if those classes are arranged differently. Citrus County is defined by large adjacent zones and frequent boundaries between water, wetland, forest, agriculture, and developed land.
Forest and farmland stand out once developed land is muted
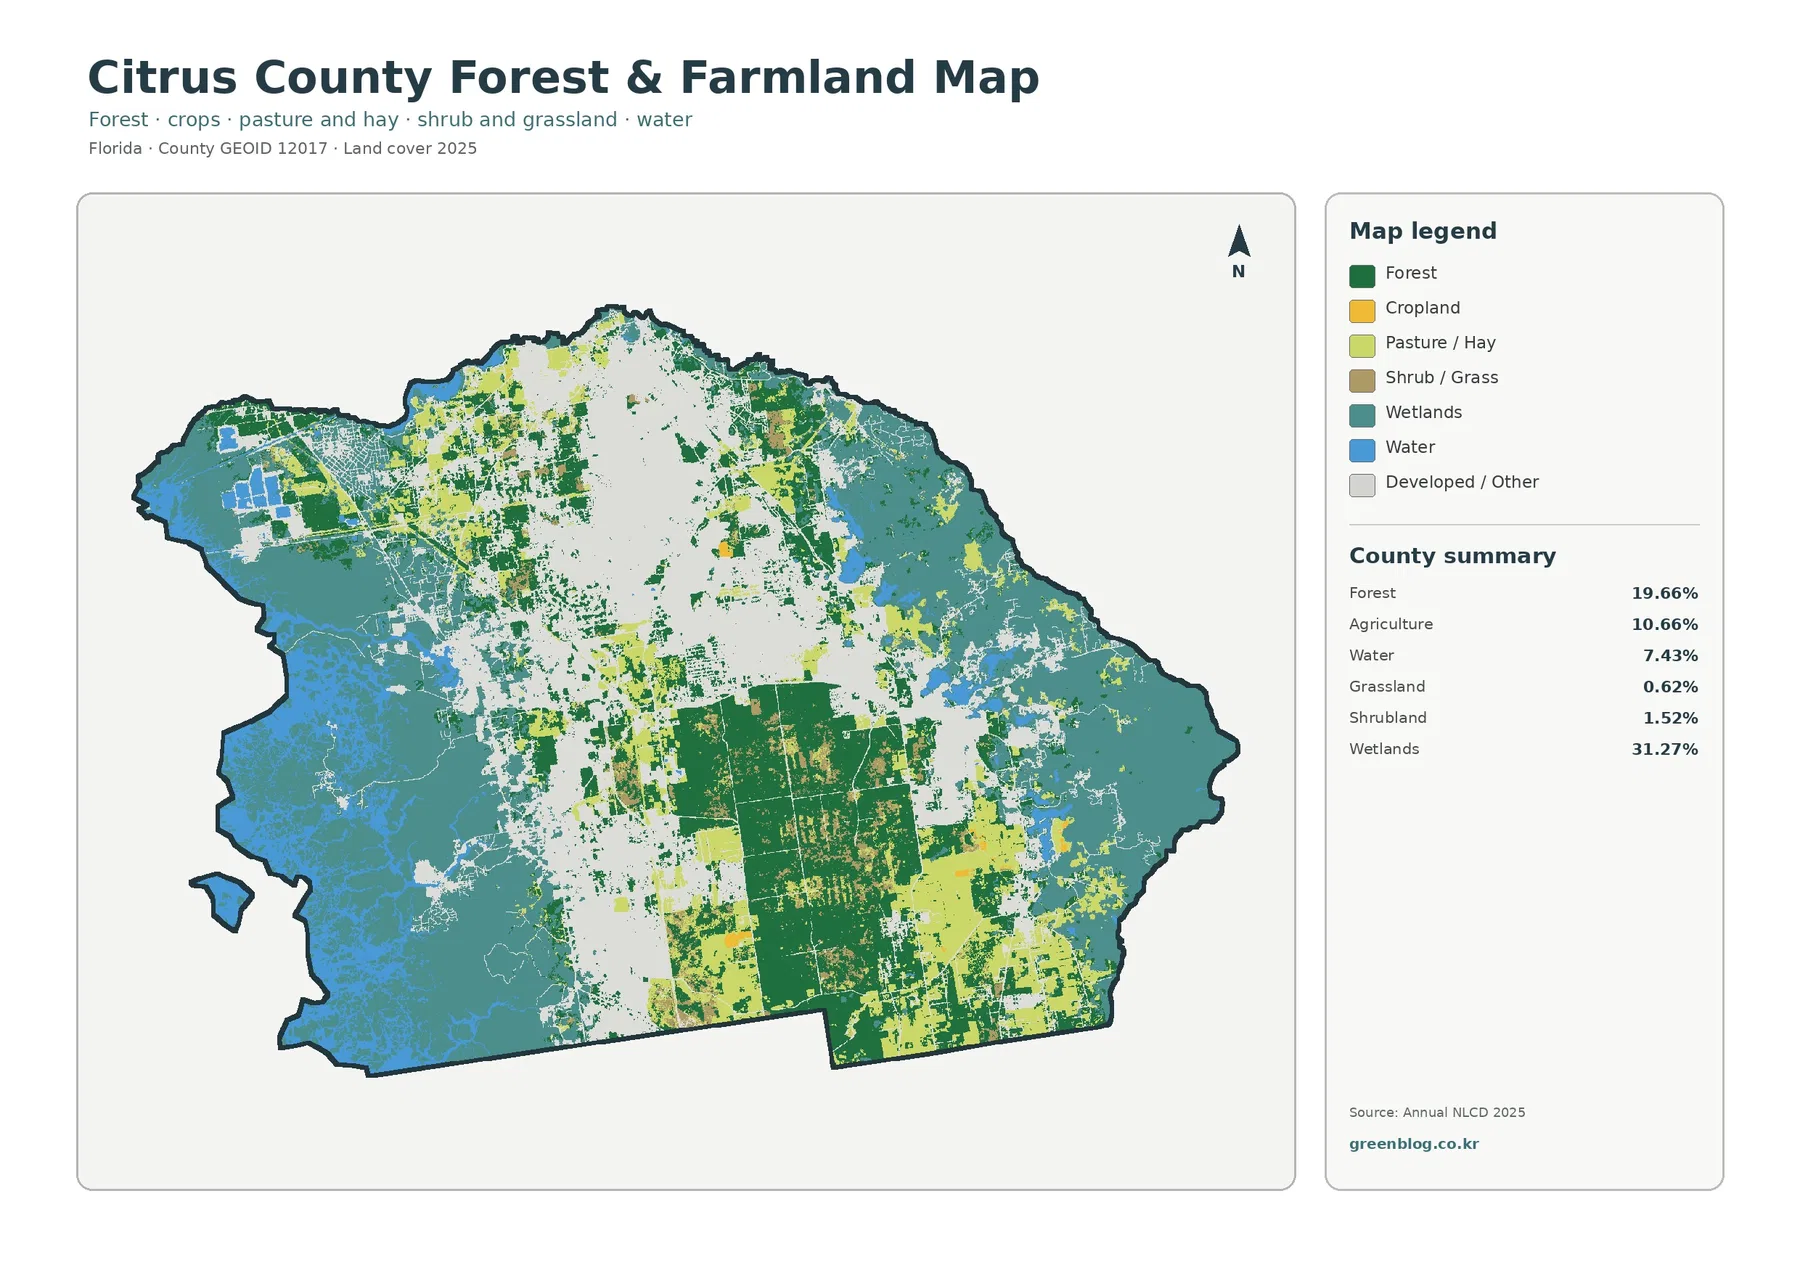
The forest-and-farmland view removes much of the visual weight of developed land, making the southern interior especially clear. Forest totals 19.66% and forms broad green areas instead of only narrow fragments. Smaller green patches also appear among developed and agricultural areas farther north.
Withlacoochee State Forest provides useful local context. The Florida Forest Service says the Citrus Tract covers nearly 50,000 acres in Citrus and Hernando counties, and the Homosassa Tract is also in Citrus County. Those tracts should not be traced from this generalized map, but their presence helps explain why substantial forest cover remains in the county.
Agriculture accounts for 10.66% in the county summary. Yellow agricultural blocks are visible in the north and southeast, often next to forest or wetland cover. The simplified legend also separates cropland from pasture and hay, so broad agricultural areas should not automatically be described as a single crop type.
Grassland is only 0.62% and shrubland 1.52%. Those are small shares compared with wetlands, developed land, forest, and agriculture. This matters because generic descriptions of open grassland would fit the map poorly; Citrus County is much better described through its wetland, forest, developed, water, and agricultural contrasts.
Land cover is not the same thing as land ownership or zoning. A green forest cell may fall on public land, private timberland, or another ownership type, and a yellow agricultural cell does not prove that a parcel is legally zoned for agriculture. The map describes surface cover, not development rights or parcel status.
What the 1985–2025 comparison can—and cannot—say
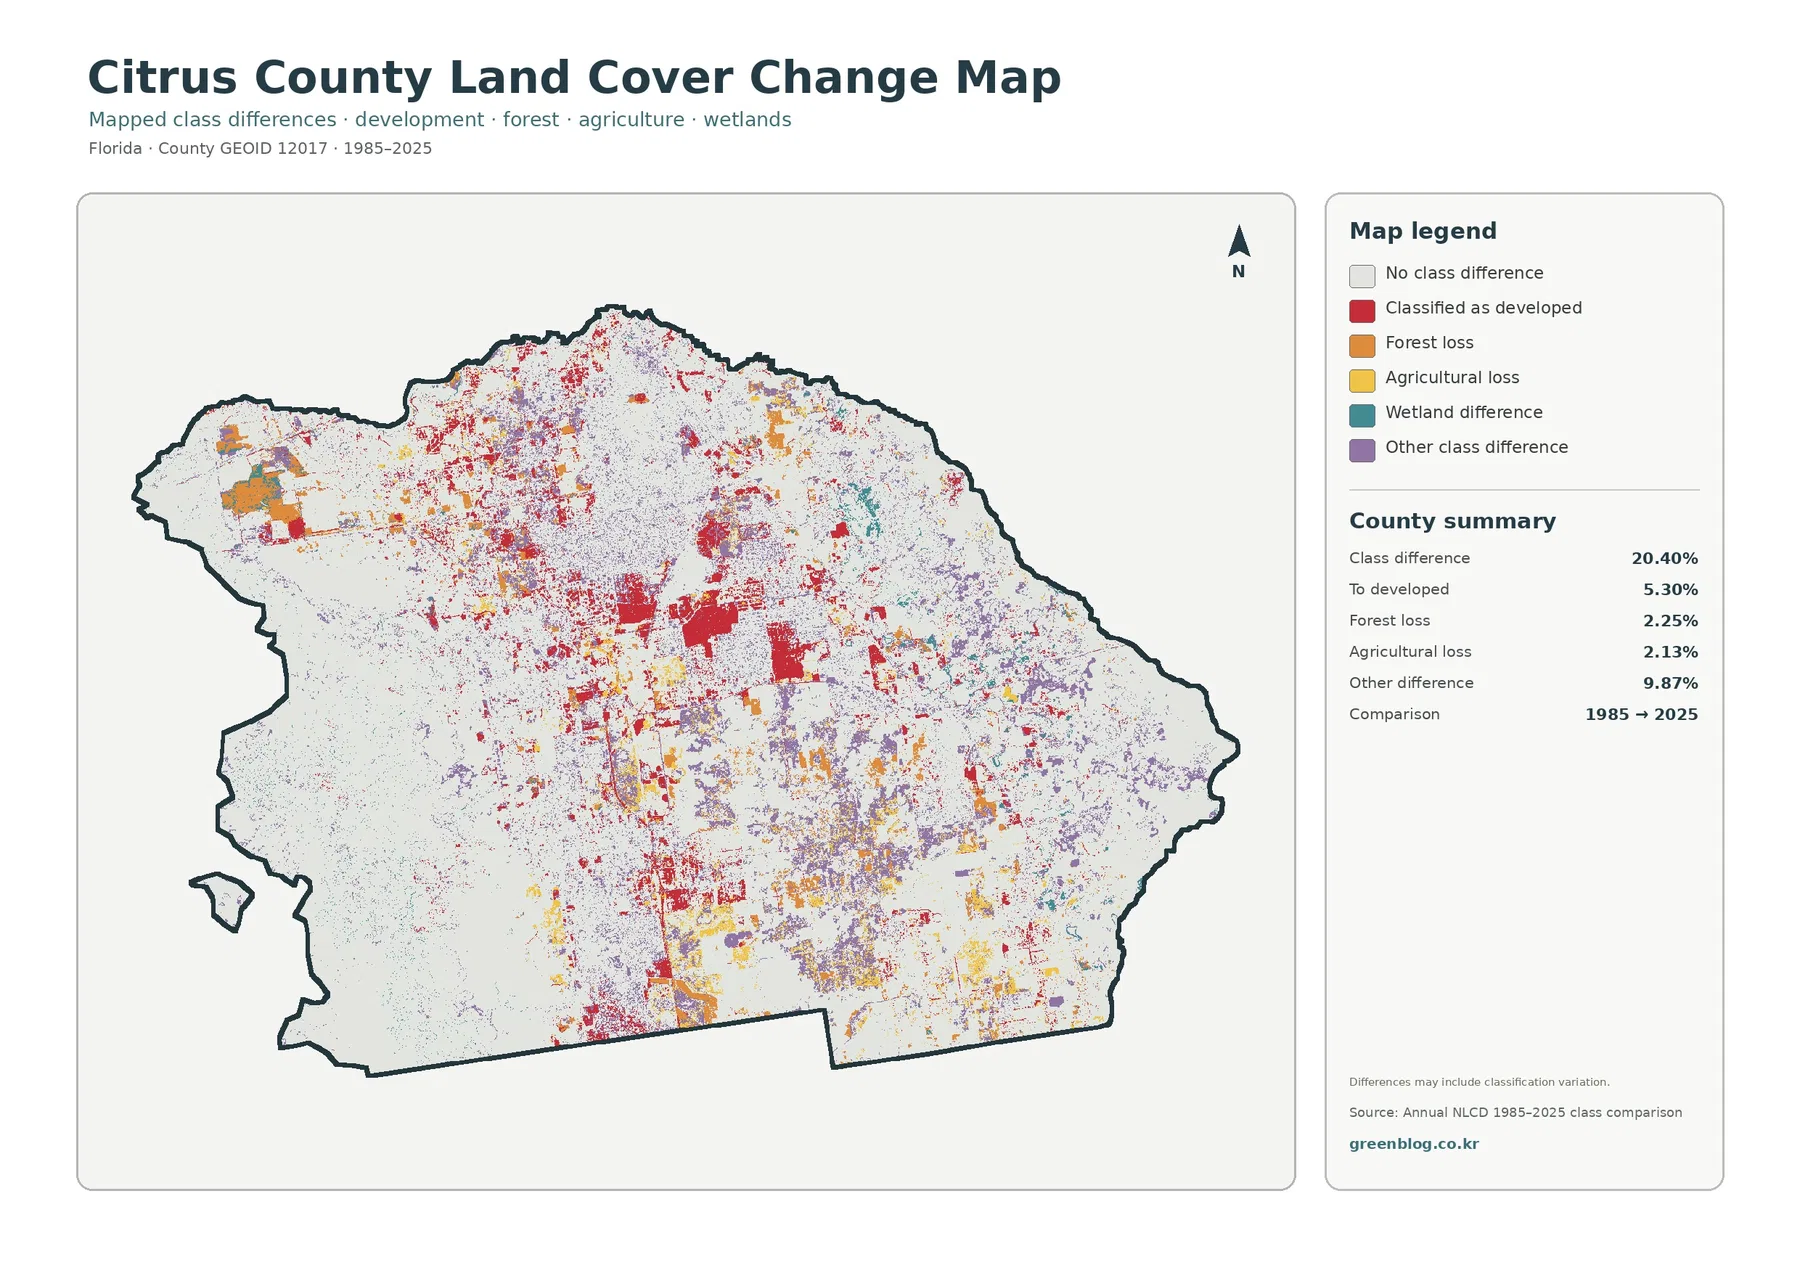
The comparison map reports class difference across 20.40% of the county. That number means the mapped class in 1985 differs from the mapped class in 2025 at those cells. It is not a direct measurement of acres physically transformed, and the note on the map warns that classification variation may be included.
Among the named change categories, 5.30% is classified as a shift to developed cover. Red change patches are common through the central and northern part of the county, with smaller groups elsewhere. Comparing those red areas with the 2025 developed map is a practical way to identify places that deserve a closer historical look.
Forest loss is listed at 2.25%. The corresponding color appears in scattered patches, including areas around the large southern forest zone and parts of the developed interior. The map does not establish whether those differences resulted from construction, timber activity, storm effects, vegetation change, or classification differences.
Agricultural loss is 2.13%. Small yellow change areas occur around some of the northern and southeastern agricultural blocks. Because annual crops and pasture can look different from year to year, a two-date classification comparison should be treated as a screening tool rather than a complete agricultural history.
Other class difference is the largest named group at 9.87%. Purple pixels are widely scattered, especially across the eastern and central portions. That broad category is a reminder that not every changed cell belongs to a simple story of urban growth or forest removal; multiple transitions and classification effects are grouped together.
Water context: springs, Gulf wetlands, and inland lake systems
Citrus County is well known for spring-fed rivers on its Gulf side. Southwest Florida Water Management District describes the Homosassa River as a short tidal river beginning at a first-magnitude spring system in western Citrus County and flowing about eight miles to the Gulf. Regional planning documents also identify Crystal River and Chassahowitzka among the county’s spring-fed river systems.
Those official descriptions help explain why the western edge cannot be reduced to one color. Open water, marsh and other wetland cover, wooded areas, and developed places occur close together. The land-cover map captures the broad surface pattern, but it does not provide spring discharge, salinity, water quality, or tidal measurements.
Inland water is important as well. Regional water-planning material describes the Tsala-Apopka Chain of Lakes as an interconnected system of lakes, ponds, marshes, and open-water pools with major areas around Floral City, Inverness, and Hernando. That context is useful when interpreting the eastern and central blue-and-teal areas.
For environmental education, this combination creates a good comparison between coastal and inland wet areas. Students can locate broad wetland zones on the land-cover map, then consult official hydrology resources to learn that similar map colors may occur in different water settings. The classification is a starting point, not a replacement for hydrologic mapping.
A practical sequence for using all four maps
If you need one overview image, begin with the 2025 land-cover map. It is the clearest way to place the 31.27% wetland share beside 28.05% developed cover and 19.66% forest. The map also shows why the county cannot be summarized by a single east-west gradient.
For a forest, agriculture, or habitat lesson, switch to the forest-and-farmland view. It reduces the distraction of developed classes and makes the large southern forest, northern agricultural patches, wetlands, and water easier to compare. Official information about Withlacoochee State Forest can then add local context.
For development intensity, use the impervious map. The 6.78% mean and 1.68% share at 50% impervious or higher become more meaningful when the darker concentrations are located on the map. It also helps explain why a broad developed class does not equal continuous pavement.
For historical screening, use the 1985–2025 comparison last. Start with the 5.30% shift to developed and the 9.87% other-difference category, then check the same locations on the current map. This sequence keeps the change layer from being mistaken for a complete explanation of why a place changed.
All four maps use the same county boundary, which makes side-by-side comparison straightforward. A classroom, planning presentation, or research note can keep the map extent fixed while changing the question from current cover to natural land, hard surfaces, or long-term class difference.
Resolution, classification, and other limits to keep in mind
Annual NLCD is a raster dataset, meaning the landscape is divided into grid cells and each cell is assigned a class or value. A real location may contain trees, grass, pavement, water, and buildings within a small area, yet the map must summarize that mixture. Small shoreline features and narrow roads therefore may not line up perfectly with what a detailed aerial image shows.
The maps represent the supplied 2025 classification. New construction, vegetation change, restoration, storms, or agricultural changes after that observation period may not appear. The change map compares 1985 and 2025 endpoints, so it does not show every temporary transition that may have happened between those years.
This scale is well suited to countywide patterns, education, presentations, and broad environmental comparisons. It is not a parcel survey. Property boundaries, zoning districts, legal wetlands, flood zones, conservation easements, and building permissions require the appropriate current county, state, or federal source.
Classification colors should also be interpreted as categories rather than exact ecological descriptions. A wetland class does not identify every wetland type, and forest does not tell you the tree species or management status. The official park, forest, and water-management sources linked below provide more specific local information where needed.
Using the maps in print, lessons, and county comparisons
For a printed handout, the full land-cover map works well as the first page because its legend and county summary provide immediate orientation. A second page can use the forest-and-farmland map to explain why the southern interior looks different from the developed center and wet western edge.
An urban or infrastructure lesson can pair developed cover at 28.05% with mean imperviousness at 6.78%. The difference between those numbers opens a useful discussion about low-density development, lawns, trees, and open areas inside developed classes. The map then shows where harder surfaces are concentrated instead of leaving the comparison as an abstract percentage.
A long-term change exercise can ask readers to locate the 5.30% mapped shift to developed and compare it with current developed areas. The next step should be to distinguish those red cells from the much larger 9.87% other-difference category. That approach encourages careful interpretation instead of assuming that every colored change pixel means urban expansion.
When comparing Citrus County with another Florida county, keep the data year and classification system consistent. The most useful Citrus benchmarks from these supplied maps are 31.27% wetlands, 28.05% developed cover, 19.66% forest, 10.66% agriculture, 7.43% water, and 6.78% mean imperviousness.
Use the original JPG files from the download box for printing rather than enlarging a browser preview. Each original includes the title, legend, and county summary. Enlarging the image does not create parcel-level detail, so the best use remains county-scale interpretation and comparison.
Frequently Asked Questions
What is the largest land-cover class in Citrus County in 2025?
Wetlands are the largest class at 31.27%. Developed cover follows closely at 28.05%, with forest at 19.66%, agriculture at 10.66%, and water at 7.43%. The wetland share is spread across several parts of the county rather than appearing only along the Gulf shoreline.
Which map is best for comparing Crystal River or Homosassa with the inland county?
Use the full land-cover map first because it places water, wetlands, development, forest, and agriculture on one frame. The impervious map is better when the question is specifically about hard-surface concentration. For exact river, spring, preserve, or management boundaries, consult the official local resources linked in the sources section.
Does the 20.40% class difference mean one-fifth of the county was physically transformed?
No. It means 20.40% of mapped cells received a different class in the 1985 and 2025 comparison. Real land change is part of that result, but classification variation can also contribute. The change layer is best used to identify locations for follow-up rather than as a complete record of physical change.
Map File Information
The four original JPG maps used in this Citrus County article are packaged together in one ZIP file.
- Included Files: Use only the versions confirmed in the article and supplied images
- File Type: Use the confirmed download contents
- Intended Use: Printing, education, presentations, and map-based projects
Related Maps
- Alachua County Florida Land Cover Map
- Baker County Florida Land Cover Map
- Bay County Florida Land Cover Map
Sources and References
- MRLC Annual NLCD Data – Annual NLCD land-cover data used for current and long-term comparison
- USGS Annual NLCD Land Cover Classification – definitions and descriptions of land-cover classes
- U.S. Census Bureau TIGER/Line Shapefiles – county boundary source
- Crystal River Preserve State Park – official information on the Gulf-side estuary, wetlands, and natural communities
- Withlacoochee State Forest – official forest information for tracts extending into Citrus County
- Homosassa Springs, Citrus County – official information on the Homosassa spring and river system
Green Map creates custom-edited map images using open geographic data sources such as geoBoundaries, Natural Earth, OpenStreetMap, and government open data.
These maps are edited visual materials, not raw data files, and are provided for education, documents, presentations, and graphic reference.