Minidoka County is easiest to understand by starting at its southern edge. Rupert, Heyburn, and Paul sit close to the Snake River and the county’s busiest road network, while the boundary stretches far north into higher, much less settled ground. This Minidoka County Map page brings those contrasts together with separate views of county boundaries and roads, the ranked city distribution, waterways and irrigation channels, and elevation. High-resolution JPG versions of all four maps are available in the download box below.
The four views are meant to answer different practical questions without turning the page into a technical GIS report. The general county map is the best starting point for roads, nearby counties, and the outline of Minidoka County. The city map makes the southern concentration of places immediately visible. The water map shows the Snake River along with a dense network of canals and drains, and the elevation map explains why the county changes so clearly from low southern ground to higher terrain in the north.
Table of Contents
A long county that begins with the Snake River lowlands
The county outline has a distinctive shape. Its southern portion spreads west and east around the Rupert–Heyburn area, then narrows and steps inward before extending a long distance north. That shape matters when reading the map because most labeled settlements and major highways occupy the lower part of the county. The northern section is much larger on the page but carries far fewer city and road labels.
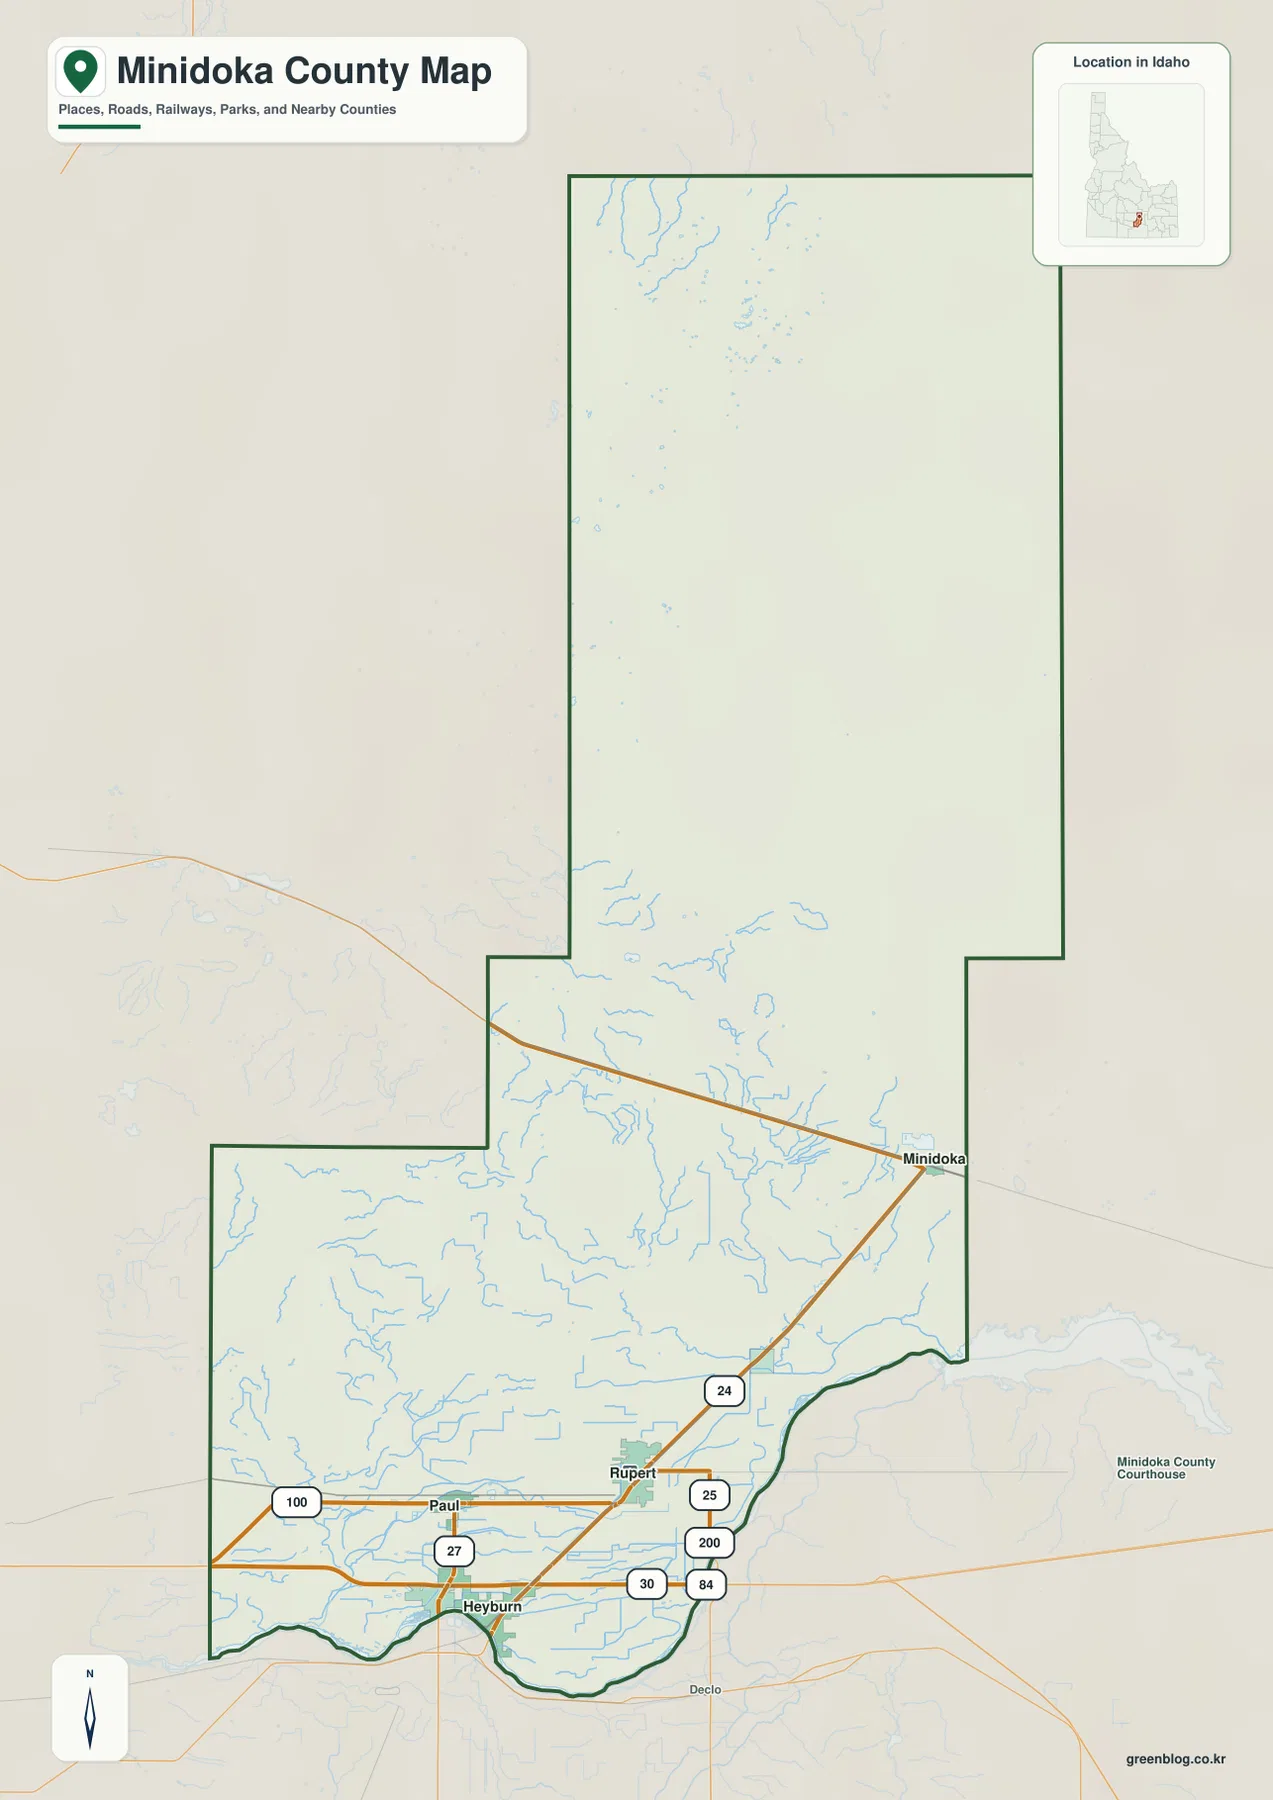
Rupert is the clearest road reference point on the general map. I-84 and US 30 cross the southern area, while Idaho routes including 24, 25, and 27 connect the nearby towns and continue toward other parts of the county. The road pattern is dense around Rupert, Heyburn, and Paul, then thins as the map moves north. That is a more useful way to read the county than simply listing highway numbers: the southern corridor is where the mapped transportation network and settlements overlap most strongly.
Labels outside the boundary identify neighboring counties such as Blaine, Twin Falls, Lincoln, Cassia, and Jerome. They help place Minidoka County within south-central Idaho without implying that this is a parcel or survey map. Anyone who needs exact legal boundary coordinates should use an official source such as Census TIGER/Line rather than measuring from this presentation map.
Rupert, Heyburn, and Paul form a compact southern cluster
The ranked city map shows five places: Rupert, Heyburn, Paul, Minidoka, and Acequia. Their arrangement is more important than the ranking itself. Rupert, Heyburn, and Paul sit close together near the southern edge, while Minidoka and Acequia extend the settled pattern eastward and northeastward. None of the five indexed cities appears in the long northern section, so the contrast between the populated south and the open north is visible before any other data are added.
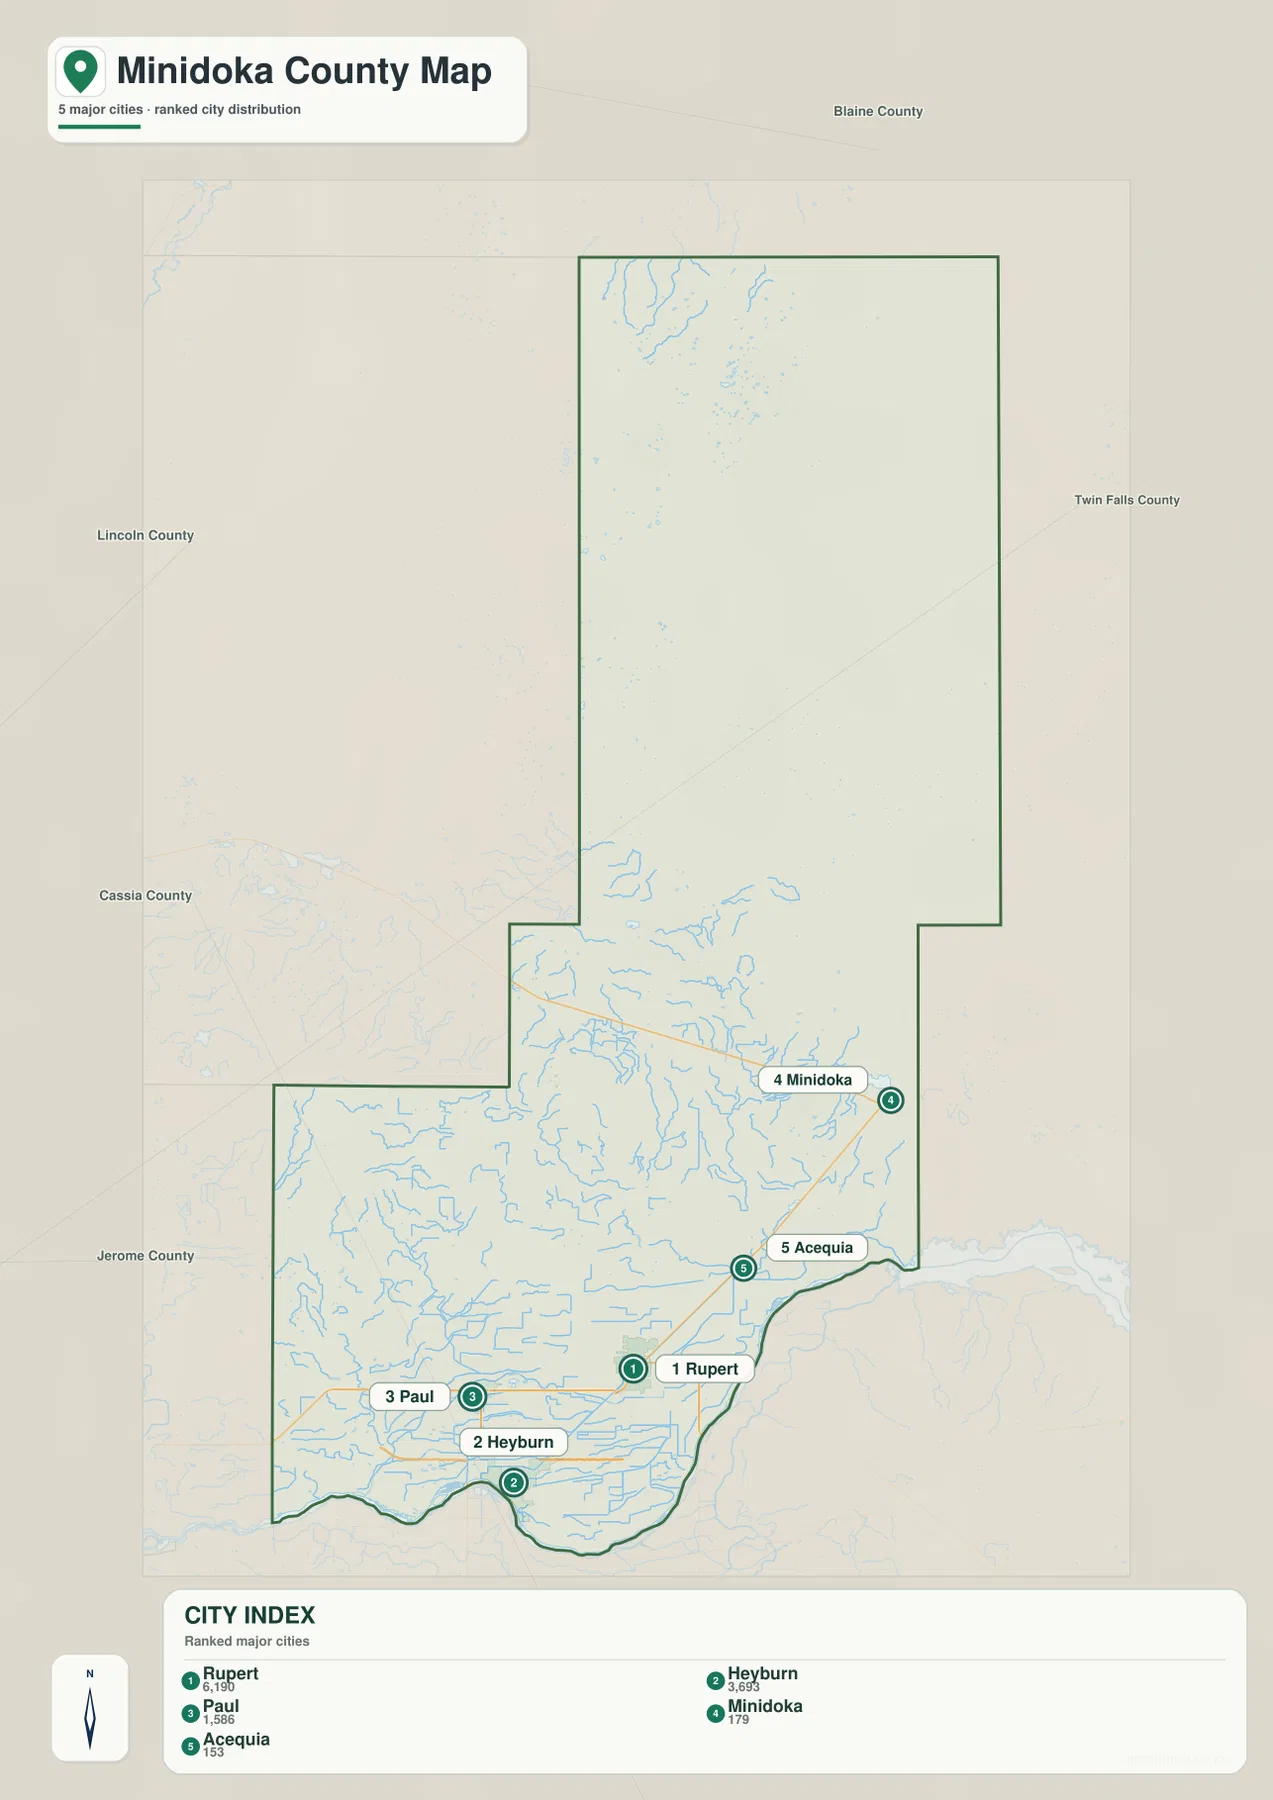
The city index on the map places Rupert first, followed by Heyburn, Paul, Minidoka, and Acequia. The listed numbers are best treated as the values used for this map’s ranking rather than as a substitute for a current population table. For map reading, the useful point is that the three largest marked places occupy a relatively small southern area. Minidoka and Acequia remain within the same broad road-and-river side of the county rather than breaking the pattern with a distant northern center.
Roads reinforce the same geography. I-84 and US 30 give the south an obvious east–west framework, and the state routes tie Rupert and nearby communities into it. This makes the city map helpful for orientation even when a visitor is not interested in population ranking. A quick comparison with the boundary map shows where the settled corridor ends and where the county continues north beyond the main urban labels.
Snake River, canals, and drains dominate the southern water map
The water map changes the emphasis from roads to a much finer network of blue lines. The Snake River follows the southern edge, while canals and drains spread through the lowland north of the river. Labels include A Canal, B Canal, C Canal, Main North Side Canal, and several Main Drain routes. Their concentration around the southern and central-southern parts of the county makes the water network one of the strongest visual signatures on any of the four maps.
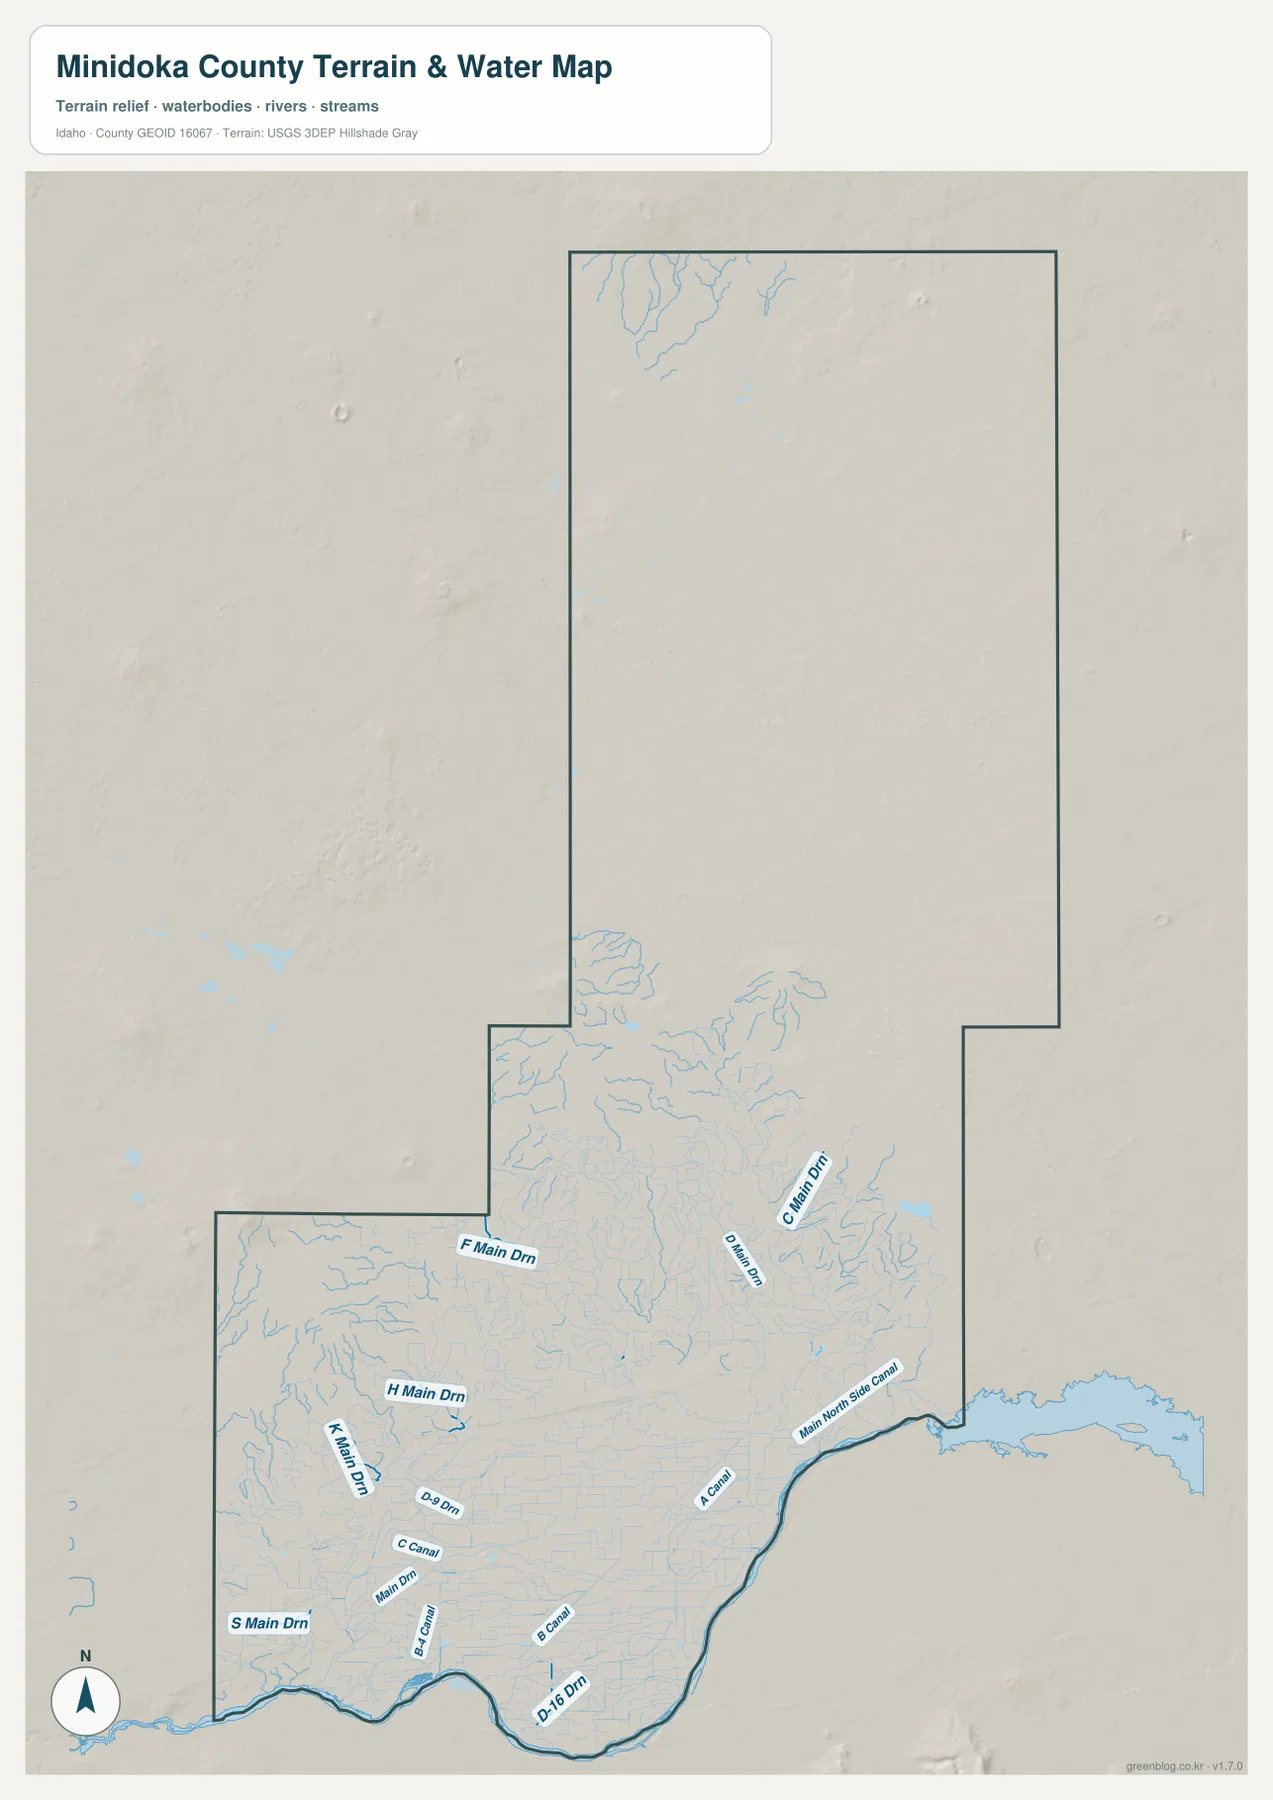
Farther north, the map becomes much less crowded. Small streams are present, but the regular canal-and-drain network that fills the south is not repeated across the long northern block. This is useful when comparing the county’s physical setting: the low southern plain has an intricate managed-water system, while the higher north shows a sparser set of natural drainage lines.
This water map is a location reference, not a flood-risk, water-rights, navigation, or engineering product. A blue line does not mean that every feature is a natural stream; many labeled features are canals or drains. For official hydrography, feature names, or updated water data, USGS National Hydrography should be consulted directly.
Elevation rises from about 1,260 meters to 1,552 meters
The elevation map makes the north–south contrast even clearer. Its printed statistics show an actual elevation range of roughly 1,260 to 1,552 meters, with a mean near 1,334 meters. The lowest colors occupy the southern part of the county near the Snake River. Green gives way to lighter green and yellow farther north, and the highest brown tones appear across the northern and northeastern high ground.
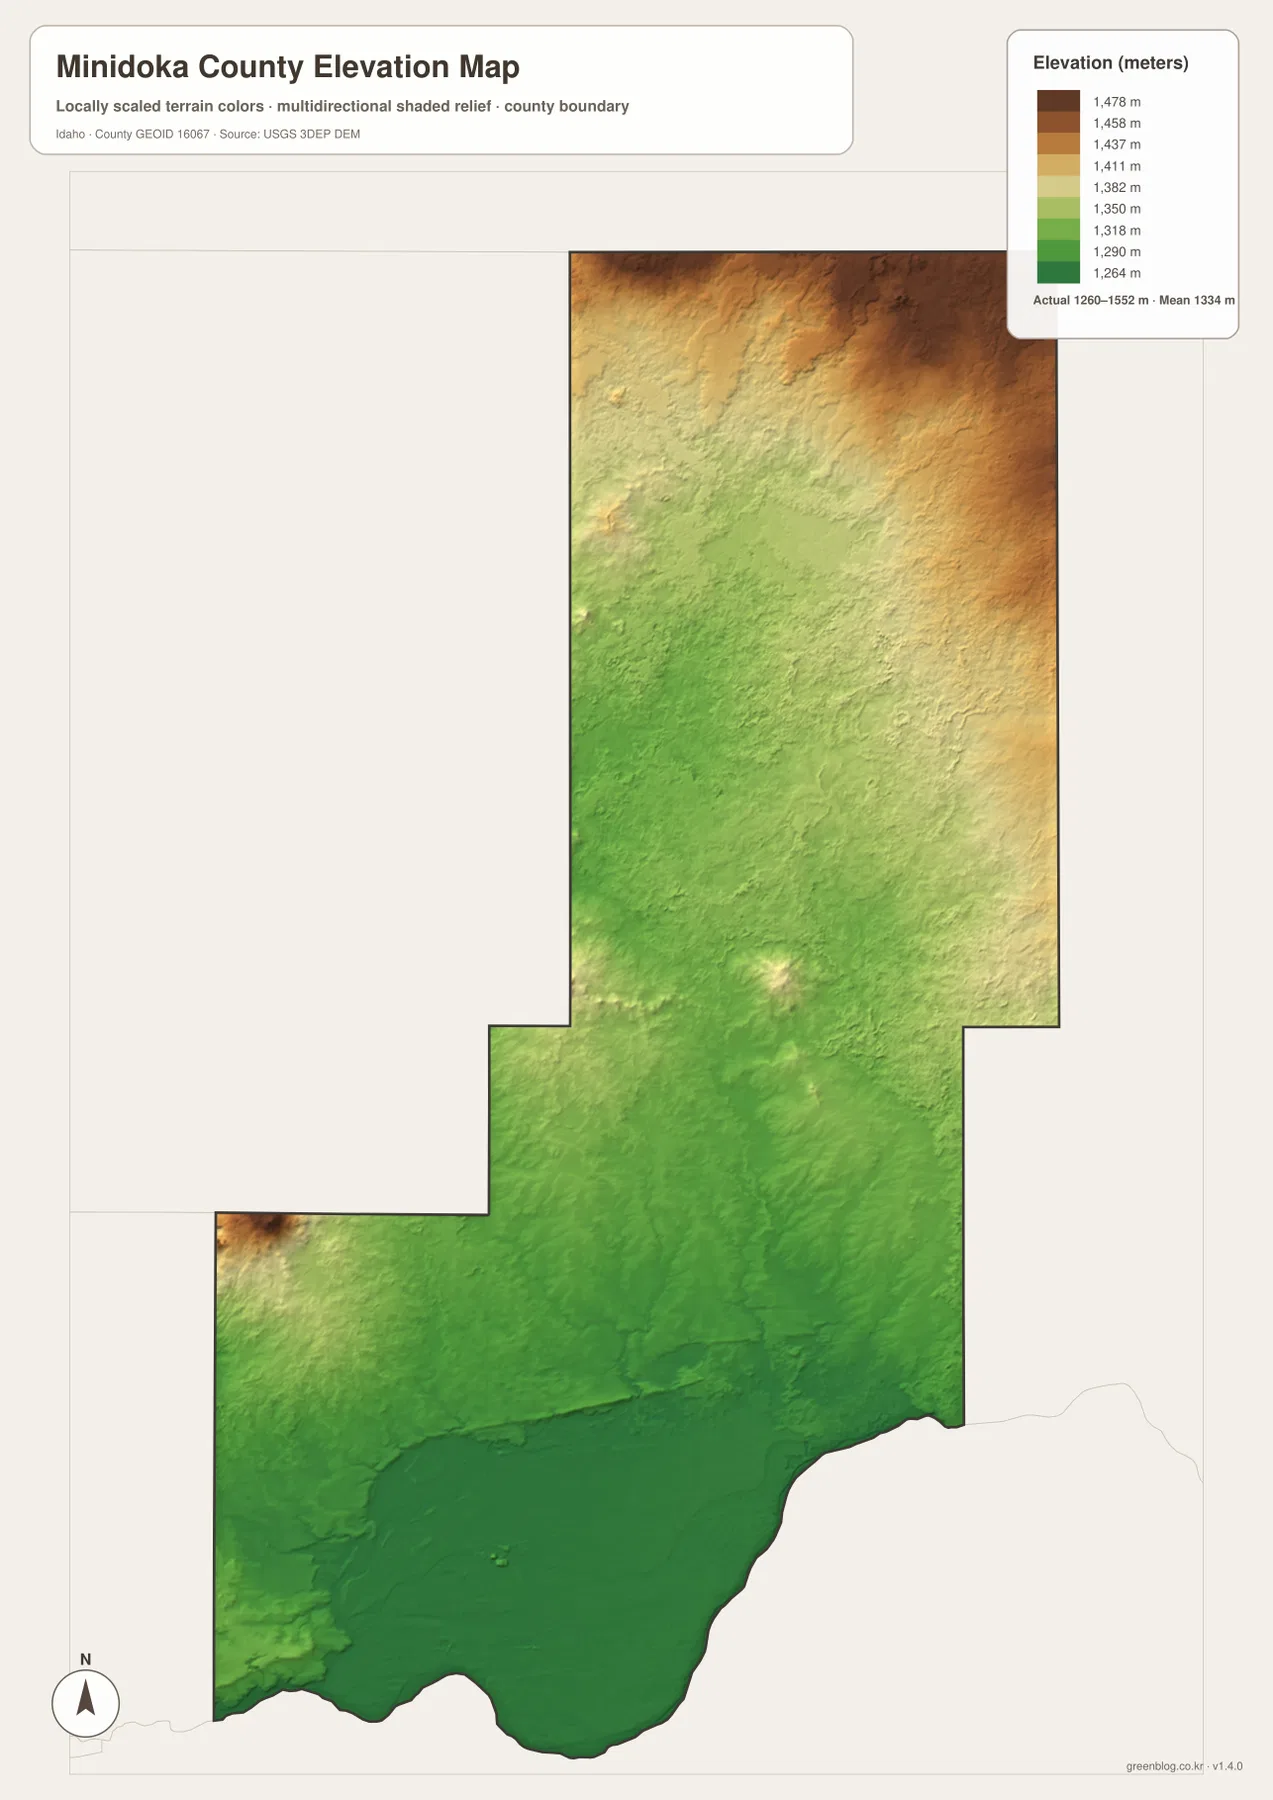
The map also helps explain why the other views feel so different from south to north. Rupert, Heyburn, and Paul lie within the broad lower-colored area, where the road network and irrigation features are densest. The long northern extension rises gradually and contains fewer indexed cities. A small higher patch also appears near the western edge, but the dominant county-wide pattern is still a rise from the Snake River side toward the north.
These elevation colors are generalized for county-scale comparison. They should not be used as survey-grade measurements for a building lot, road project, drainage design, or engineering decision. The USGS 3D Elevation Program is the appropriate starting point when more detailed elevation data are required.
Choosing the map that answers your question fastest
For a first look at Minidoka County, start with the boundary-and-road map because it combines the county outline, major routes, towns, and surrounding counties. Switch to the city map when the question is specifically about where Rupert, Heyburn, Paul, Minidoka, and Acequia sit relative to one another. The water and elevation maps add the physical context that the road view cannot show: one reveals the dense canal-and-drain system of the south, while the other shows how strongly the terrain rises toward the north.
- County orientation: use the general map for the county shape, nearby counties, I-84, US 30, state highways, and settlement locations.
- Settlement comparison: use the city map to see the tight Rupert–Heyburn–Paul cluster and the eastward positions of Minidoka and Acequia.
- Water features: use the terrain-and-water map for the Snake River, Main North Side Canal, named canals, and the many drainage channels across the southern plain.
- Terrain height: use the elevation map to compare the low southern section with the northern uplands across the approximately 1,260–1,552 m range shown on the map.
The WebP maps in the article are convenient for on-screen reading, while the downloadable archive contains the corresponding high-resolution JPG files. If the map will be printed, placed in a lesson, or used in a larger regional comparison, the JPG set is the better choice because it preserves more detail than the page preview.
Frequently Asked Questions
Why are the five indexed cities concentrated in the southern part of the county?
The supplied city map places Rupert, Heyburn, Paul, Minidoka, and Acequia in the southern half, close to the county’s main road network and the Snake River side of the county. The maps alone do not prove every historical or economic reason for that pattern, but they clearly show that the principal mapped settlements, highways, and managed-water network overlap in the lower southern area.
Are all of the blue lines on the water map natural streams?
No. The map includes the Snake River and smaller natural drainage features, but it also labels canals and drains such as A Canal, B Canal, C Canal, Main North Side Canal, and several Main Drain routes. Those features should not be treated as one single type of waterway.
What does the elevation map show most clearly?
It shows the broad rise from the low Snake River side of the county toward higher northern ground. The map lists an actual range of about 1,260 to 1,552 meters and a mean near 1,334 meters. Those colors are designed for county-scale comparison rather than precise site surveying.
Map File Information
The download includes the Minidoka County general map, city map, terrain-and-water map, and elevation map as original high-resolution JPG files.
- Included Files: Use only the versions confirmed in the article and supplied images
- File Type: Use the confirmed download contents
- Intended Use: Printing, education, presentations, and map-based projects
Related Maps
Sources and references
- Minidoka County official website – county government and local information
- U.S. Census Bureau TIGER/Line Shapefiles – county boundary and geographic reference data
- USGS National Hydrography – streams, rivers, and hydrographic reference data
- USGS 3D Elevation Program – elevation and terrain source data
Green Map creates custom-edited map images using open geographic data sources such as geoBoundaries, Natural Earth, OpenStreetMap, and government open data.
These maps are edited visual materials, not raw data files, and are provided for education, documents, presentations, and graphic reference.