Pope County shows a clear north-to-south land-cover contrast. Forest covers 63.35% of the county in the 2025 summary and forms a broad, nearly continuous block across the north. Farther south, the Arkansas River Valley contains much more agriculture, water, and developed land, with the strongest built-surface concentration around Russellville. The four maps on this page make those differences easier to separate than a single general map can.
You can compare 2025 land cover, forest and farmland, impervious surface, and mapped class differences from 1985 to 2025. The images in the article are web previews, while the four original JPG maps are available together in one download below. That makes the set useful both for a quick county overview and for closer comparison of Russellville, the southern river corridor, and the forested northern half.
Table of Contents
Why the southern river valley looks so different from the northern half
The 2025 map is not evenly mixed. The northern half is dominated by dark green forest, with only scattered openings and thin developed traces. Moving south, the pattern becomes increasingly patchy as agricultural land, developed cells, grassland, water, and remaining forest meet in the same part of the county. Along the southern edge, blue water occupies a much more visible role than it does in the interior. This shift is the main organizing feature of the Pope County map set.
Pope County’s official website describes the county as part of the Arkansas River Valley between Little Rock and Fort Smith. It states that the Arkansas River forms the southern boundary and that the Ozark National Forest is included along the north. That local description provides useful context for the map without turning land-cover colors into ownership boundaries. A green forest cell only describes the surface cover classified by the dataset; it does not say whether the land is federally owned, privately owned, or subject to a particular zoning rule.
The general land-cover map puts 63.35% forest beside 22.24% agriculture
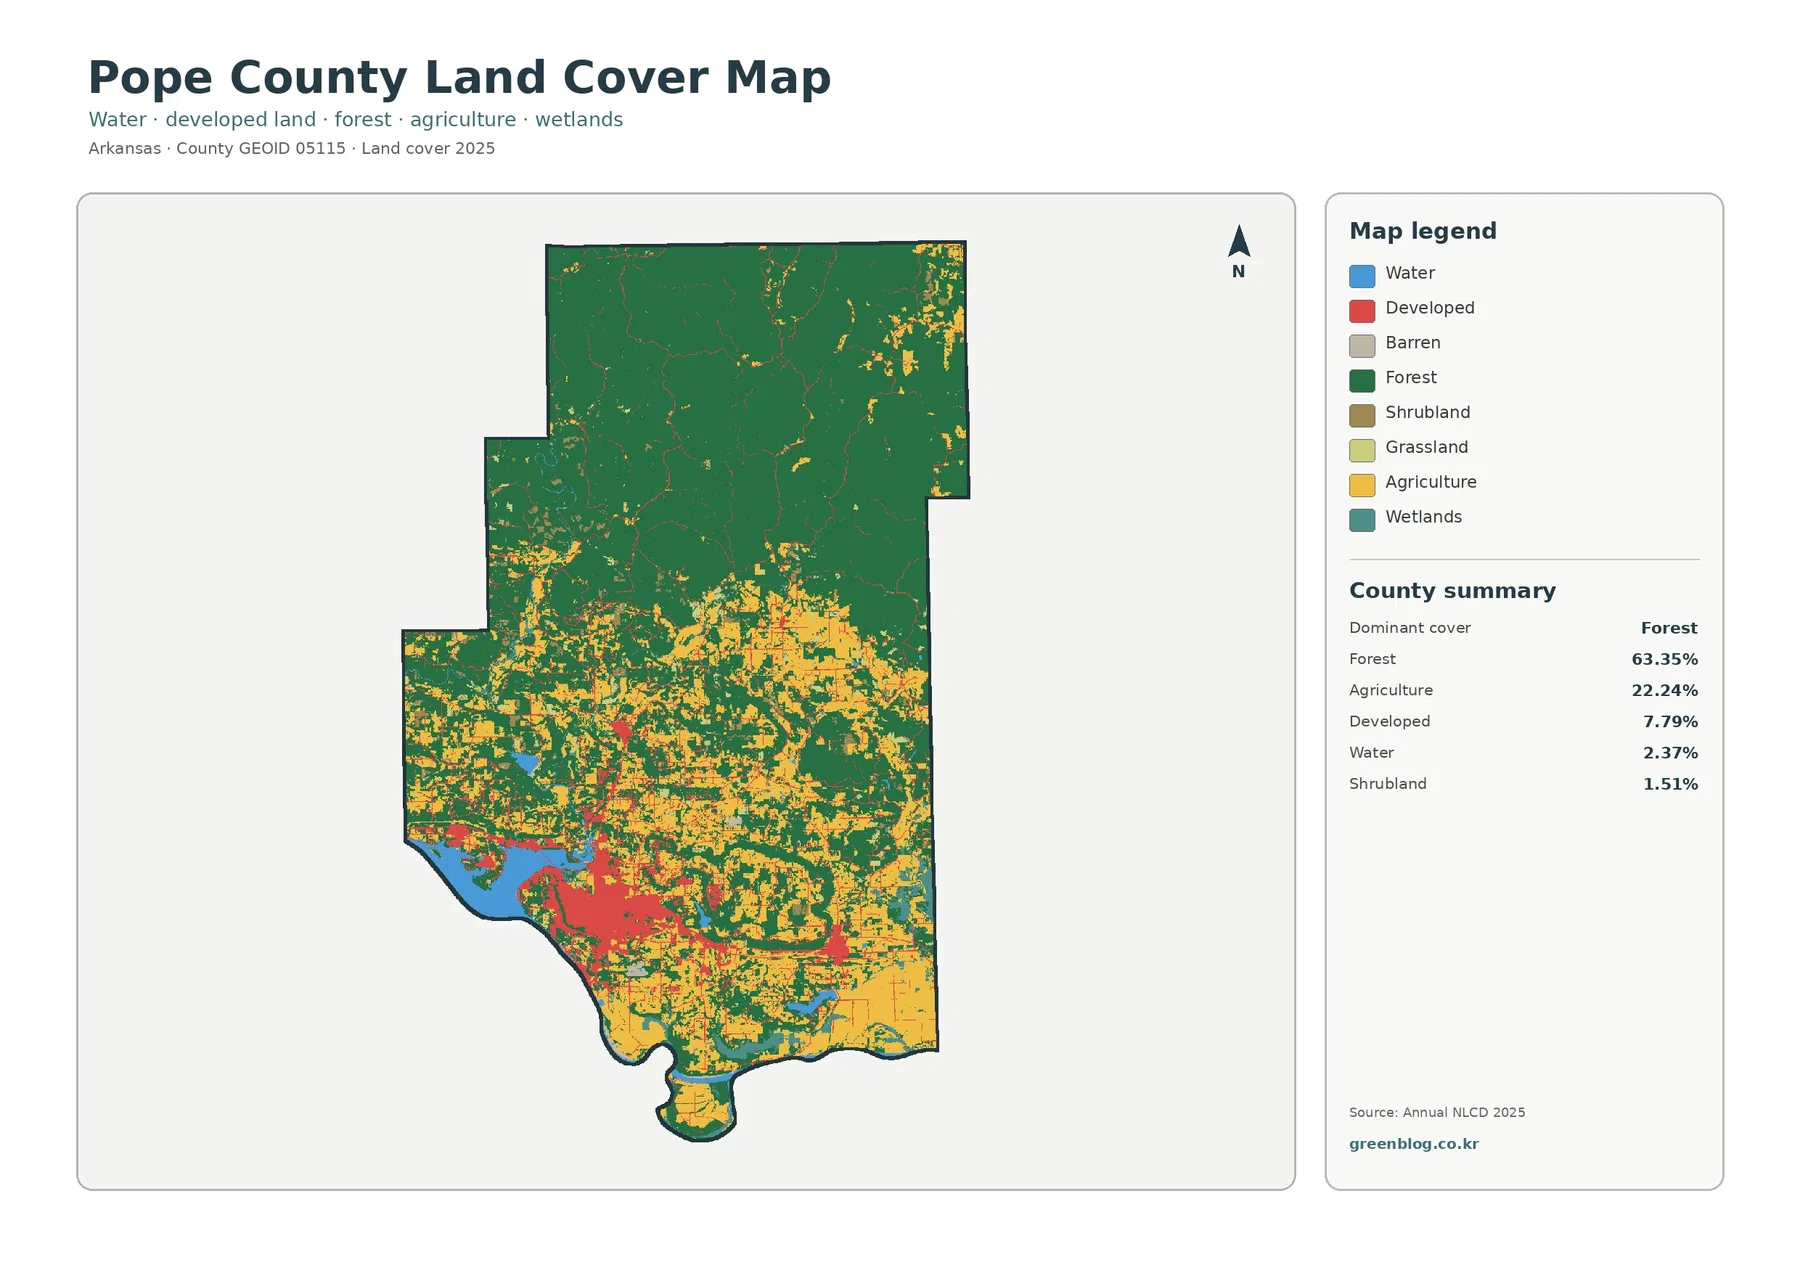
The county summary lists forest at 63.35%, agriculture at 22.24%, developed land at 7.79%, water at 2.37%, and shrubland at 1.51%. The forest-and-farmland view also reports 1.18% grassland and 1.34% wetlands. Those numbers explain the overall balance, but the map adds the information that percentages cannot provide: the classes occupy very different parts of the county. Forest is broad and connected in the north, while agriculture and developed land are heavily weighted toward the southern valley.
Russellville stands out when the map measures hard surfaces instead of broad developed cover
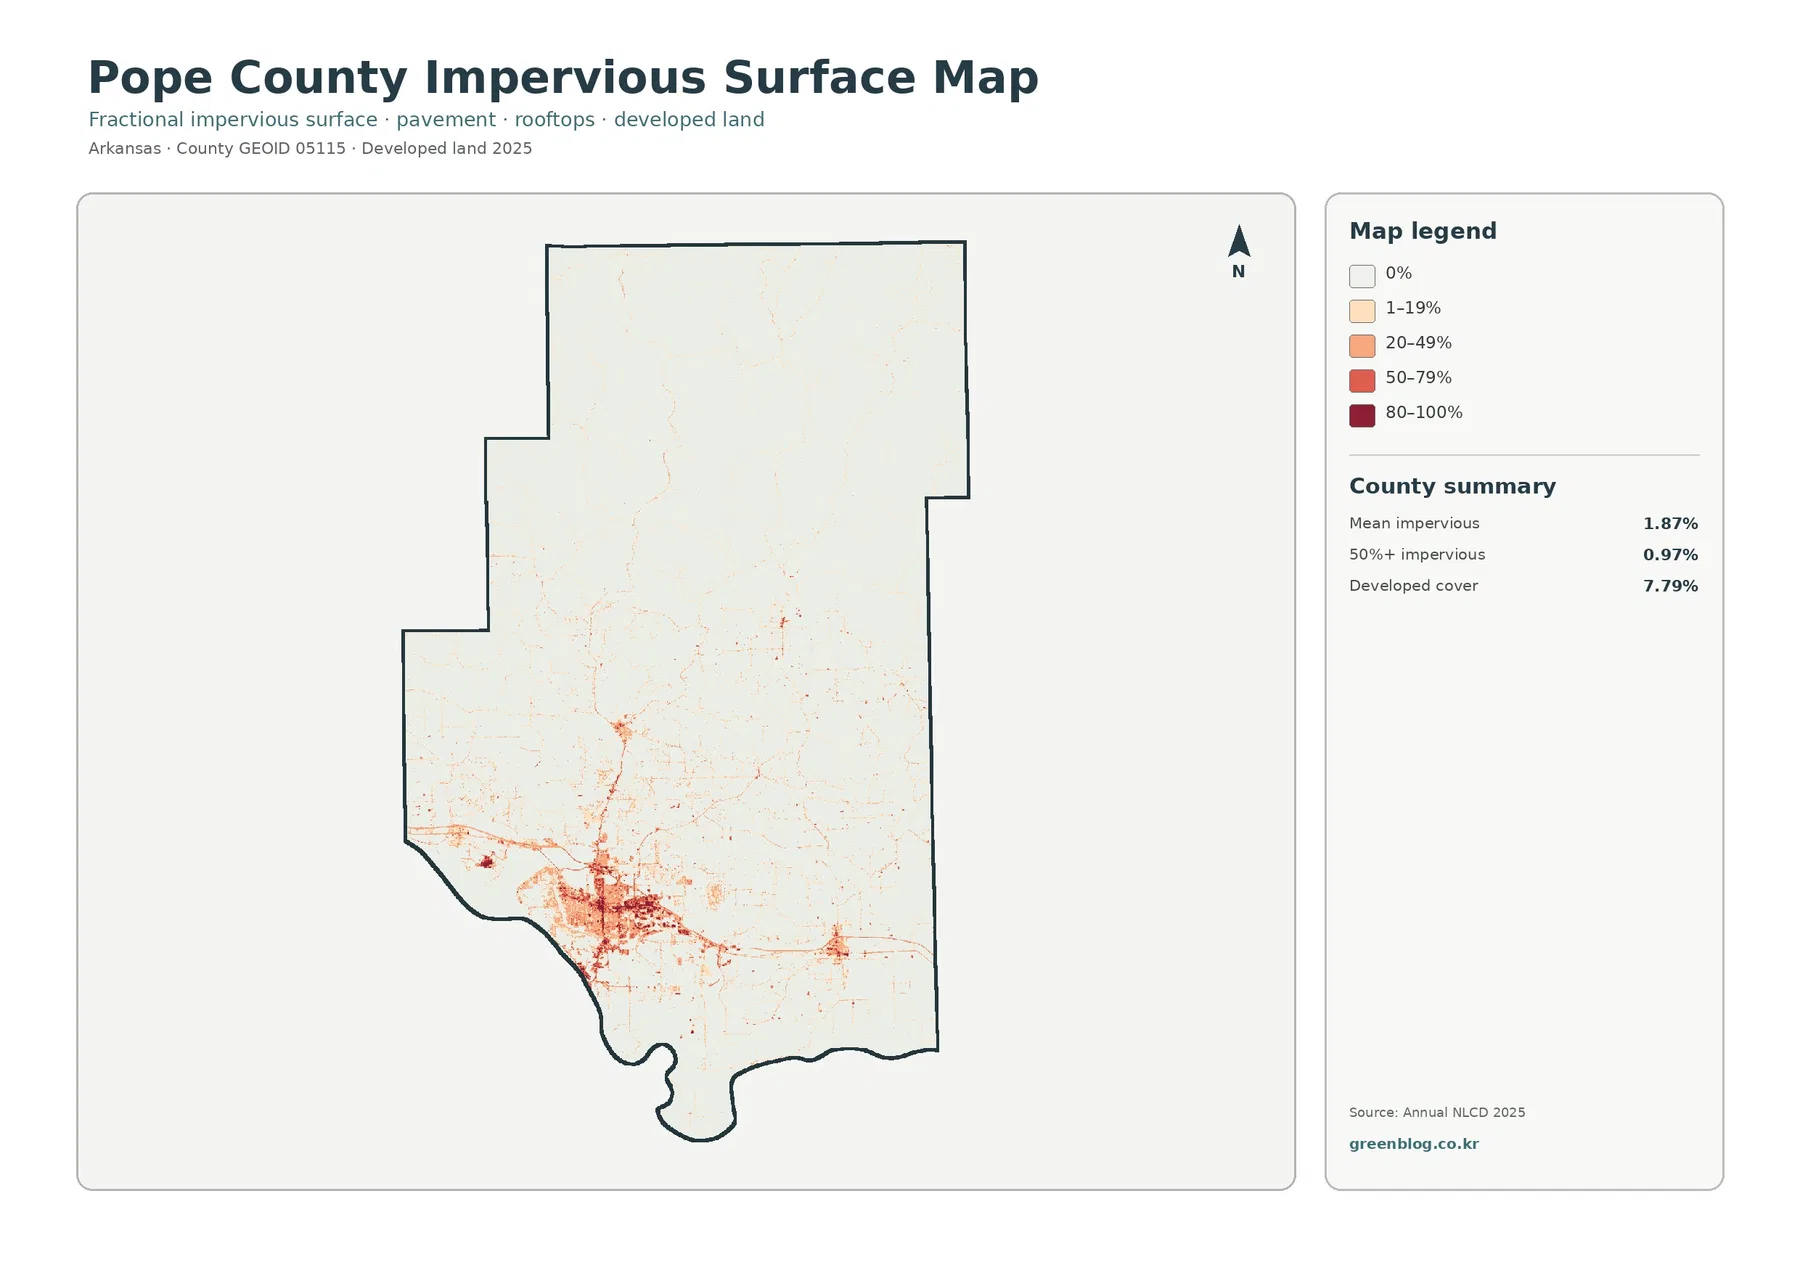
Impervious surface means pavement, rooftops, parking areas, and other hard surfaces that do not readily absorb rainfall. Pope County has a mean impervious value of 1.87%, and 0.97% of the mapped area is at least 50% impervious. Those values are much lower than the 7.79% developed-cover figure because the measures are not equivalent. A developed NLCD cell can contain substantial lawn, soil, or tree cover and therefore have a relatively low percentage of actual hard surface.
The map makes the county’s settlement pattern easy to see. The darkest and most extensive cluster surrounds Russellville in the south-central portion of the county. Smaller red and orange marks extend along roads and through other communities in the southern half, while most of the forested north remains nearly blank. In other words, the developed category is not spread uniformly across Pope County. Its most hardened surfaces are concentrated in a comparatively small portion of the county.
Forest and farmland become easier to separate once the developed colors are simplified
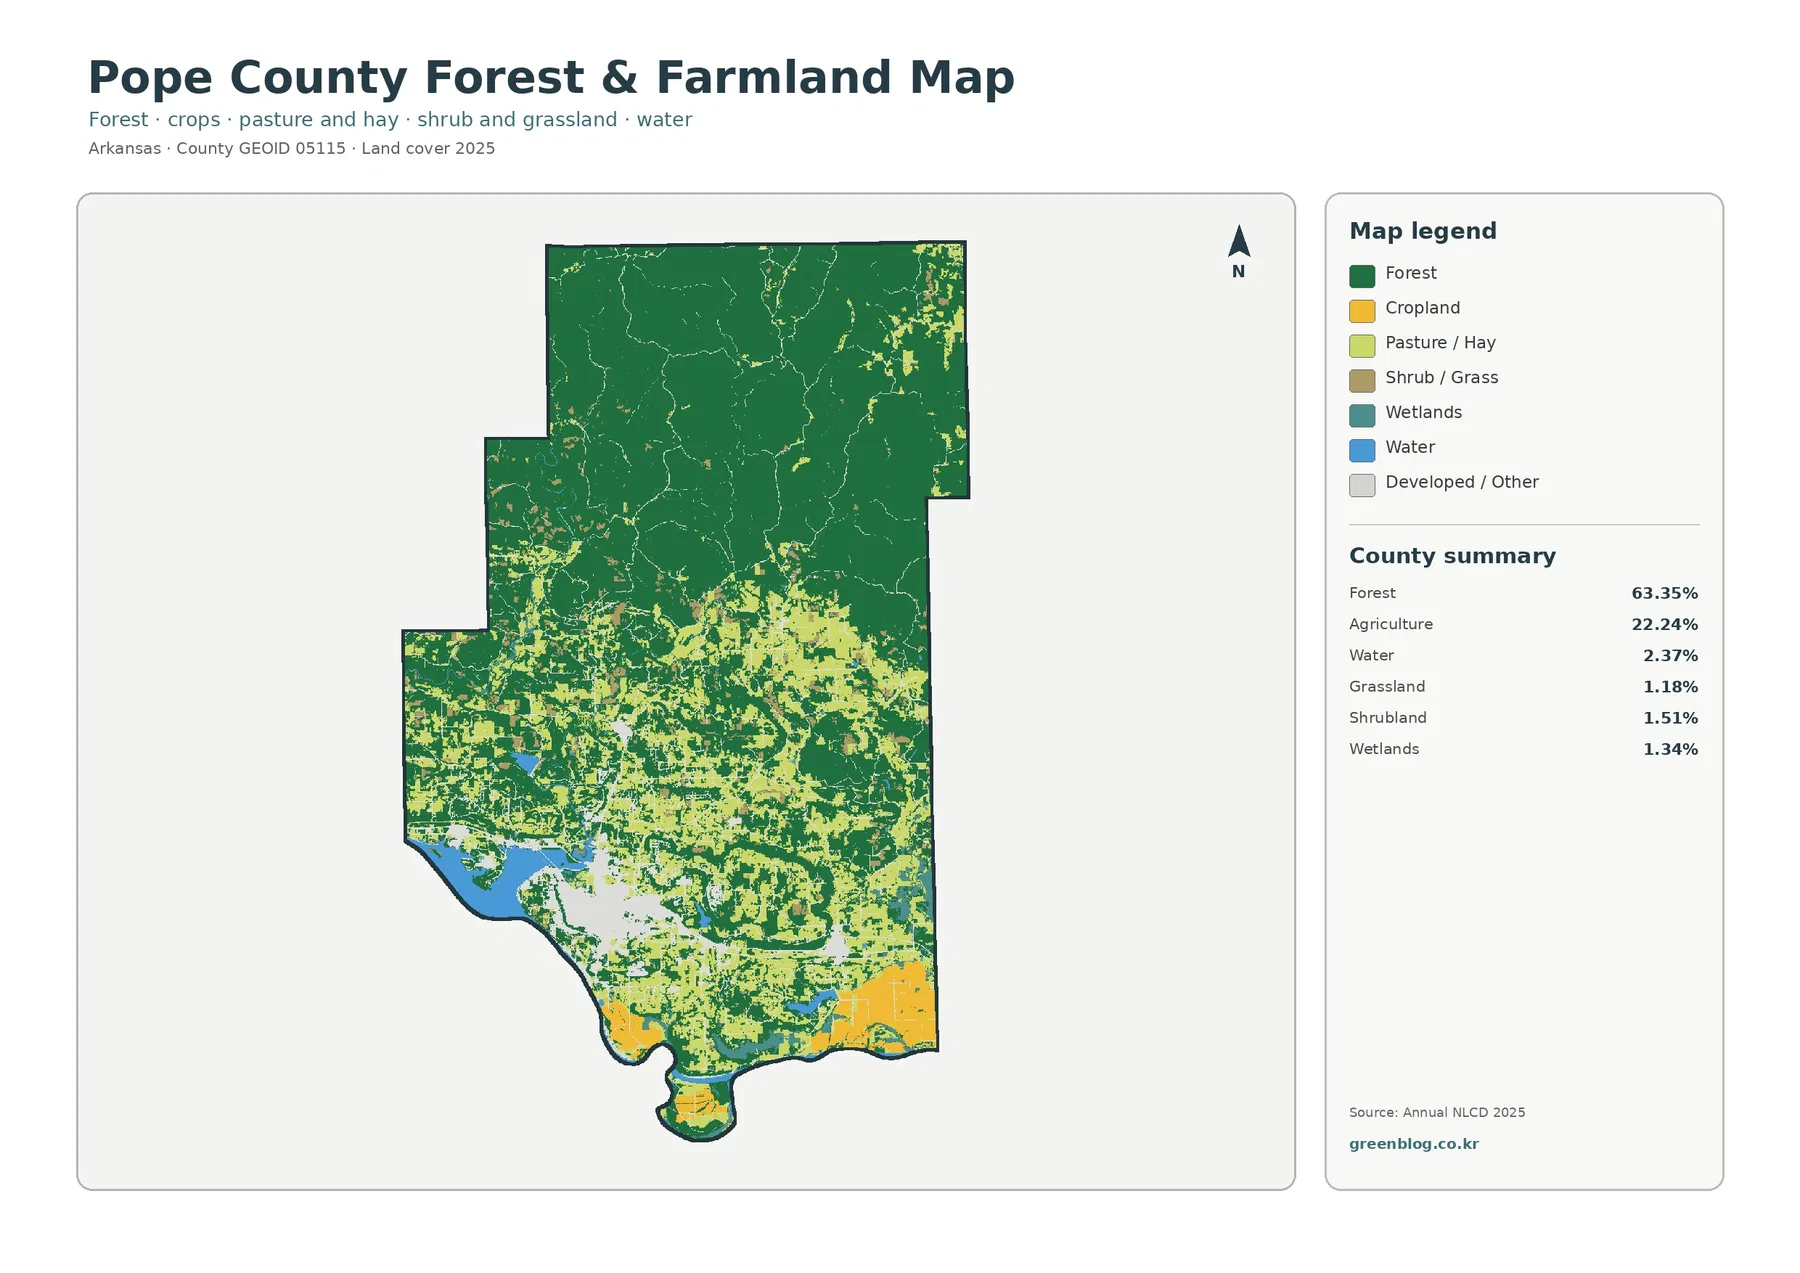
The forest-and-farmland map is useful because it removes some of the visual competition found in the general map. Dark green remains nearly continuous across the northern tier. In the central and southern parts of the county, lighter agricultural and open-land colors become much more frequent, especially around the river valley. Rather than one single farm belt, the map shows broad open areas mixed with forest remnants, developed places, and water.
Agriculture accounts for 22.24% of the county, but most of that share is not located in the heavily forested north. The official county description refers to the fertile river valley that runs parallel to the Arkansas River, and the map shows the strongest agricultural presence in that same southern part of Pope County. This is a useful example of why spatial distribution matters: a county can be almost two-thirds forest overall while still having extensive agricultural landscapes concentrated in one major geographic zone.
Mapped change from 1985 to 2025 is widespread, but most of it is not a simple development story
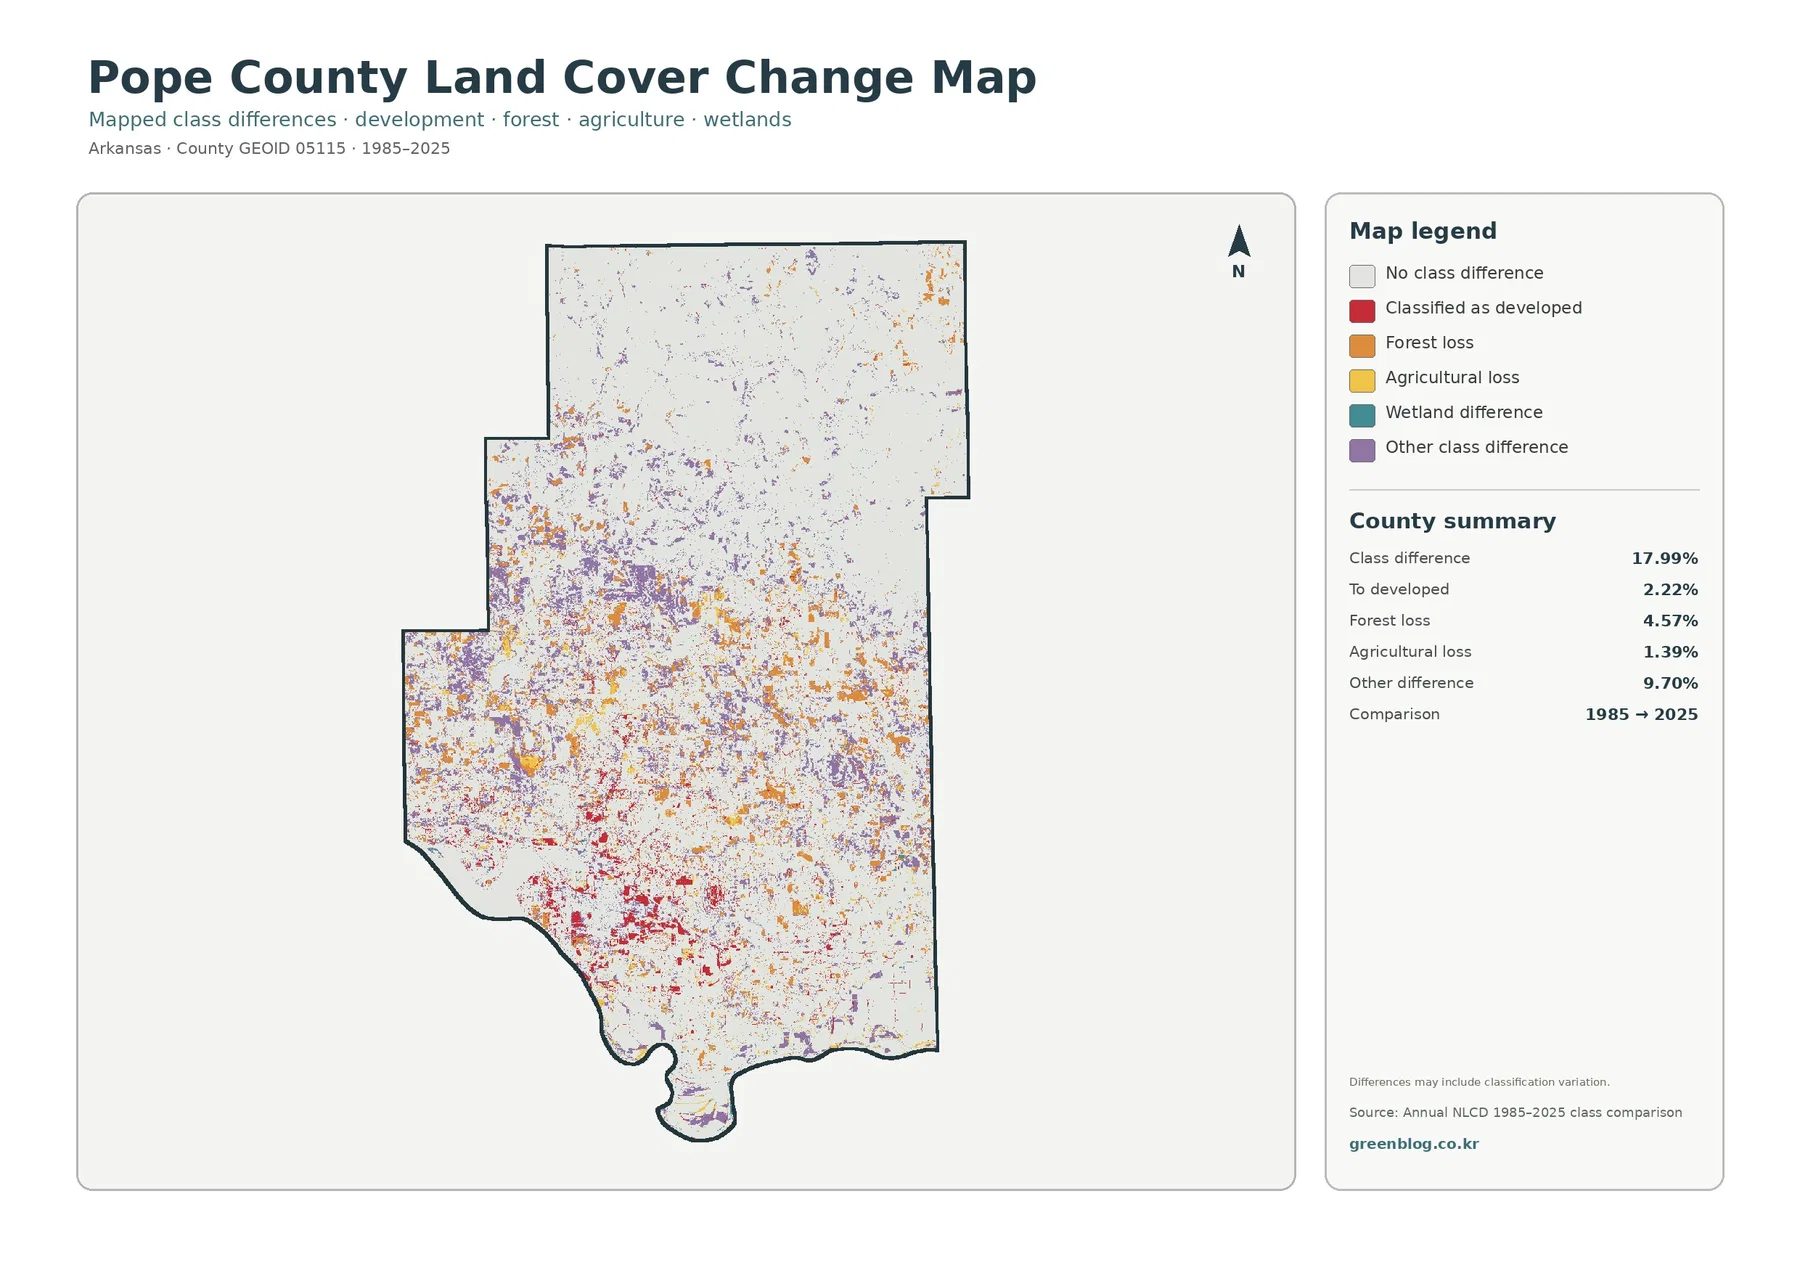
The change map compares the classification assigned to each mapped cell in 1985 with the classification assigned in 2025. Pope County has a total class difference of 17.99%. Within that summary, 2.22% is shown as changing to developed, 4.57% as forest loss, 1.39% as agricultural loss, and 9.70% as other class difference. Large white areas still remain, indicating locations where the two endpoint classifications do not show a mapped class difference.
Red change-to-developed cells are most noticeable in the southern portion of the county, particularly around the Russellville area and other developed corridors. Forest-loss colors and purple other-difference cells are more dispersed, appearing along many forest edges and through parts of the central and southern landscape. Smaller differences also appear in the northern half. That distribution matters because it prevents the map from being reduced to a single claim such as “all change is urban expansion.”
Choosing the right map depends on whether the question is about forests, farms, pavement, or change
For a first overview, the general land-cover map is the most efficient starting point because it shows forest, agriculture, developed land, water, wetlands, and other classes together. If the goal is to compare the Ozark-forest side of the county with the open Arkansas River Valley, the forest-and-farmland view is easier to read. It strips away some detail while preserving the broad division between wooded and open surfaces.
A 30-meter classification is excellent for county patterns but not for parcel boundaries
Annual NLCD land-cover products are commonly represented with 30-meter raster cells. A single cell near a forest edge or neighborhood can contain trees, pavement, a house, grass, and bare soil at the same time, yet the land-cover product must assign a class according to its mapping method. In southern Pope County, where farms, subdivisions, roads, water, and small forest patches meet closely, the real boundary on the ground can be much finer than the block-like pattern shown in a countywide raster.
Frequently Asked Questions
What is the dominant land cover in Pope County?
Forest is the dominant 2025 class at 63.35%. Agriculture accounts for 22.24%, developed land 7.79%, and water 2.37%. The forest is concentrated most strongly across the northern half, while farming and development are more prominent in the southern Arkansas River Valley.
Which map is best for seeing the Russellville development cluster?
The impervious surface and developed-land map is the clearest choice. Pope County has a mean impervious value of 1.87%, but the highest values are tightly concentrated around Russellville, with smaller linear and point patterns elsewhere in the southern valley.
Does the 17.99% change figure mean that 17.99% of Pope County changed legal land use?
No. The figure measures cells whose mapped land-cover class differs between 1985 and 2025. Real landscape change can contribute, but mixed pixels, classification differences, and shifts among nonlegal land-cover categories can also be included. Map File Information The four Pope County land-cover maps shown in this article are packaged together in one ZIP. The archive contains the original JPG versions, which are larger than the web previews and convenient for printing, presentations, classroom materials, or county comparisons.
Map File Information
Download the map files associated with this page for reference, printing, and compatible visual projects.
- Included Files: Use only the versions confirmed in the article and supplied images
- File Type: Use the confirmed download contents
- Intended Use: Printing, education, presentations, and map-based projects
Related Maps
- A Craighead County Arkansas Land Cover Map
- Arkansas County Arkansas Land Cover Map
- Ashley County Arkansas Land Cover Map
Sources and references
- MRLC Annual NLCD Data – official access point for Annual NLCD land cover, impervious surface, and related products
- USGS Annual NLCD Land Cover Classification – official explanation of the land-cover classes and classification system used for interpreting the maps
- U.S. Census Bureau TIGER/Line Shapefiles – official boundary data for checking county, municipal, road, and other geographic boundaries separately from land cover
- Pope County Arkansas – County History – official local context for the Arkansas River Valley, Ozark National Forest, Russellville, incorporated communities, and transportation
Green Map creates custom-edited map images using open geographic data sources such as geoBoundaries, Natural Earth, OpenStreetMap, and government open data.
These maps are edited visual materials, not raw data files, and are provided for education, documents, presentations, and graphic reference.