Crawford County is predominantly agricultural in the supplied 2025 land-cover data, yet the county does not read as one uninterrupted field surface. Agriculture covers 68.84%, while wooded belts break up the farm blocks, a concentrated developed area stands out around Robinson, and wetland and water classes appear repeatedly along the irregular eastern edge near the Wabash River. Those contrasts make the county useful for comparing rural cover with smaller development and river-related natural areas.
This Crawford County Illinois Land Cover Map page brings together four views: the 2025 land-cover overview, a forest-and-farmland map, an impervious-surface and developed-land map, and a 1985–2025 class-difference map. WebP versions are displayed in the article, and the four original 2480 × 1754-pixel JPG maps are supplied together in one ZIP for printing, teaching, presentations, and county-level comparison.
Table of Contents
Agriculture covers most of the county, but forest and wetlands repeatedly interrupt the field pattern
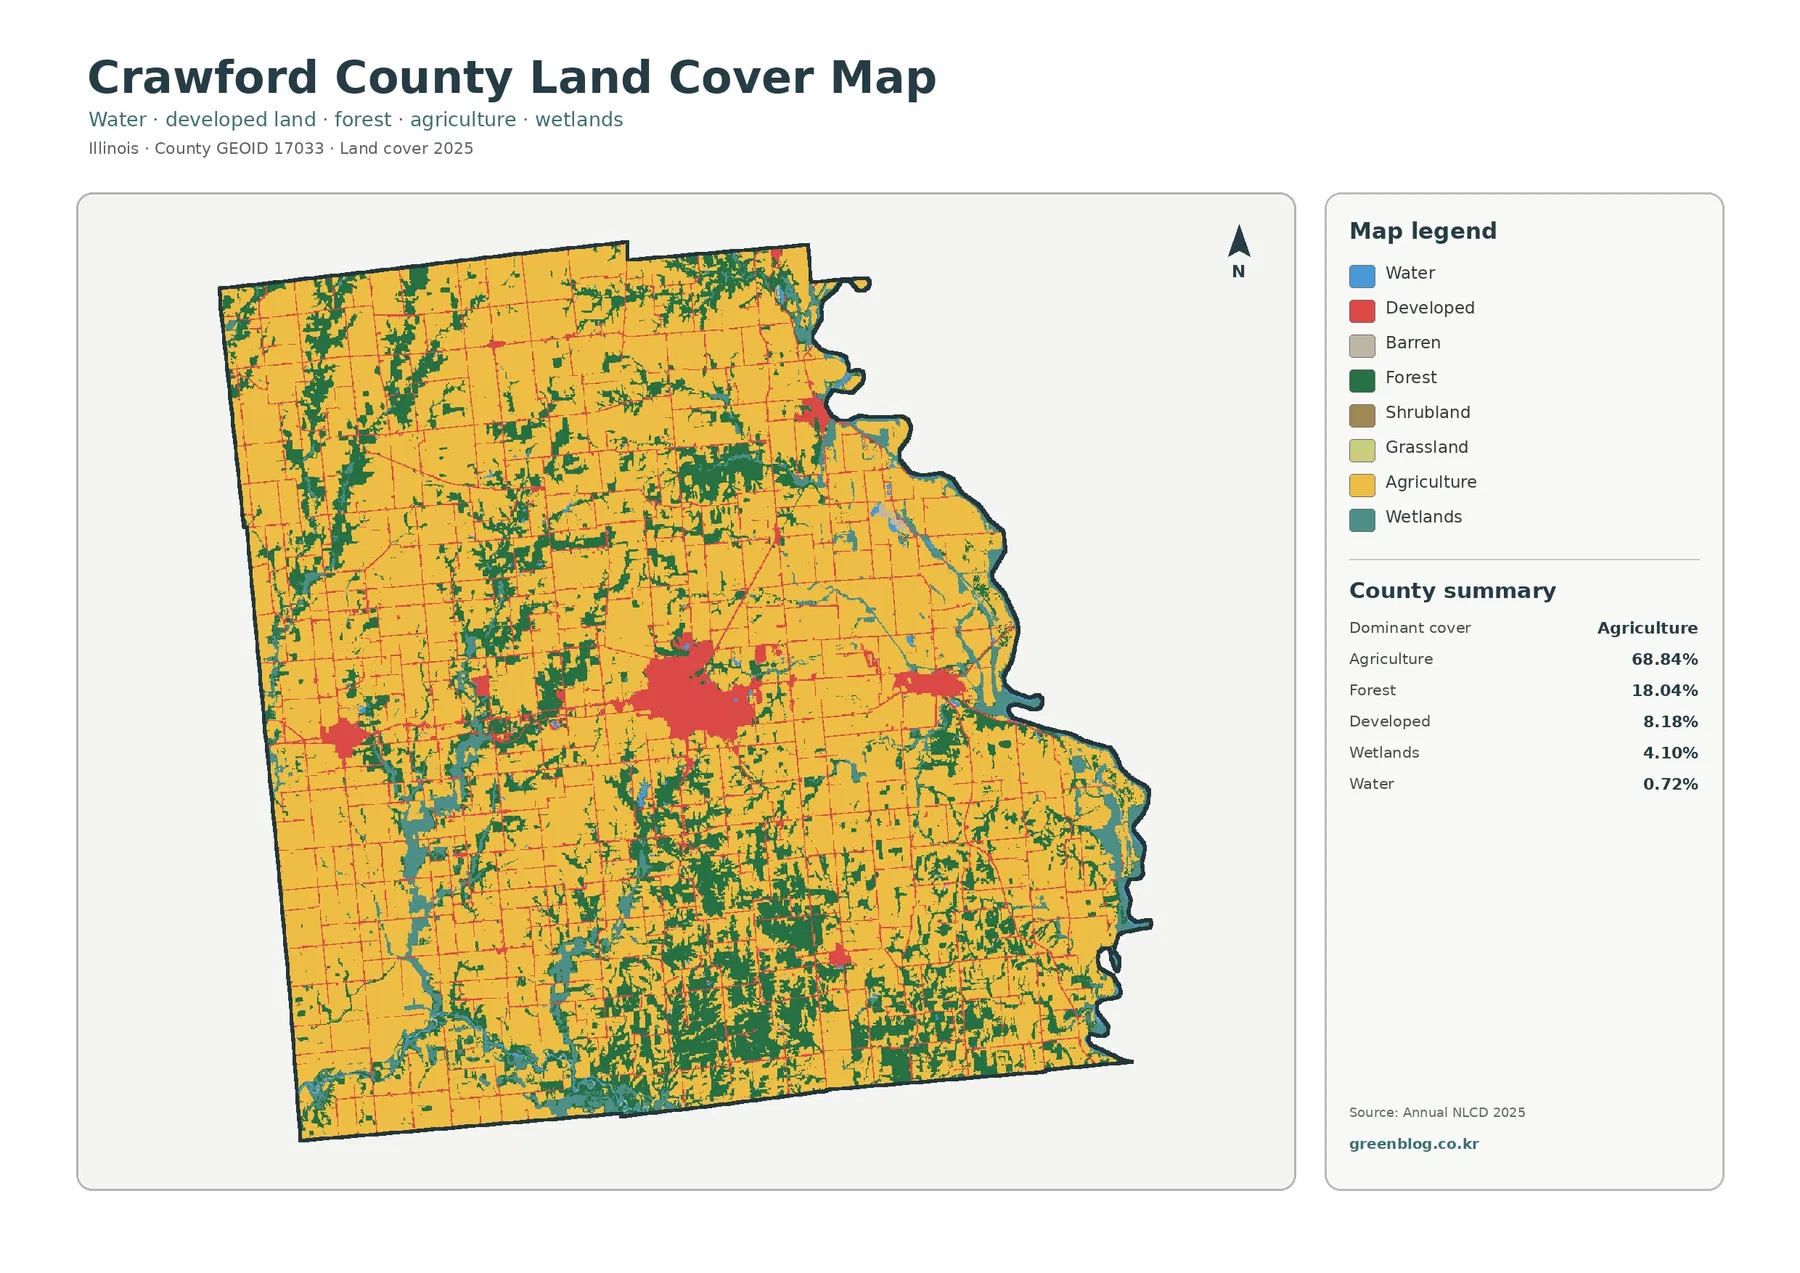
The countywide map is dominated by the agricultural class, especially across the north and west where large field blocks form broad continuous areas. Agriculture accounts for 68.84% of the 2025 summary. Forest is the second-largest major class at 18.04%, and it becomes more visible toward the southern half of the county, where green corridors and patches reach into the farm landscape rather than remaining in one isolated tract.
Developed land occupies 8.18%. That is a much smaller share than agriculture, but the central developed cluster is visually prominent because its red map color is concentrated around Robinson. Smaller developed patches and thin road-aligned traces occur elsewhere. The pattern is therefore better described as a rural county with a few clear settlement centers than as a uniformly developed landscape.
Wetlands make up 4.10% and water 0.72%. Their percentages are modest, yet they appear repeatedly because many wet areas are narrow or fragmented. The eastern boundary and the southern part of the county show especially frequent combinations of forest, wetland, and water classes. A reader looking only at the county totals could miss how often these narrower natural-cover features divide the larger agricultural blocks.
The southern half contains a denser network of wooded strips between farm blocks
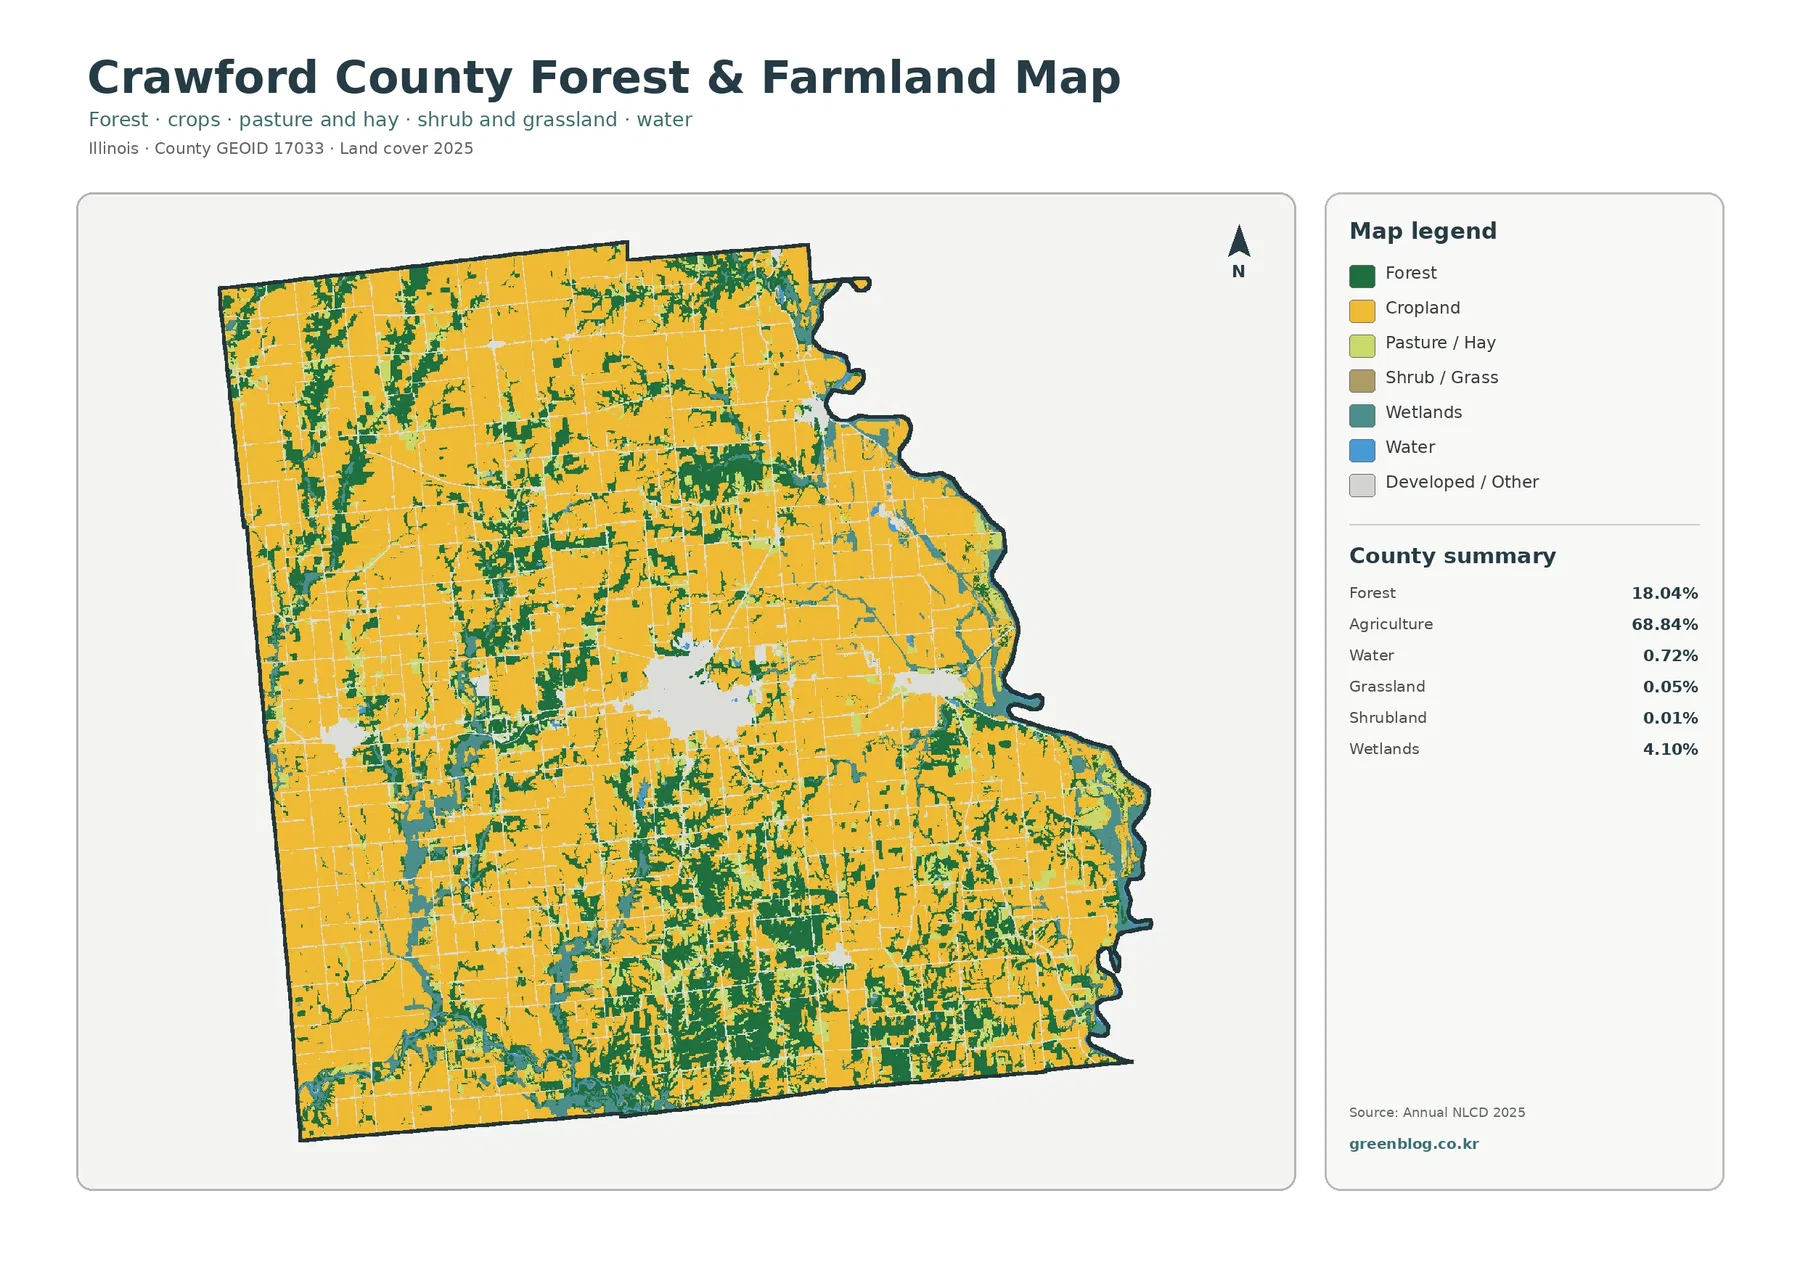
The forest-and-farmland view removes much of the visual competition from urban classes and makes the rural pattern easier to follow. Large agricultural areas remain dominant, but the woods form branching shapes that repeatedly cut across or border the fields. The south is particularly different from the broad northern farm blocks, with more frequent green patches and connected strips.
This view also shows why a countywide forest percentage of 18.04% can feel substantial on the map. A single broad forest tract would occupy a clear block, whereas many narrow wooded corridors touch more field edges and therefore appear throughout the image. Wetlands add another 4.10%, reinforcing the more broken pattern around lower or wetter areas even though those cells are not part of the forest total.
Grassland and shrubland are minor in the supplied summary, at 0.05% and 0.01% respectively. They are not large enough to define Crawford County’s overall appearance. For most readers, the more useful comparison is the boundary between agriculture, forest, wetland, and developed land. Land cover also should not be confused with zoning or ownership: it describes the surface class, not what a parcel is legally allowed to be used for.
Robinson forms the strongest impervious cluster in an otherwise low-impervious county
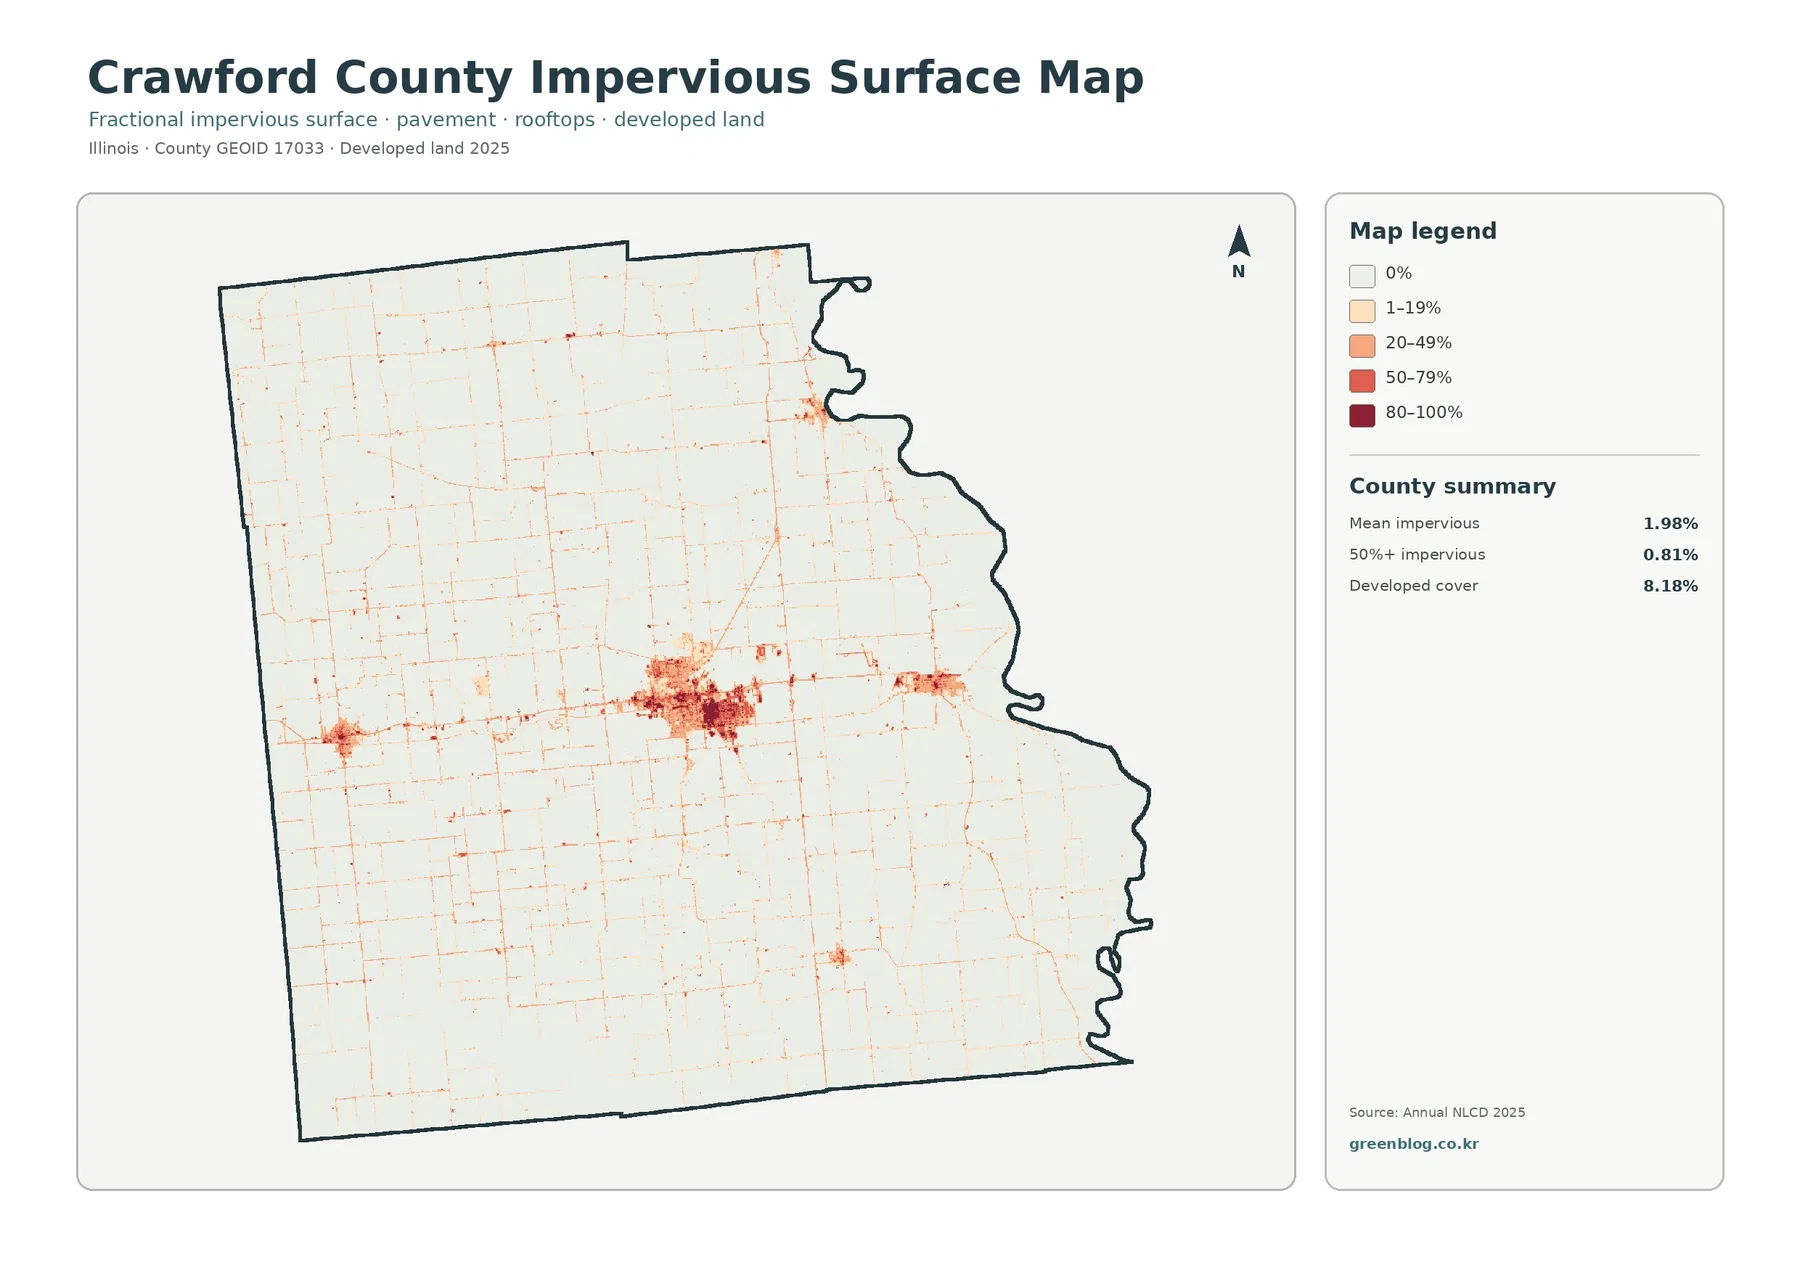
The impervious-surface map answers a different question from the general developed-land class. It estimates the share of hard surface within each mapped cell, including pavement and rooftops. Crawford County’s mean impervious cover is only 1.98%, which confirms that hard surfaces are a small part of the county overall. Around Robinson, however, the darker 50–79% and 80–100% classes form a compact concentration that is easy to distinguish from the surrounding countryside.
Only 0.81% of the county falls into the 50% or greater impervious category. That value helps explain why an 8.18% developed-land share can coexist with a much lower countywide impervious average. Developed land can include low-density residential areas and other places where vegetation remains between roads and buildings, while the darkest impervious classes are limited to the most heavily covered surfaces.
Beyond Robinson, smaller clusters are visible to the east and west, and road lines create thin traces across the county. The map is useful for separating the location of development from its surface intensity, but it is not a population-density or building-value map. A dark cell indicates a high proportion of impervious surface, not necessarily a large number of residents or a particular land use.
Wetlands and water along the Wabash side make the eastern edge look different from the interior
Crawford County’s eastern boundary follows the Wabash River area, and the supplied land-cover map shows water and wetland classes repeatedly near that irregular edge. Forest and wetland colors also become more common in parts of the southeast. This contrasts with the larger and more regular agricultural blocks found across much of the north and west, giving the river side a more fragmented appearance.
The mapped wetland share of 4.10% should not be treated as a legal wetland inventory or an exact floodplain boundary. These are land-cover classification cells. Regulatory wetland limits, flood insurance boundaries, parcel lines, and permit decisions require current agency data and, where appropriate, field verification. The map is best used to identify broad areas where wet cover is common and where more detailed checking may be useful.
The 7.45% class difference from 1985 to 2025 includes several kinds of mapped change
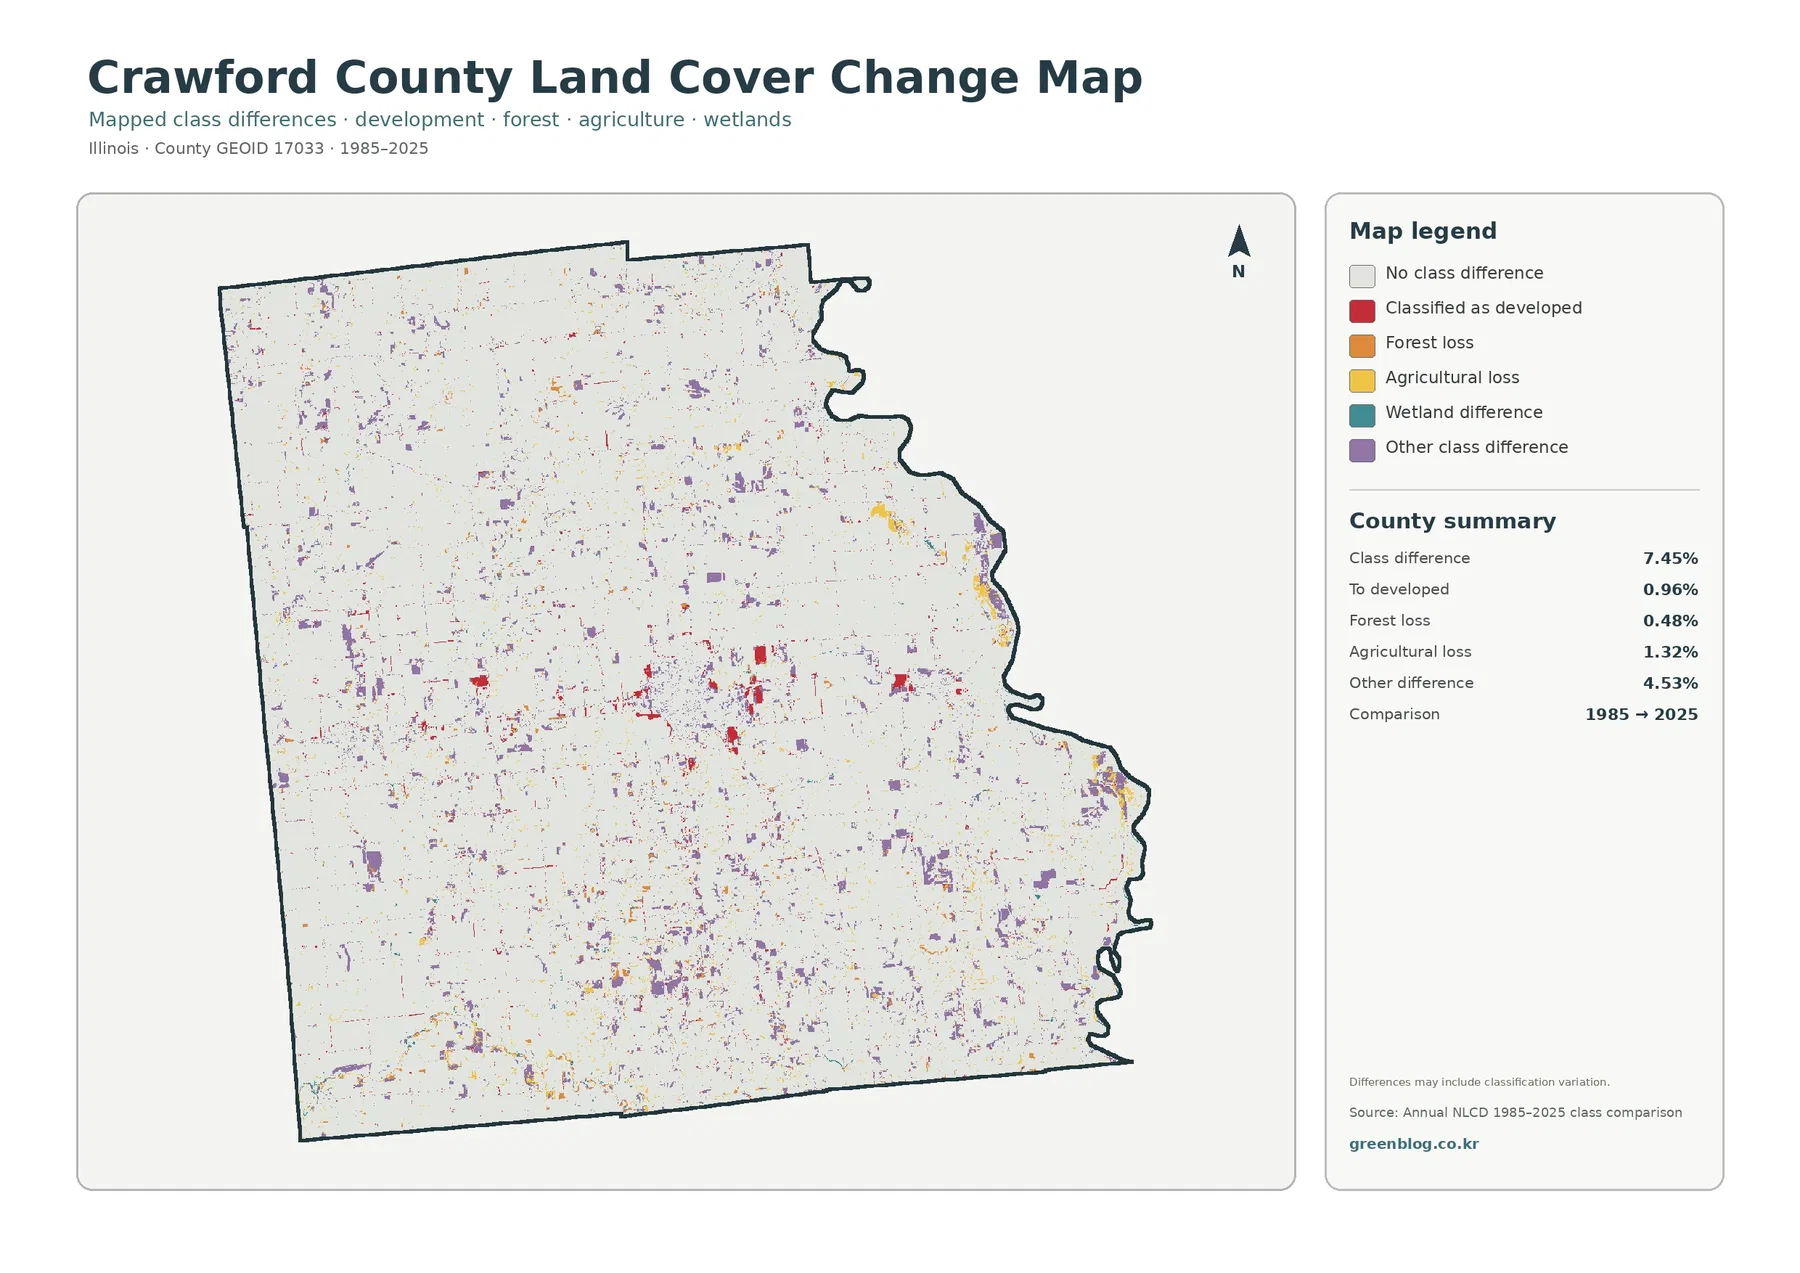
Most of the change map remains in the no-difference background, while colored cells mark places that received different classes at the two endpoints. The total class difference is 7.45%. Within that amount, 0.96% is classified as developed change, 0.48% as forest loss, 1.32% as agricultural loss, and 4.53% as other class difference. The total therefore cannot be read as a 7.45% increase in development.
Red developed-change marks are most noticeable around the central settlement area and a few smaller clusters. Purple other-difference cells are more widely scattered, while yellow and wetland-related marks occur in several parts of the county, including near the eastern edge. The map is useful for locating places that deserve a closer look, but it does not identify the exact year or cause of every class transition.
Annual NLCD products are raster classifications, and small isolated differences can reflect classification variation as well as real surface change. A broad or repeated patch is generally more informative than one tiny pixel group. For any location where the reason for change matters, compare the map with additional years, recent aerial imagery, local planning information, or field observations rather than assigning a cause from this image alone.
Use the four maps together, but choose one as the lead image for each question
For a quick county overview, start with the land-cover map because it shows agriculture, forest, developed land, wetlands, and water in one frame. If the question is how wooded land interrupts the fields, move to the forest-and-farmland map. When the focus is Robinson or other settlement surfaces, the impervious map is more precise because it separates low and high hard-surface percentages. The change map is most useful after the present-day pattern is already understood.
The supplied JPGs are 2480 × 1754 pixels and are provided in their original package dimensions rather than being artificially enlarged. They work well for county-scale reference, education, presentations, and general printing, but they are not parcel surveys. Fine legal boundaries, current permit decisions, or site-specific wetland determinations should be checked against the appropriate official GIS and agency records.
Download the four original Crawford County JPG maps
Frequently Asked Questions
Why does forest look so widespread when agriculture covers 68.84%?
Forest accounts for 18.04% and is distributed in many branching strips and patches, especially in the southern half. Those narrow features touch many farm edges, so they appear frequently across the map even though agriculture still covers more than two-thirds of the county.
Does the dark area around Robinson mean the whole developed class is highly impervious?
No. Developed land covers 8.18%, but the countywide mean impervious cover is 1.98% and only 0.81% of the county is at least 50% impervious. The darkest surfaces are concentrated in a small part of the developed footprint.
Is the 7.45% difference from 1985 to 2025 the county’s urban growth rate?
No. Only 0.96% is shown as change classified to developed land. The total also includes 1.32% agricultural loss, 0.48% forest loss, 4.53% other difference, and additional mapped categories, so it represents several types of endpoint class differences.
Sources and Reference Data
- MRLC Annual NLCD Data – official access to annual land-cover data and comparison products
- USGS Annual NLCD Land Cover Classification – class definitions and interpretation guidance
- U.S. Census Bureau TIGER/Line Shapefiles – official county-boundary reference
- Illinois IEMA-OHS Crawford County Multi-Hazard Mitigation Plan – Wabash River and local natural-hazard context
- Crawford County Government – county departments and local information
- University of Illinois Extension – Clark, Crawford and Edgar Counties – local agriculture and natural-resources information
Map File Information
The ZIP contains the original JPG versions of the 2025 land-cover, forest-and-farmland, impervious-surface, and 1985–2025 class-difference maps.
- Included Files: Four Crawford County JPG maps
- Intended Use: Printing, education, presentations, and county comparison
Related Maps
- Adams County Illinois Land Cover Map
- Alexander County Illinois Land Cover Map
- Bond County Illinois Land Cover Map
Green Map creates custom-edited map images using open geographic data sources such as geoBoundaries, Natural Earth, OpenStreetMap, and government open data. These maps are edited visual materials, not raw data files, and are provided for education, documents, presentations, and graphic reference.