You can download all four Clayton County maps on this page as one ZIP containing the original A3 high-resolution JPG files. The set includes a county-and-roads map, a city distribution map, a water map, and an elevation map. Clayton County sits immediately south of Atlanta, where Forest Park, Lake City, Morrow, Jonesboro, Riverdale, and Lovejoy occupy a compact suburban area crossed by major roads, creeks, and rolling Piedmont terrain.
Jonesboro is a useful central reference, while Forest Park anchors the northern side near the airport and Lovejoy marks the narrower southern portion. From those points, the road map explains how I-75, I-675, US 19/41, and Georgia 85 connect the county; the water map follows the Flint River and a web of tributaries; and the elevation view shows why the river and creek corridors sit below surrounding uplands. Reading the maps in that order makes Clayton easier to understand than treating it simply as a group of suburbs below Atlanta.
Table of Contents
A narrow county footprint beside Atlanta and the airport
Clayton County borders Fulton County on the northwest, DeKalb County on the northeast, Henry County on the east, Spalding County on the south, and Fayette County on the west. Its northern edge reaches the Hartsfield–Jackson Atlanta International Airport area, then the county narrows as it extends south. That shape helps explain why the northern half feels much more urban on the map: roads, city labels, institutional sites, and developed areas are packed closely together, while the far southern extension has fewer labeled cities and more visible creek valleys and open land.
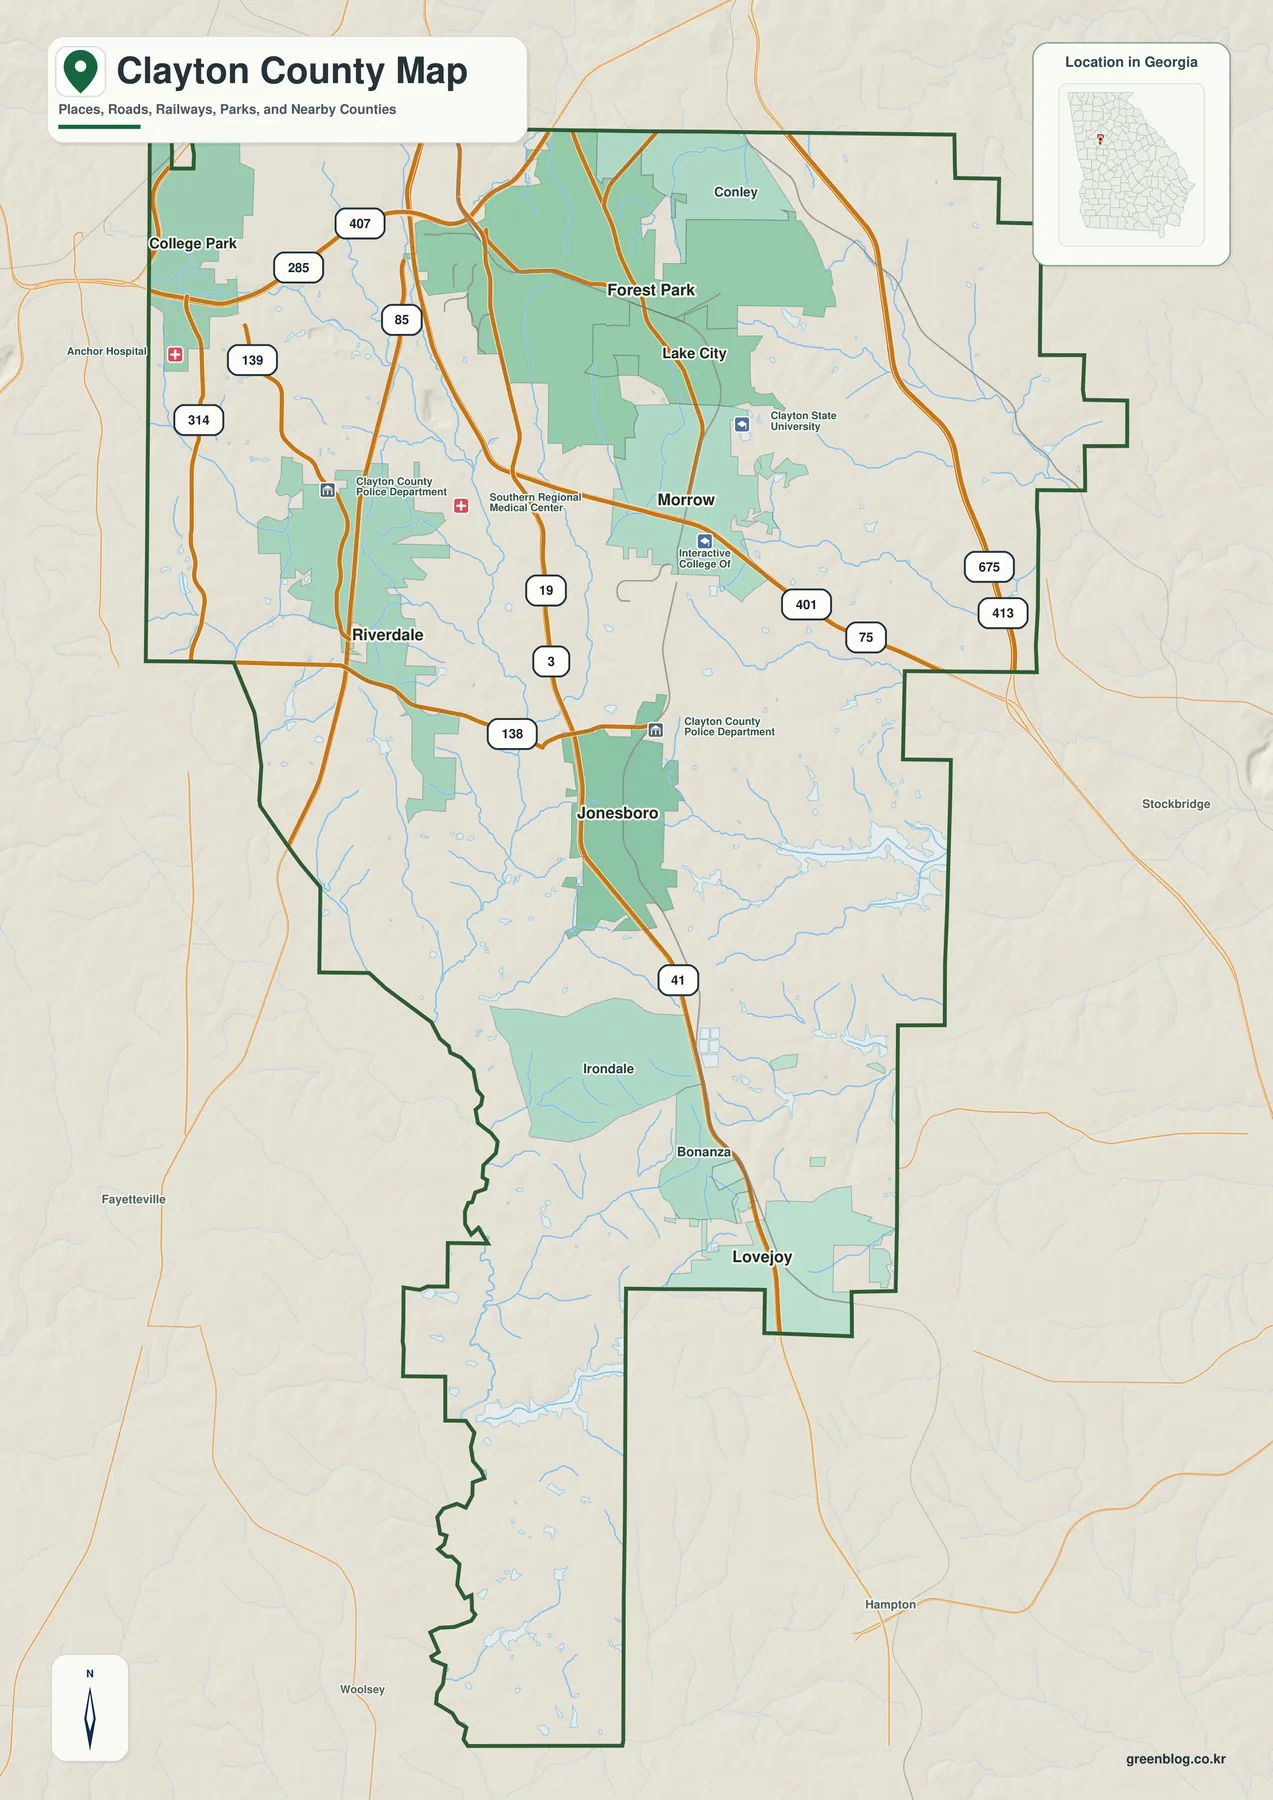
Several transportation corridors give the county its internal structure. Interstate 75 passes the Morrow side and continues southeast into Henry County. Interstate 675 ties the northeastern side of the county to the I-285 area and I-75. US 19/41 runs through Jonesboro and remains one of the clearest north-south references on the map, while Georgia 85 serves the Riverdale side and the area west of the airport. The county map also shows I-285 near the northern edge, reinforcing how quickly Clayton connects to the broader Atlanta road network.
The current source material reports a 2020 population density of 2,100.9 people per square mile. That figure fits what the map suggests: Clayton has a relatively small footprint but a closely spaced chain of cities and developed corridors. It is therefore more useful to orient yourself with several cities and major roads at once than to treat Jonesboro as the only center of activity.
| State | Georgia |
|---|---|
| County seat | Jonesboro |
| Six cities labeled on the city map | Forest Park, Riverdale, Lovejoy, Morrow, Jonesboro, Lake City |
| Important road references | I-75, I-675, US 19/41, Georgia 85 |
| Main water reference | Flint River and its tributaries |
| Elevation shown | about 132–321 m · mean about 269 m |
| Download | four A3 high-resolution JPG maps in one ZIP |
Six labeled cities from Forest Park to Lovejoy
The city map focuses on Forest Park, Riverdale, Lovejoy, Morrow, Jonesboro, and Lake City. Forest Park is the northernmost of the six, with Lake City and Morrow below it. Jonesboro sits farther south near the middle of the county, Riverdale is offset to the west, and Lovejoy lies in the narrow southeastern portion. This arrangement makes the map useful for quickly separating the airport-side urban belt from the county-seat area and the more elongated southern section.
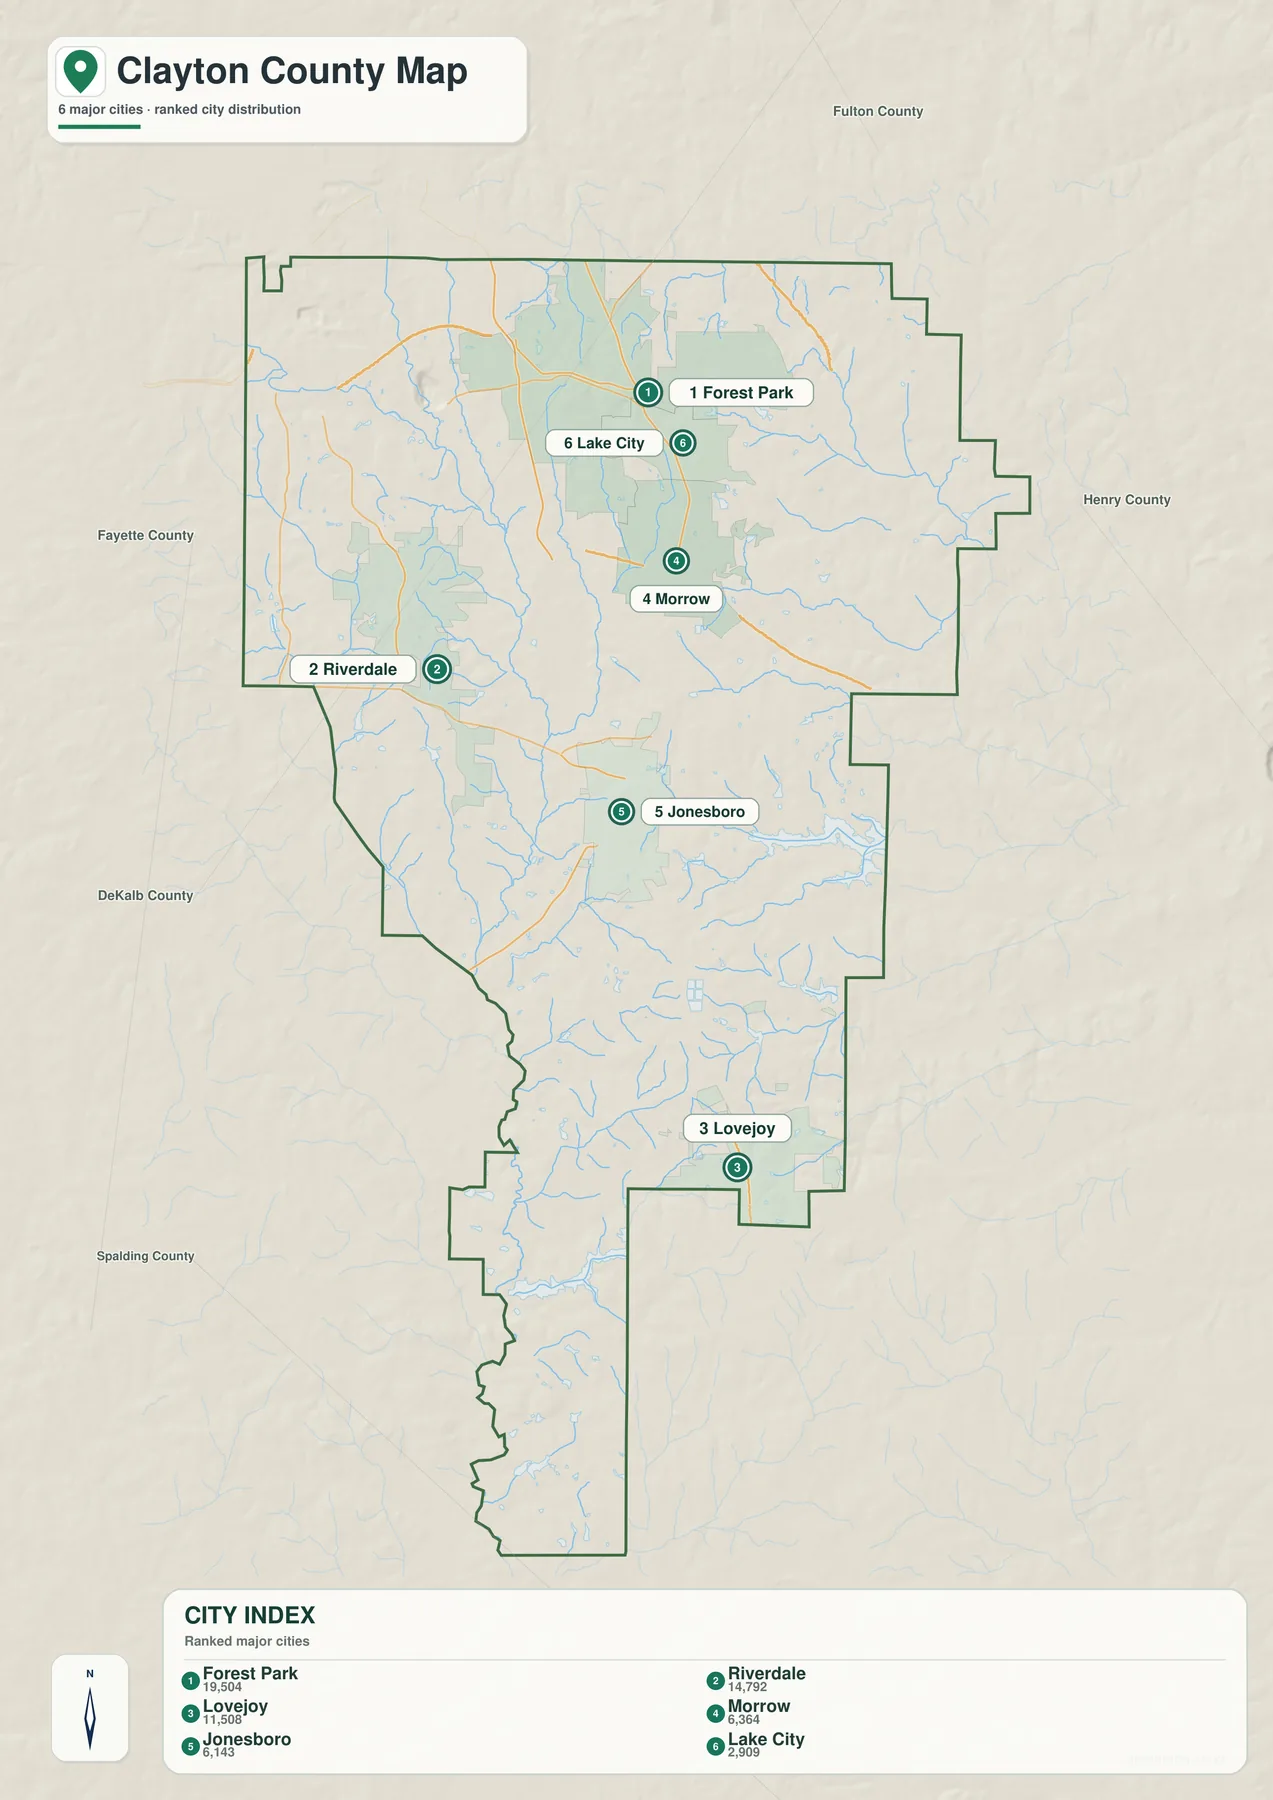
The index printed on the map ranks Forest Park first, followed by Riverdale, Lovejoy, Morrow, Jonesboro, and Lake City. Those markers help compare the selected places, but they should not be read as municipal boundary polygons. The source material also notes that Clayton County has seven incorporated cities when the part of College Park inside the county is included. College Park appears on the broader county map but is not part of the six-city ranked display, so the two maps serve slightly different purposes.
Jonesboro works especially well as an orientation point because it sits close to the county’s middle and serves as the county seat. Looking north from Jonesboro brings Morrow, Lake City, and Forest Park into view and points toward Atlanta and the airport. Looking south leads toward Lovejoy and the county’s narrow tail. Riverdale, by contrast, helps establish the western side of Clayton and its relationship to Georgia 85 and the airport’s western approaches.
This urban pattern has a transportation history behind it. The supplied background material says Clayton County was formed from parts of Fayette and Henry counties in 1858. Jonesboro developed with the railroad, and control of that rail corridor mattered during the 1864 Atlanta Campaign. In the present-day county, the airport district, freight and commercial activity along I-75, Clayton State University, and the Georgia Archives in Morrow all reinforce the same general north-south orientation. Clayton’s entry into the MARTA service district in 2014 added another direct metropolitan connection.
Flint River, tributary creeks, and scattered lakes
The Flint River is the central water reference in the supplied material. It begins near the airport area and runs south through the western side of Clayton County. On the water map, that main channel is joined by tributaries including Mud Creek, Jasper Creek, Camp Creek, Panther Creek, Rum Creek, and Swamp Creek. Instead of a single broad river valley, the county contains many smaller branches that cut between developed neighborhoods and uplands.
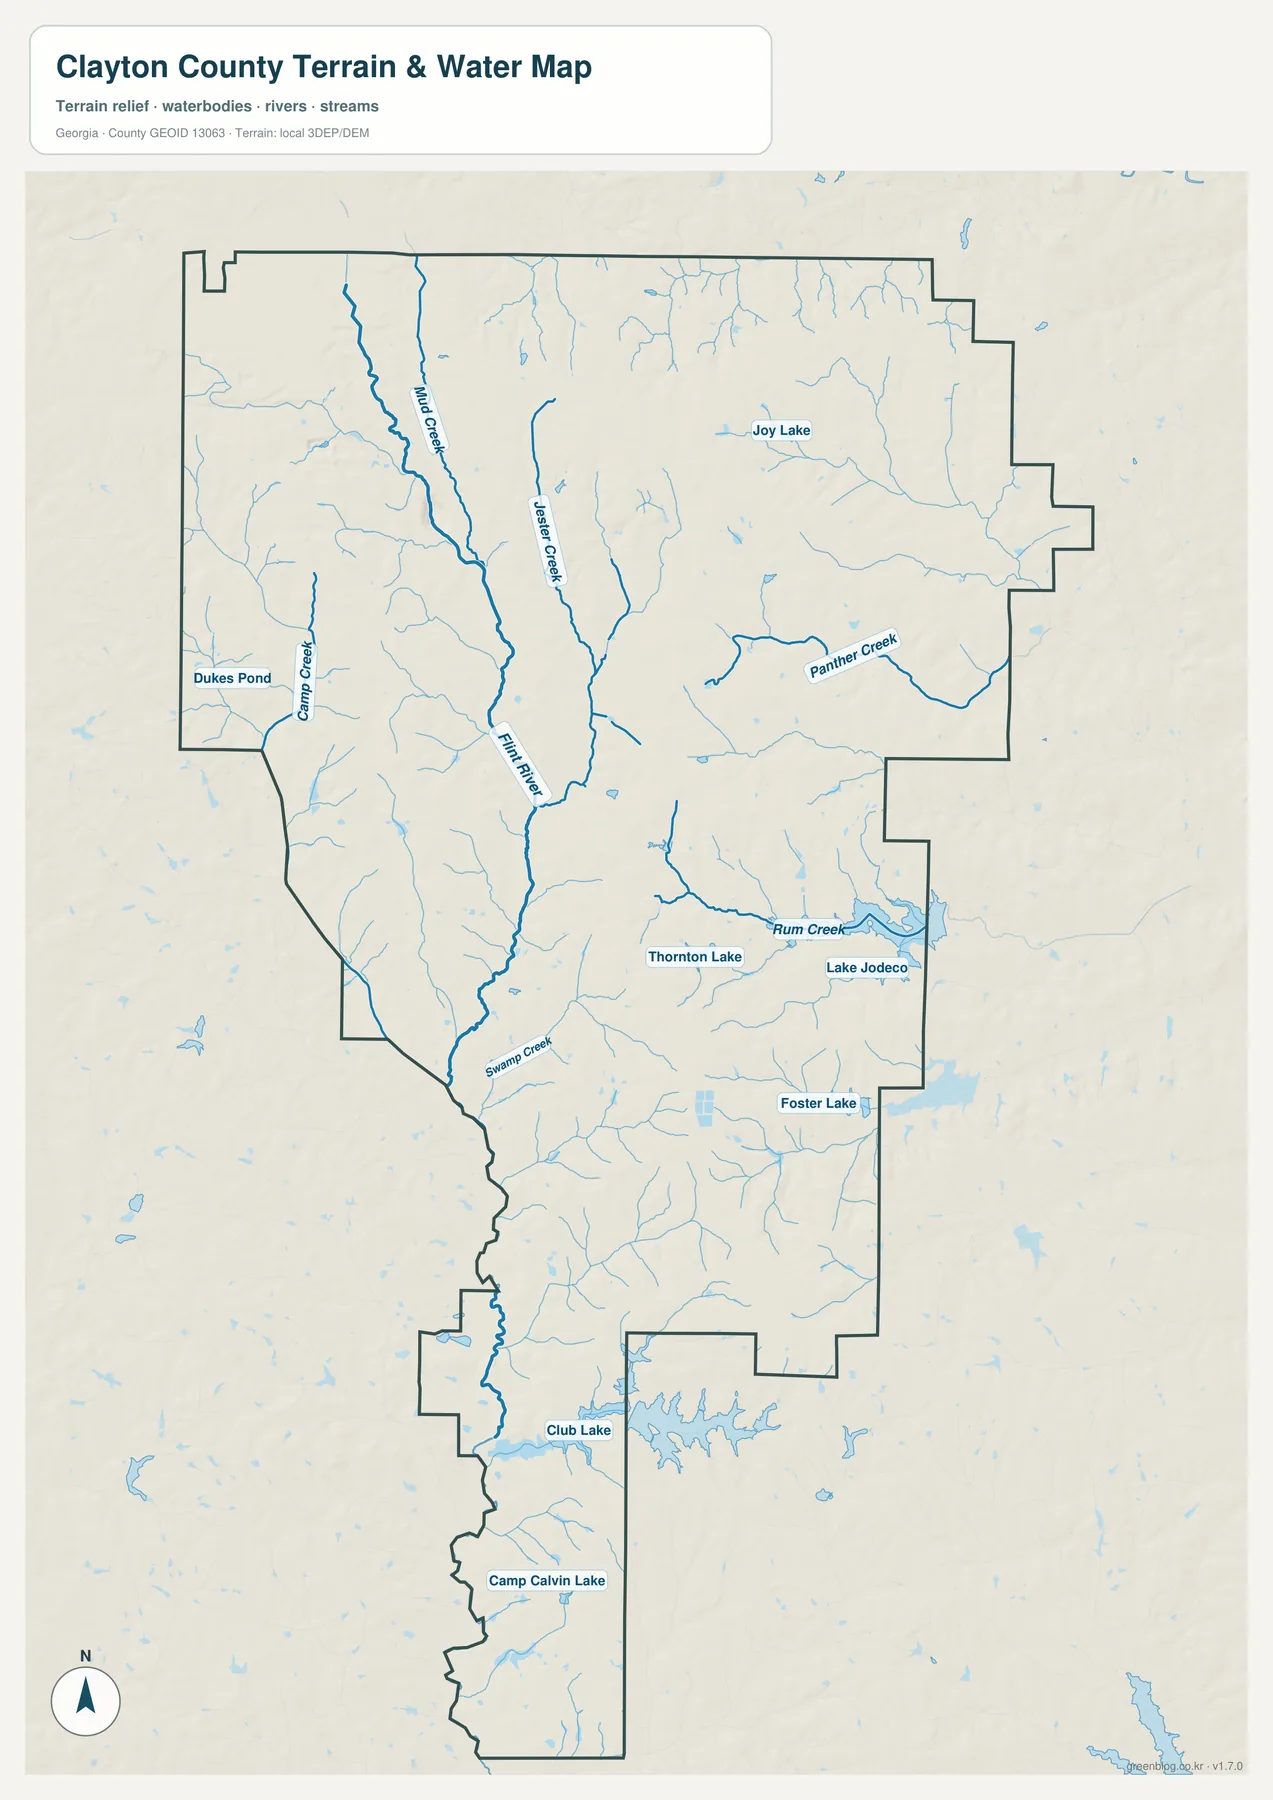
Several named water bodies help with local orientation. Joy Lake lies in the northeastern part of the map, while Thornton Lake and Lake Jodeco sit farther south and east. Foster Lake, Club Lake, Camp Calvin Lake, and Dukes Pond are also labeled. These features show that water remains part of the landscape even in a county dominated by suburban development. The southern section in particular has fewer city labels but continues to show a dense pattern of creeks and small water bodies.
Clayton’s water infrastructure extends beyond the names visible on this map. The preserved source material states that the Clayton County Water Authority can withdraw raw water from the Flint River and manages five raw-water reservoirs: J.W. Smith, Shamrock, Edgar Blalock Jr., William J. “Billy” Hooper, and Shoal Creek. The authority also uses constructed treatment wetlands in its water-reuse system. Those facilities are useful context for understanding the importance of water in the county, but the water map itself should be used as a geographic reference rather than as a complete utility map.
Blue lines on this image do not represent flood zones, parcel boundaries, or real-time water levels. A creek near a property does not by itself establish flood risk. Anyone making a safety, development, or property decision should consult current FEMA and local-government layers. For ordinary map reading, the main value here is seeing which waterways pass between the cities and where lakes sit within the county’s long footprint.
Relief between about 132 and 321 meters
The elevation map gives Clayton County an actual range of roughly 132 to 321 meters and a mean near 269 meters. This is rolling Piedmont country, not mountainous terrain, yet the shaded relief makes the differences between uplands and stream valleys easy to see. Higher brown and tan areas are common across the north and northwest, while greener lower corridors trace the Flint River and many of the smaller creeks. The long southern extension also contains repeated low valleys separated by modest ridges.
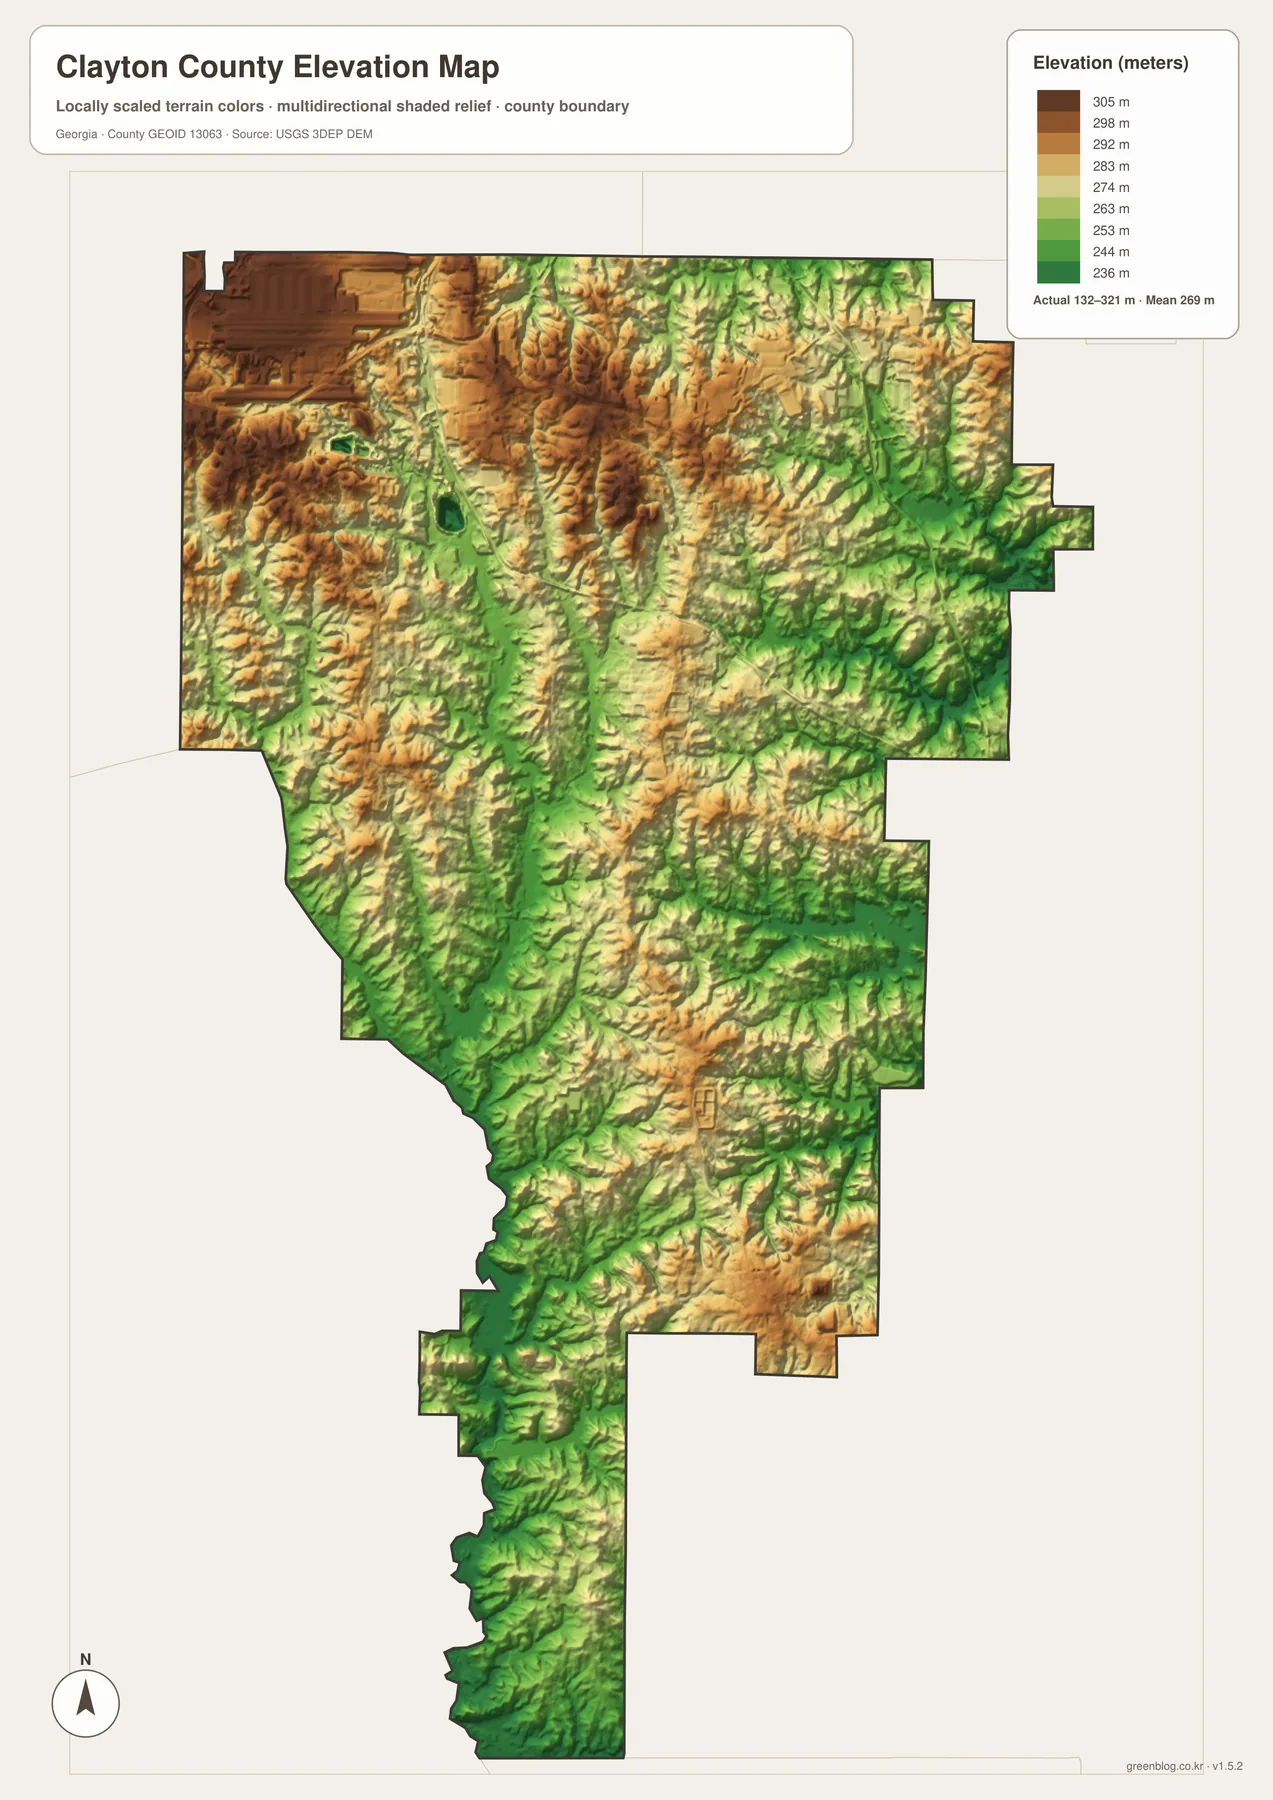
Comparing this map with the water map is particularly useful. The Flint River corridor lines up with a lower swath through the county, and tributaries such as Panther Creek and Rum Creek occupy lower cuts through the eastern terrain. Mud Creek and other northern branches also sit in visible troughs between higher ground. The pattern explains why a county that looks relatively flat on a simple road map can still contain many short slopes and narrow valleys.
The elevation colors are intended for county-scale comparison. They are not survey measurements for an individual parcel, road project, drainage design, or building site. If an exact point elevation is required, use the original USGS 3DEP data or a qualified survey. For general reference, however, this map is a straightforward way to distinguish uplands from the creek and river corridors that shape Clayton’s surface.
How roads, water, and relief fit together
The four maps work best when each answers a different part of the location question. Use the county map to establish the boundary and major road network. Move to the city map when you want to compare Forest Park with Jonesboro, Riverdale, or Lovejoy without the extra labels. Switch to the water map for the Flint River, creeks, and lakes, then use the elevation view to see whether those waterways occupy lower terrain than the surrounding neighborhoods.
A north-to-south example shows the benefit. Starting near Forest Park, the county map emphasizes the airport-side road network. Farther south, Jonesboro becomes the central reference on the city map, while the Flint River and tributaries continue through the county on the water view. By the time the map reaches Lovejoy and the southern tail, the road network is less visually dense but the creek system remains prominent. The elevation map adds one more layer by showing the low valleys that accompany many of those channels.
Riverdale provides a different example because it lies west of the county’s central chain. The city map makes that offset obvious, the county map adds Georgia 85 and the airport-side road context, and the water map shows Camp Creek and western drainage features. These are not turn-by-turn navigation maps, but they are useful for understanding why two nearby places may connect through particular road corridors rather than by the shortest straight line.
Choosing the right Clayton County map for the job
For a county overview, the boundary-and-roads map is the simplest starting point. A presentation about settlement or suburban growth may work better with the city map because the six selected places stand out immediately. Environmental lessons can pair the water and elevation maps to show how the Flint River and tributaries occupy lower terrain. If the map will be printed or placed into a document, the downloadable A3 JPG files provide more room for labels than the smaller WebP previews.
- Local orientation: locate Jonesboro, Forest Park, Riverdale, Lovejoy, Morrow, and Lake City within the county outline.
- Transportation context: compare I-75, I-675, US 19/41, and Georgia 85 with the city distribution.
- Water study: trace the Flint River and tributaries such as Mud, Jasper, Panther, Rum, Camp, and Swamp creeks.
- Terrain study: compare the roughly 132–321 meter elevation range with the river and creek valleys.
- Print and document use: use the four original high-resolution JPG files from the ZIP for larger layouts.
None of these maps replaces a legal boundary survey, parcel database, zoning map, current road advisory, flood-hazard layer, or engineering elevation survey. The city markers identify selected places rather than precise corporate limits, the water layer is a geographic reference rather than a flood product, and the elevation image is generalized for county-scale reading. Keeping those limits in mind makes the set useful for education, orientation, regional background, and ordinary map reference without asking it to do work it was not designed to do.
Frequently Asked Questions
Which cities are labeled on the Clayton County city map?
The city map labels Forest Park, Riverdale, Lovejoy, Morrow, Jonesboro, and Lake City. The source material separately identifies seven incorporated cities when the portion of College Park inside Clayton County is included, so the six-city map should not be treated as a complete municipal inventory.
Where is the Clayton County seat?
Jonesboro is the county seat and lies near the middle of the county. Its position makes it a convenient reference between Morrow and Forest Park to the north, Riverdale to the west, and Lovejoy to the south. For a courthouse or agency visit, verify the office’s current street address and hours separately.
What elevation range is shown for Clayton County?
The supplied elevation map shows an actual range of about 132 to 321 meters and a mean near 269 meters. Higher uplands and ridges alternate with lower corridors along the Flint River and tributary creeks. These values are for county-scale comparison and should not be used as parcel-level survey elevations.
What is included in the downloadable ZIP?
The ZIP contains four original A3 high-resolution JPG files: a county map, city map, water map, and elevation map. They are larger than the WebP page previews and are intended for printing, documents, presentations, and general reference. Legal, flood, parcel, and engineering work still requires the appropriate official source.
Map File Information
Clayton County high-resolution map files
- Included Files: 4 high-resolution A3 JPG map files shown in this article
- File Type: JPG files in a ZIP archive
- Intended Use: Printing, education, presentations, and map-based projects
Related Maps
Sources and reference data
The county background follows the sources preserved in the supplied package. The water and terrain descriptions also use the provided map previews and the official data references included with the rewrite materials.
- U.S. Census Bureau: Clayton County QuickFacts
- New Georgia Encyclopedia: Clayton County history
- Georgia Department of Community Affairs: Clayton County plans
- Clayton County Water Authority: Flint River, reservoirs, and water reuse
- USGS National Hydrography
- USGS 3D Elevation Program
Green Map creates custom-edited map images using open geographic data sources such as geoBoundaries, Natural Earth, OpenStreetMap, and government open data. These maps are edited visual materials, not raw data files, and are provided for education, documents, presentations, and graphic reference.