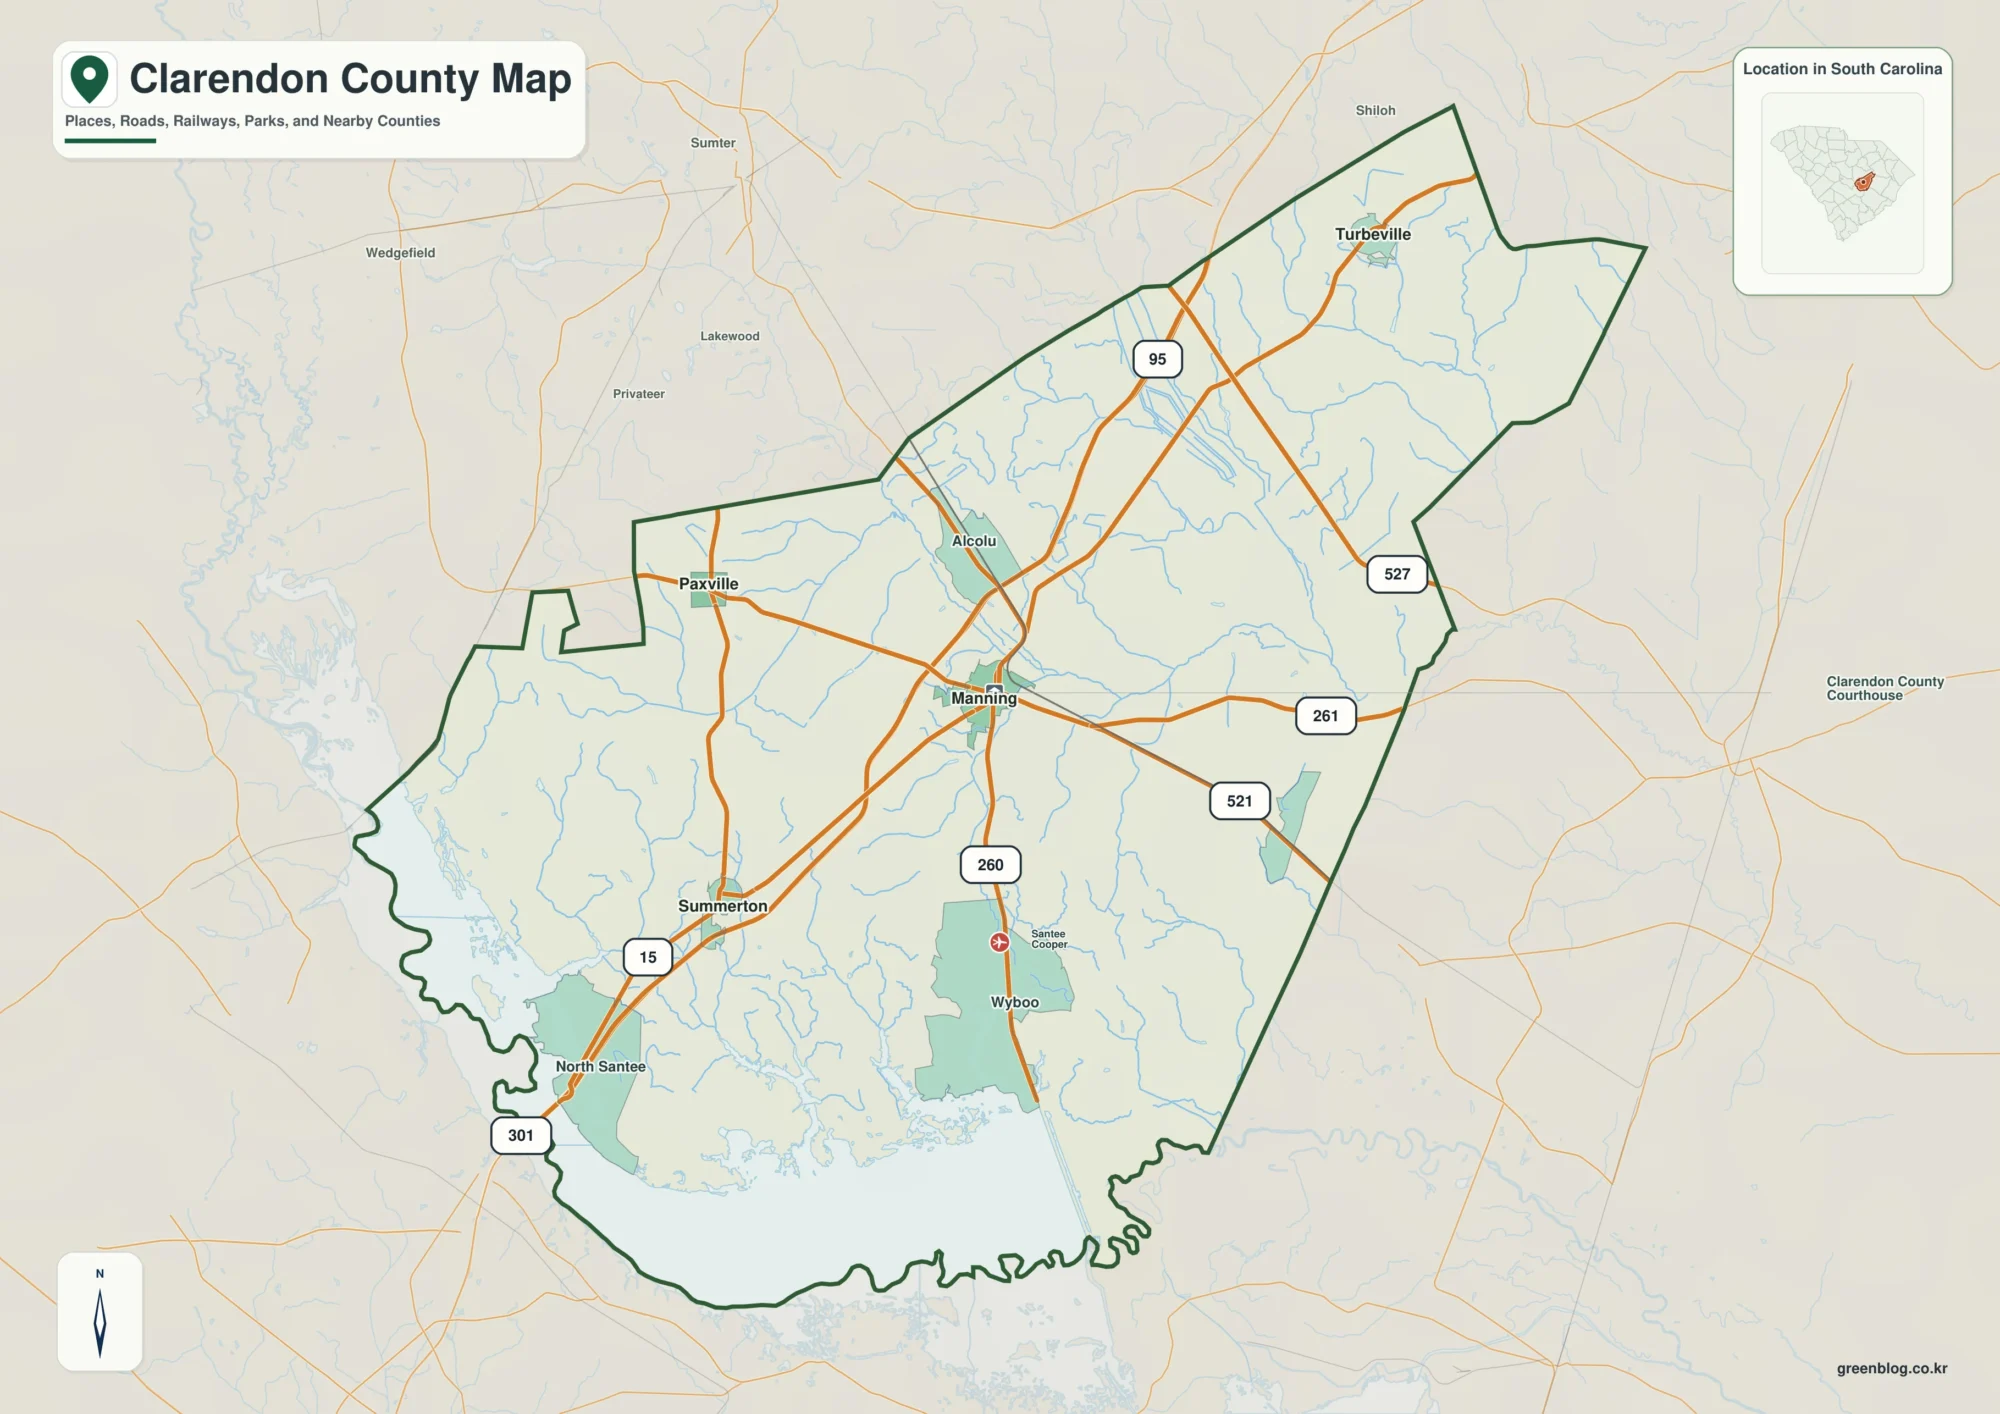
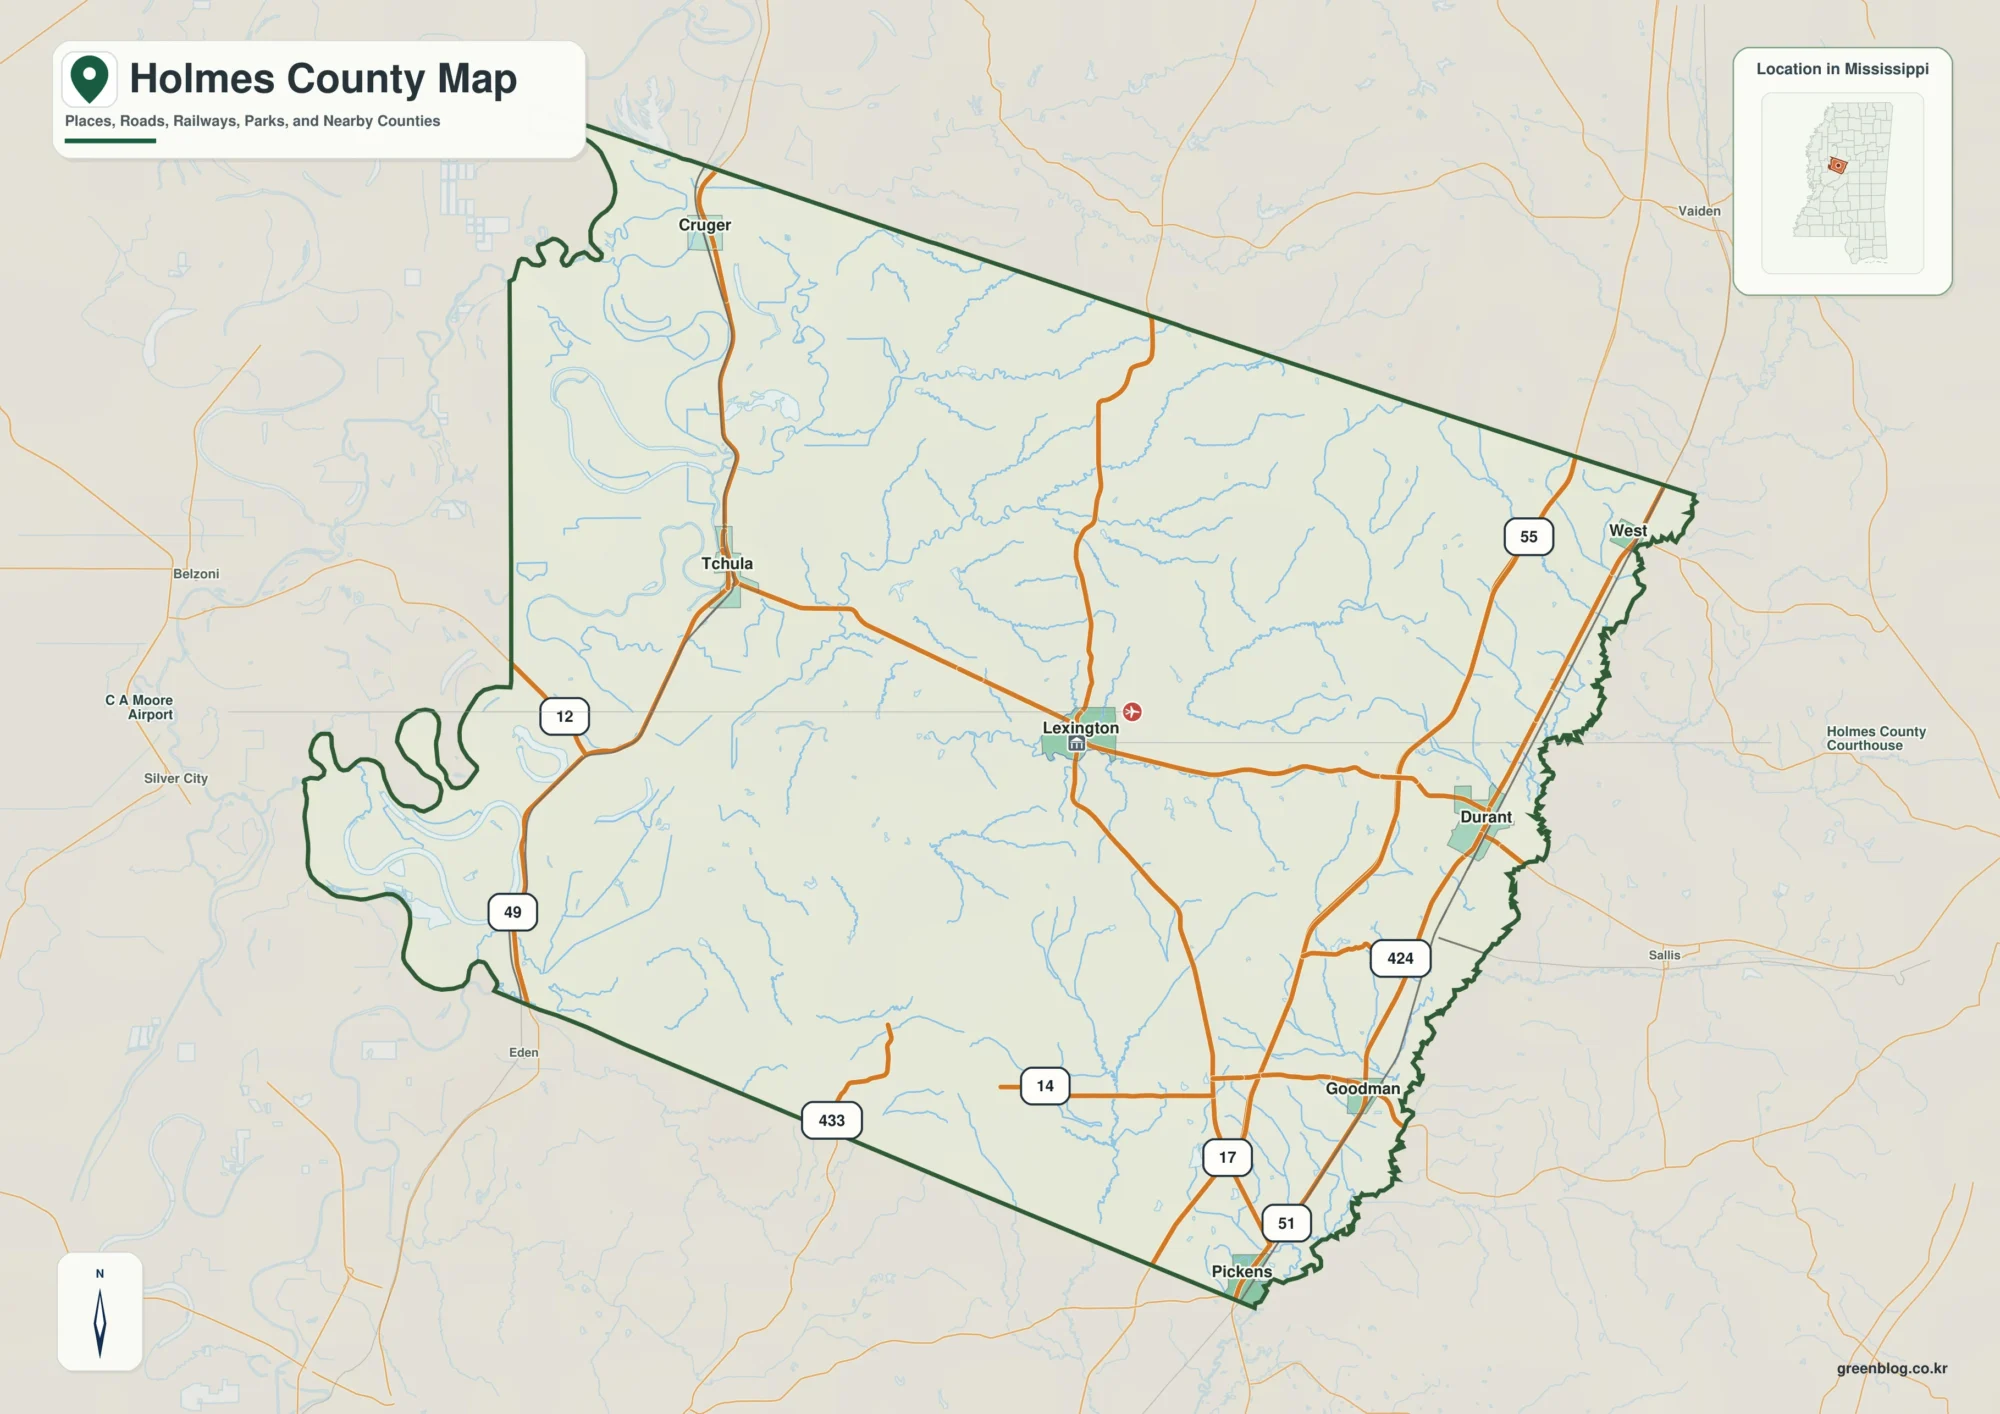
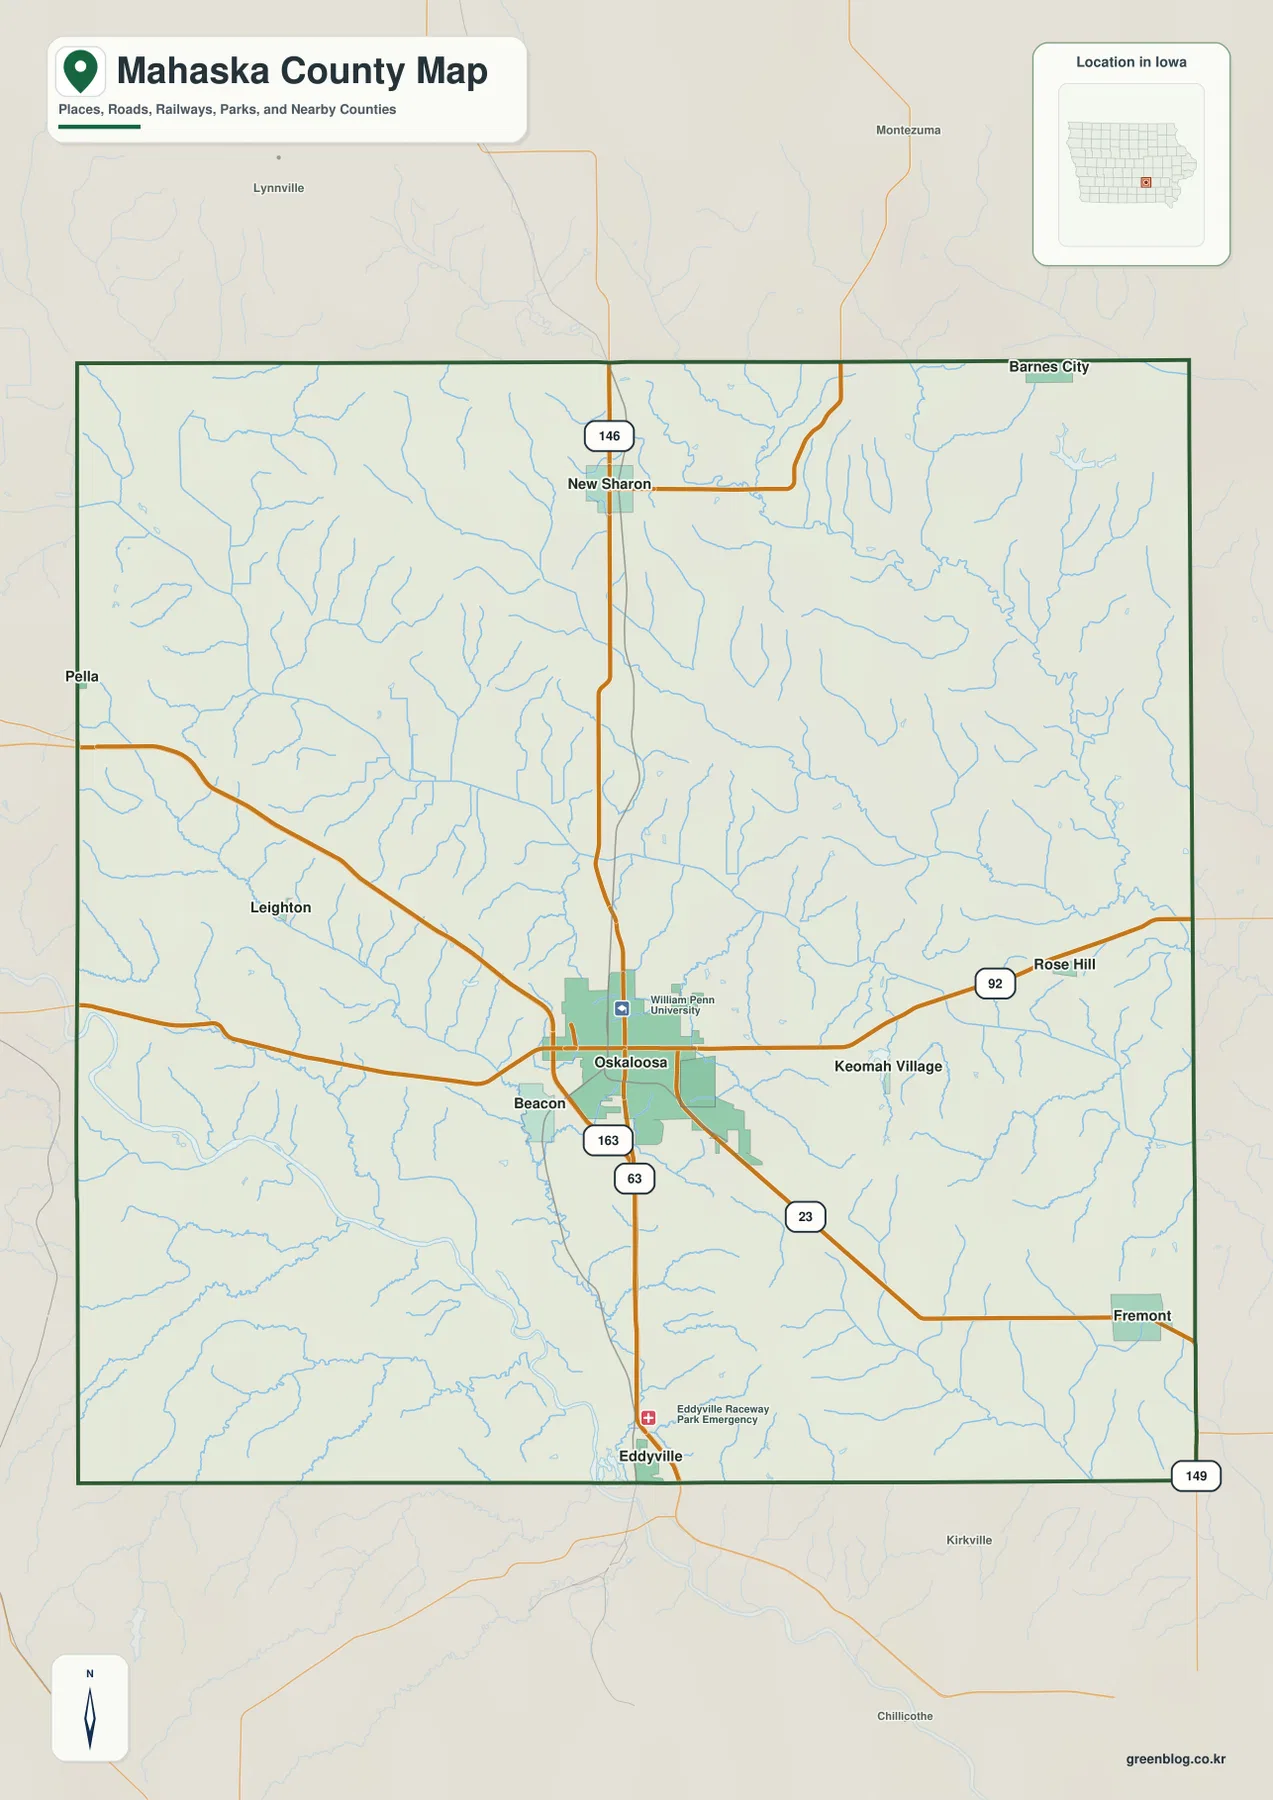
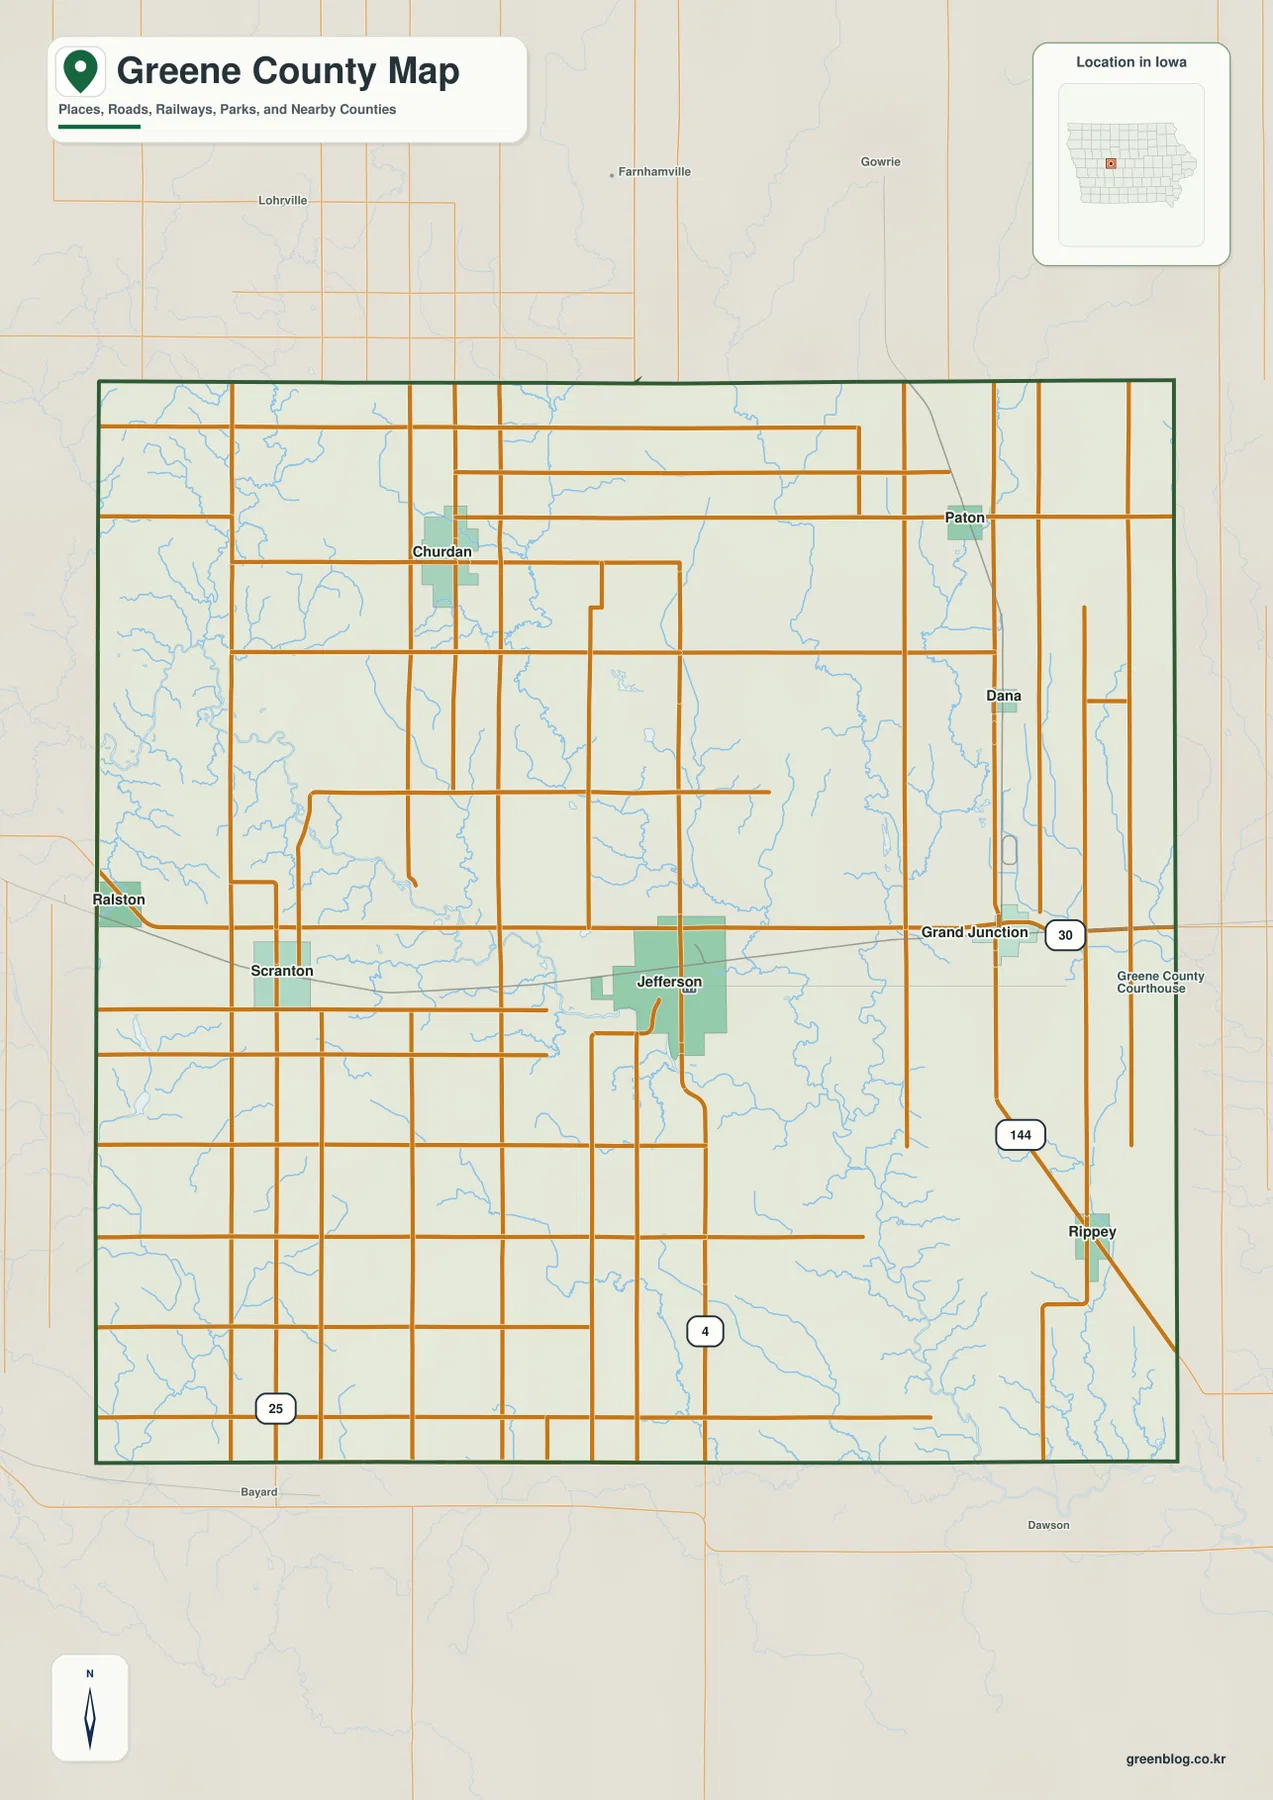
The Coffee County Tennessee Map on this page is organized around the county’s two most prominent city labels, Manchester and Tullahoma, but it goes well beyond a city locator. The page includes separate county, city, water, and elevation views, and the matching high-resolution JPG files are available together in a downloadable ZIP for printing, classroom work, presentations, or personal reference.
Manchester sits near the middle of the county and serves as the county seat, while Tullahoma occupies the southwest edge. New Union appears north of Manchester, Hillsboro lies to the southeast, and Lakewood Park provides a useful reference toward the northwest. The road network fans outward from Manchester, so the relationship among those places is easier to understand when the road map is read alongside the river and elevation views rather than as a simple list of town names.
Water and relief give Coffee County a second, equally important structure. Duck River and Little Duck River cross the central and western parts of the county, Normandy Lake spreads across the southwest, and several smaller lakes and creeks fill the surrounding drainage network. The elevation map reports an actual range of about 241 to 620 meters, with broad lower ground through much of the center and southwest and noticeably higher terrain along parts of the eastern boundary and the narrow northwest corner.
Table of Contents
Manchester as the road hub inside an irregular county outline
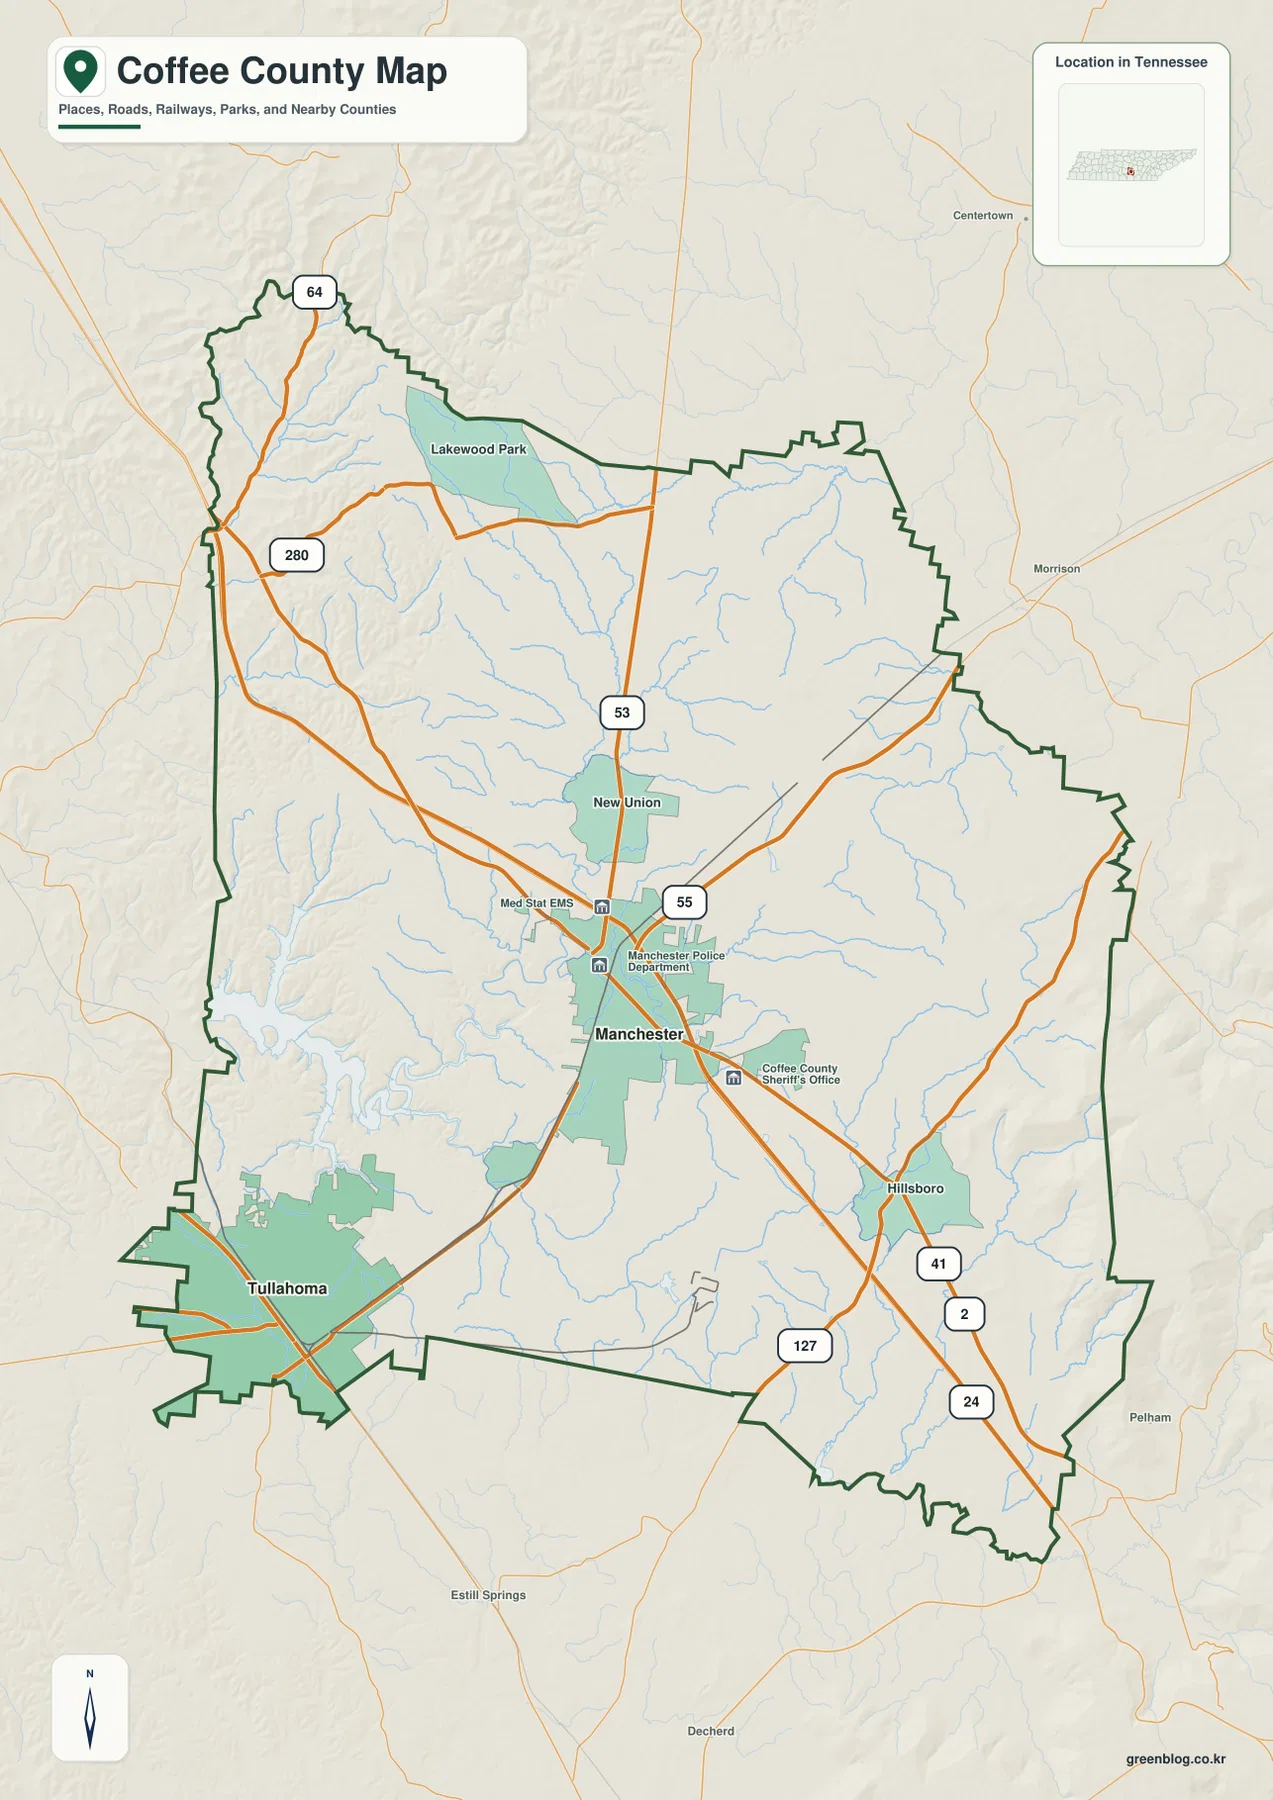
The general county map makes Manchester the clearest starting point. Route 53 approaches from the north and passes through the city, while Route 55 crosses the Manchester area. Southeast of town, the 41/2 corridor and Route 24 continue toward Hillsboro and the southern boundary. Farther west and northwest, Route 280 and Route 64 provide additional references. Taken together, these roads show a county whose major connections spread in several directions instead of following one straight line.
The smaller place labels help explain how those roads divide the county. New Union sits immediately north of Manchester near Route 53, Hillsboro marks the southeast side, and Lakewood Park lies well to the northwest. Tullahoma is different from all three because its built area reaches the southwest edge of the county. That placement makes the county boundary especially important when comparing Tullahoma with places across the Franklin and Rutherford County sides.
Coffee County’s outline is narrow in the northwest, broad through the middle, and elongated toward the southeast. Neighboring county labels include Cannon, Warren, Grundy, Franklin, Moore, Bedford, and Rutherford. The map is therefore useful for checking whether a road or nearby place lies inside Coffee County or just beyond its boundary, particularly around the southwest and southeast edges where several routes continue directly into adjoining counties.
Why Tullahoma and Manchester look so different on the city map
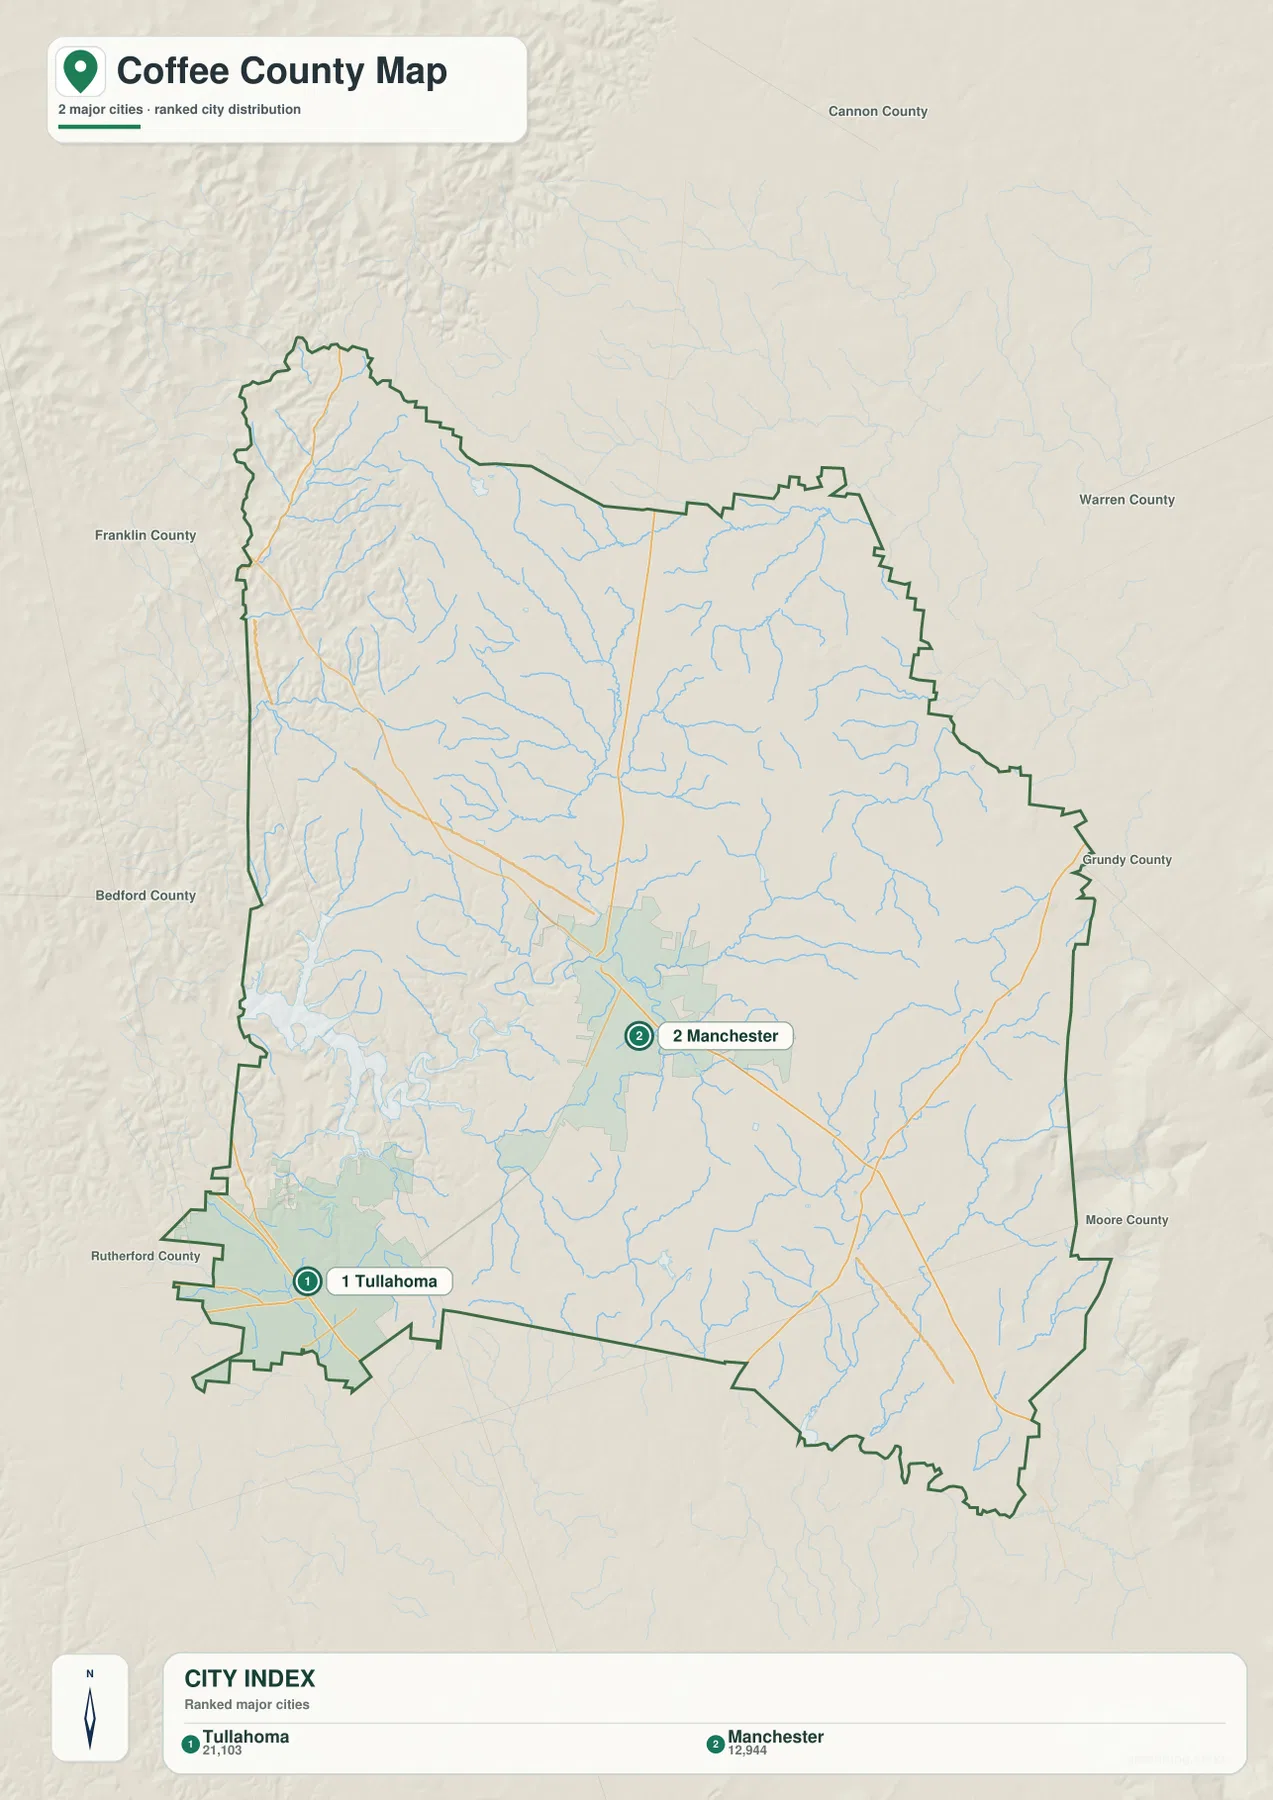
The city view intentionally reduces the number of labels and highlights Tullahoma and Manchester. Its city index ranks Tullahoma first with a displayed value of 21,103 and Manchester second with 12,944. Those figures belong to the city index supplied with this map and should not be confused with Coffee County’s total population. Their main value here is to reinforce the visual distinction between the larger southwest city label and the centrally located county seat.
Tullahoma is pressed against the southwest side of the county, whereas Manchester has more county territory around it in every direction. This difference matters when a reader tries to understand why local roads radiate differently from the two cities. Manchester connects naturally to New Union, Hillsboro, and the central road network. Tullahoma, by contrast, is tied closely to the southwest boundary and to the lakes and lower drainage country that dominate that part of the map.
The two-city view is also useful because it leaves the surrounding countryside uncluttered. Between the city markers are numerous streams, low ridges, and rural roads that become easier to see when extra place names are removed. A reader can first establish the position of the two cities, then return to the general map for route numbers and to the water map for the physical features that lie between them.
Duck River, Little Duck River, and the lakes of western Coffee County
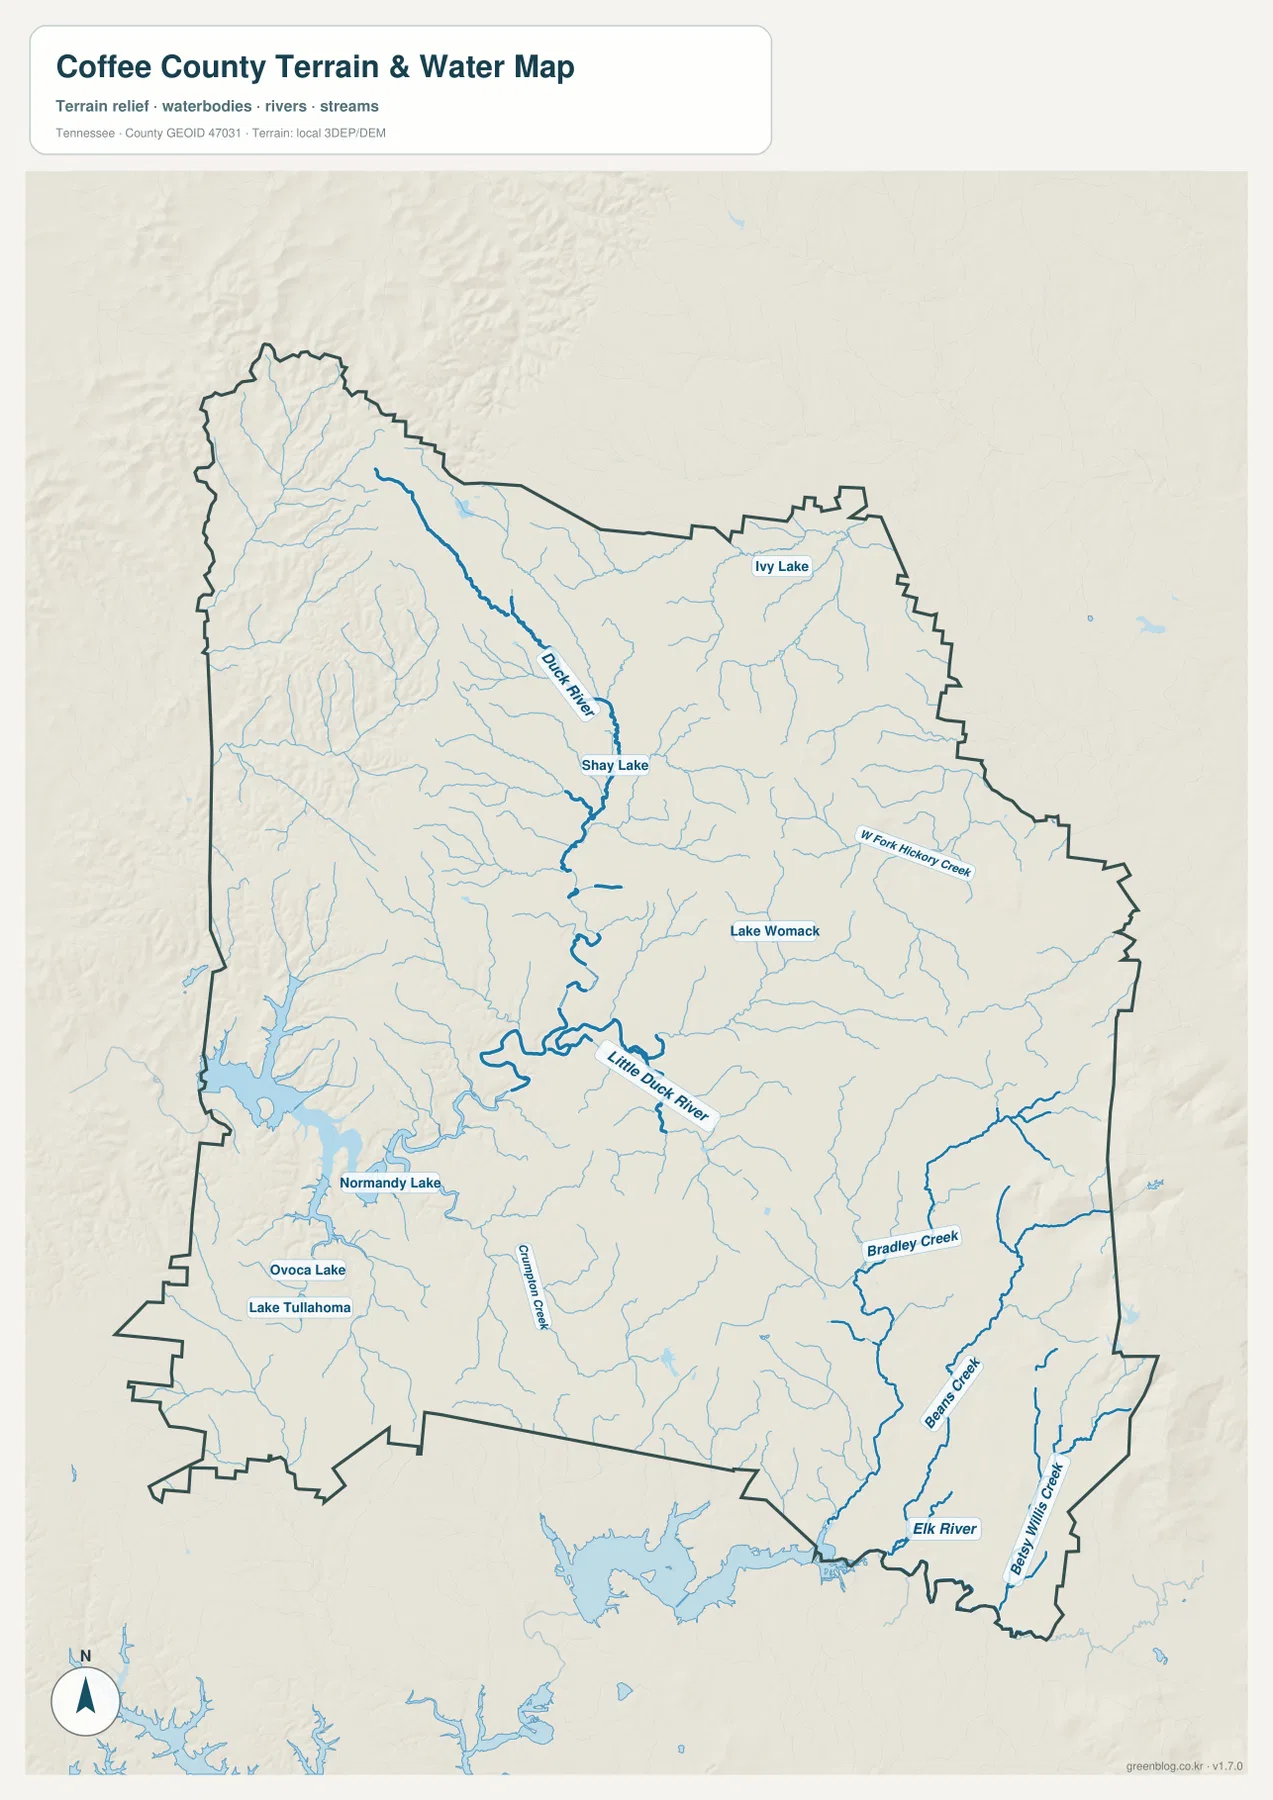
Duck River is the strongest named river feature on the water map. It enters from the northwest, passes the Shay Lake area, and continues toward the middle of the county. Little Duck River becomes prominent farther south, bending through the central-western area and connecting the Manchester side of the county with the broader drainage around Normandy Lake. The dense web of tributaries shows that the central landscape is cut by many small valleys even where the relief looks gentle at first glance.
Normandy Lake dominates the southwest water pattern. Ovoca Lake and Lake Tullahoma are shown nearby, while Shay Lake and Ivy Lake lie farther north and Lake Womack appears to the east. This distribution is useful because it prevents the county from being reduced to a single river-and-reservoir story. Several separate water bodies occupy different parts of the map, and each creates a distinct local reference point for nearby roads and communities.
The east and southeast contain a different set of named waterways. West Fork Hickory Creek, Bradley Creek, Beans Creek, and Betsy Willis Creek are visible there, while Elk River runs near the southern edge. Catoma Creek appears between the Tullahoma area and Normandy Lake. Following these labels from north to south helps explain how the county’s drainage changes from the Duck River system in the center and west toward the streams that leave the higher eastern and southern ground.
A 241–620 meter elevation range from low valleys to high edges
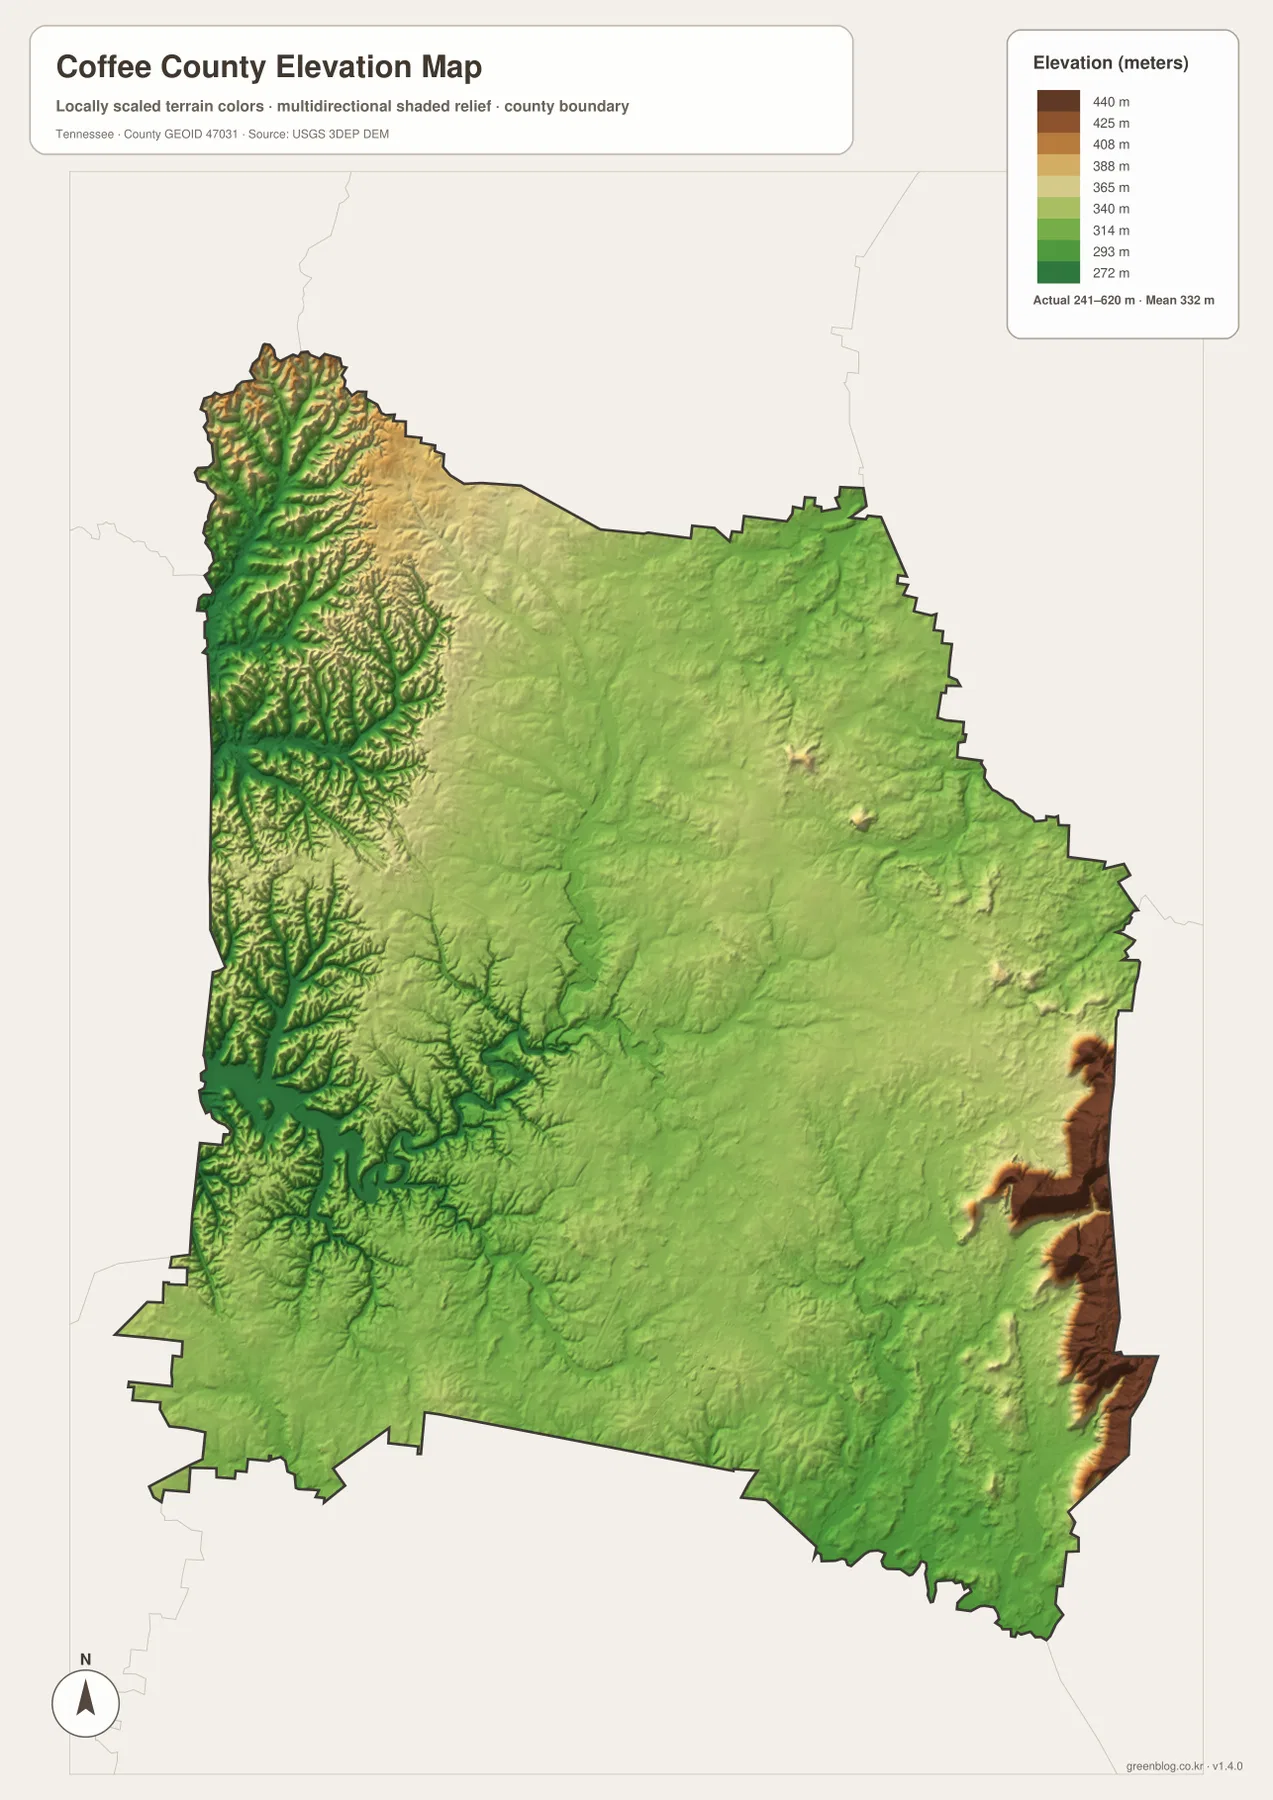
The elevation map reports an actual county range of roughly 241 to 620 meters and a mean elevation near 332 meters. Most of the broad central area is shown in green, indicating lower to moderate elevations. The Manchester area and the drainage country extending toward Normandy Lake fit within this lower landscape, which helps explain why the river network is so visible across the center and southwest.
The eastern boundary changes abruptly. Brown and tan relief colors mark much higher ground in several sections along the east side, while the narrow northwest extension also contains tightly folded ridges and valleys that stand above much of the county interior. These two high areas are separated by a large central zone that is comparatively subdued, so Coffee County does not have a simple west-to-east rise or a single continuous ridge.
Relief also clarifies the road pattern. Roads around Manchester can cross the central area in several directions, but routes approaching the higher east side or the ridged northwest have to work with more irregular terrain. The elevation image is not a parcel survey or a source for an exact spot height at a building, yet it is very effective for comparing the overall position of valleys, uplands, and steep county edges.
What changes when roads, rivers, and relief are compared together
The Manchester–Tullahoma relationship becomes more informative when the thematic maps are placed side by side. Manchester is a road hub near the middle of the county, but the southwest route toward Tullahoma approaches the Normandy Lake and Catoma Creek area. The water map therefore adds an explanation that is missing from the road-only view: the southwest contains a more complicated shoreline and drainage pattern than the open space between the city labels might suggest.
The southeast route toward Hillsboro has another character. The 41/2 corridor and Route 24 cross a part of the county drained by Bradley Creek, Beans Creek, and other streams, with higher terrain appearing near the eastern edge. That combination makes the southeast distinct from the lower lake country near Tullahoma. Readers comparing travel directions, school projects, or local geography can use the four images to separate these two sides of the county without crowding every feature onto one map.
The northwest extension deserves separate attention as well. Route 64 follows the narrow northern portion, where the elevation map shows more pronounced ridges and the water map shows tributaries feeding toward Duck River. The shape of that corner is easy to overlook on a small locator map, but it becomes a recognizable part of Coffee County once the boundary, relief, and drainage are considered together.
Population, area, and administrative context
The supplied Census-based material gives Coffee County a 2020 population of 57,889 and a July 2025 estimate of 62,419, an increase of about 7.8 percent between the two reported figures. The 2020 number is a decennial census count, while the later number is an estimate. Keeping those labels attached to the numbers is important when the map is used in a report or presentation.
The same material lists about 429.0 square miles of land and 5.6 square miles of water. Using the 2020 population and land area gives a countywide average near 135 people per square mile. That average is useful for scale, but the maps show why it cannot describe every part of the county equally: Manchester and Tullahoma are concentrated built areas, Normandy Lake occupies a broad water setting, and large rural sections contain far fewer mapped urban features.
Coffee County was established in 1836, and Manchester is identified as the county seat. That administrative fact is worth keeping next to the city map because the visually larger Tullahoma label can otherwise draw more attention. The distinction is simple: the city index emphasizes the two major city labels, while the seat designation identifies where county government is centered.
Choosing the best map for the question you have
Use the general county map when you need Manchester, Tullahoma, Hillsboro, New Union, the county boundary, and major route numbers in one view. The city map is better when the goal is simply to compare the two main urban labels without extra clutter. It is particularly clear for showing how close Tullahoma sits to the southwest boundary and how centrally Manchester is positioned.
The water map is the stronger choice for Duck River, Little Duck River, Normandy Lake, and the network of creeks. The elevation map adds the 241–620 meter relief range and makes the high eastern edge easy to distinguish from the lower center. Used together, the maps let a reader move from place names to physical geography without forcing roads, cities, hydrology, and elevation into one overloaded image.
The WebP images on the page are intended for convenient viewing. The ZIP below contains the matching county, city, water, and elevation maps as high-resolution JPG files, suitable for larger displays, A3-format printing, notes, and reuse in locally prepared materials.
If only one topic matters, there is no need to use every file. The general map works well for a location overview, the water map for rivers and lakes, and the elevation map for a terrain comparison. Keeping an untouched copy of the JPG while adding notes to a duplicate is also a practical way to reuse the same base map for more than one project.
Frequently Asked Questions
How are Manchester and Tullahoma positioned differently in Coffee County?
Manchester lies closer to the middle of the county and is the county seat, while Tullahoma is located against the southwest side. The city map makes that contrast especially clear. Returning to the general map then shows the different road connections around each city and the nearby county boundaries.
Where can I see Normandy Lake and Duck River most clearly?
The water map gives them the strongest emphasis. Normandy Lake spreads across the southwest, while Duck River and Little Duck River run through the central and western parts of Coffee County. Smaller lakes and creeks are labeled as well, so the map is useful for understanding the broader drainage network rather than locating only one water body.
What does the 241–620 meter range on the elevation map represent?
It is the actual elevation range reported for the county-wide elevation layer in the supplied map. The mean shown on the map is about 332 meters. The colors are best used to compare lower valleys and higher ridges across Coffee County; they are not a substitute for a site survey or an exact elevation measurement for a specific parcel.
Sources and reference data
County boundaries and geographic reference data can be checked against U.S. Census Bureau TIGER/Line, while population and area context is supported by U.S. Census Bureau QuickFacts and the Census Gazetteer materials included in the package.
For local water information, the package provides the Tennessee Wildlife Resources Agency Normandy Reservoir reference. General elevation data can be cross-checked through the USGS 3D Elevation Program. The descriptions on this page are limited to features visible in the supplied maps and facts contained in the accompanying Coffee County materials.
Map File Information
Download the Coffee County county, city, water, and elevation maps together as high-resolution JPG files.
- Included Files: County map, city map, water map, elevation map
- File Type: High-resolution JPG
Related Maps
Green Map creates custom-edited map images using open geographic data sources such as geoBoundaries, Natural Earth, OpenStreetMap, and government open data. These maps are edited visual materials, not raw data files, and are provided for education, documents, presentations, and graphic reference.