Holmes County is one of the clearer places in central Mississippi to see a major landscape change within a single county. The western side around Tchula and Cruger is broad, low, and crossed by old channels and lakes, while the ground rises into deeply cut hills around Lexington and farther east. Roads and towns sit differently on those two landscapes, so the maps are most useful when viewed as a set rather than as four interchangeable pictures.
This page explains the county boundary and road network, the distribution of six mapped towns, the main rivers and lakes, and the countywide elevation range. High-resolution JPG versions of the county, city, water, and elevation maps are available in the download box below, making it easy to save the files for printing, presentations, classroom work, or personal reference.
For scale, the 2020 Census population listed for Holmes County is 17,000, while the July 2025 estimate is 15,465. The 2025 Gazetteer lists 756.674 square miles of land and 7.942 square miles of water. Those figures help establish county size, but the strongest geographic story is visible directly on the maps: very low western ground changes quickly into a much rougher eastern upland.
Table of Contents
A county that changes from flat western lowlands to eastern hills
The general county map makes that transition easy to orient. Tchula sits in the western half, Lexington is near the middle but shifted eastward, and Durant lies close to the eastern edge. Goodman and Pickens continue the eastern line of settlements toward the south, while Cruger occupies the far northwestern lowland. The county boundary itself is also informative: the western side bends around older river features, while the long northern and southern edges are much straighter.
I-55 and US 51 form the most important north-south corridor on the eastern side. MS 12 provides an important cross-county connection between the Tchula side and Lexington, while MS 14 and MS 17 add other routes through the interior and southeast. This is not a street-level road map, but it clearly separates the eastern highway corridor from the more dispersed road pattern across the western lowland.
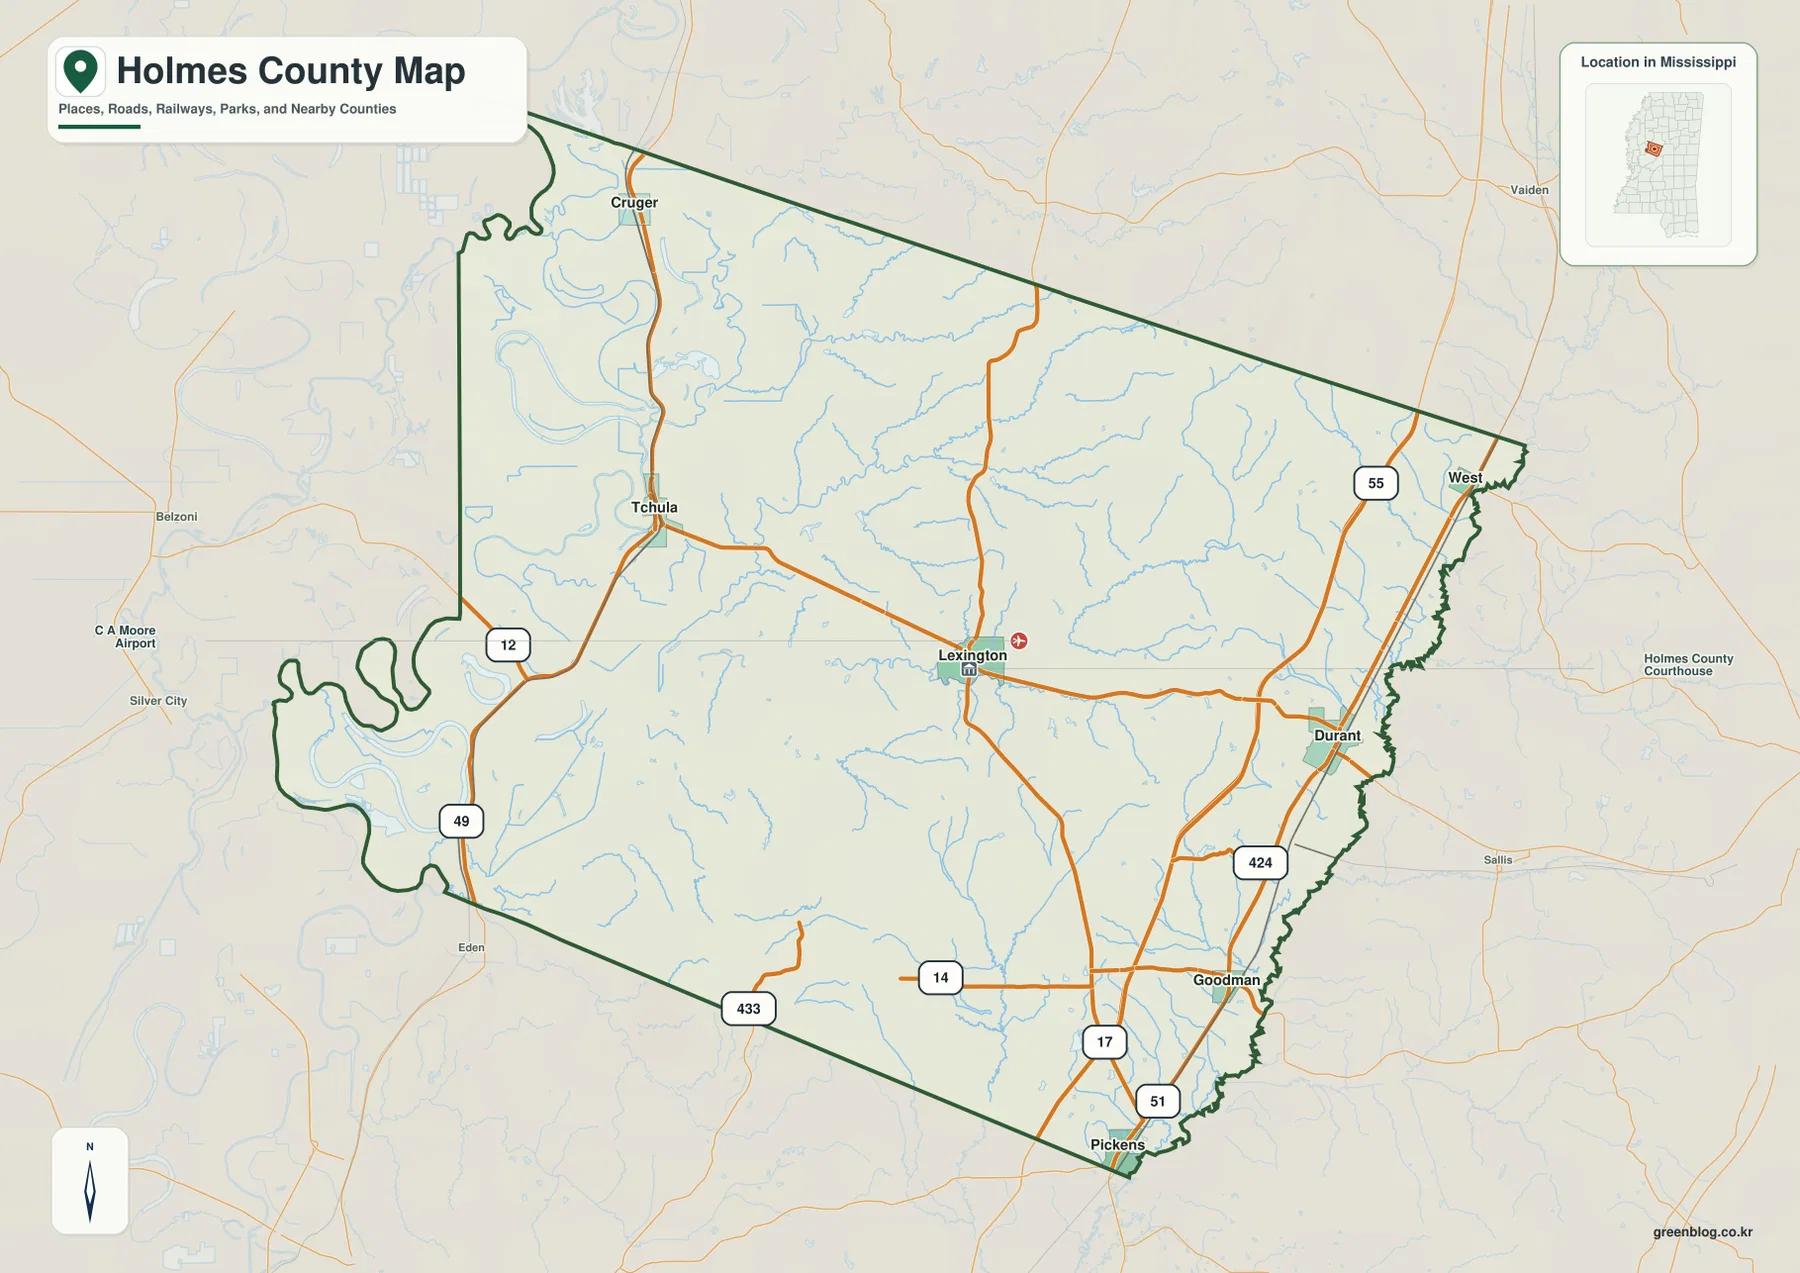
Neighbor labels provide another useful frame. Carroll and Leflore counties lie along the north, Attala and Leake are to the east, Madison is south of Holmes, and Yazoo and Humphreys counties border the west. Seeing those neighbors with the irregular western boundary helps explain why Holmes County feels different from a simple rectangular county when viewed on a statewide map.
Six mapped towns split between the lowland and highway sides
The city map ranks six major places and shows a pattern that is more useful than the ranking alone. The displayed figures are Durant 2,103, Tchula 1,802, Lexington 1,350, Goodman 1,177, Pickens 969, and Cruger 368. Durant, Goodman, and Pickens line up close to the eastern side of the county; Tchula and Cruger are well to the west. Lexington occupies the central transition zone and serves as the county seat.
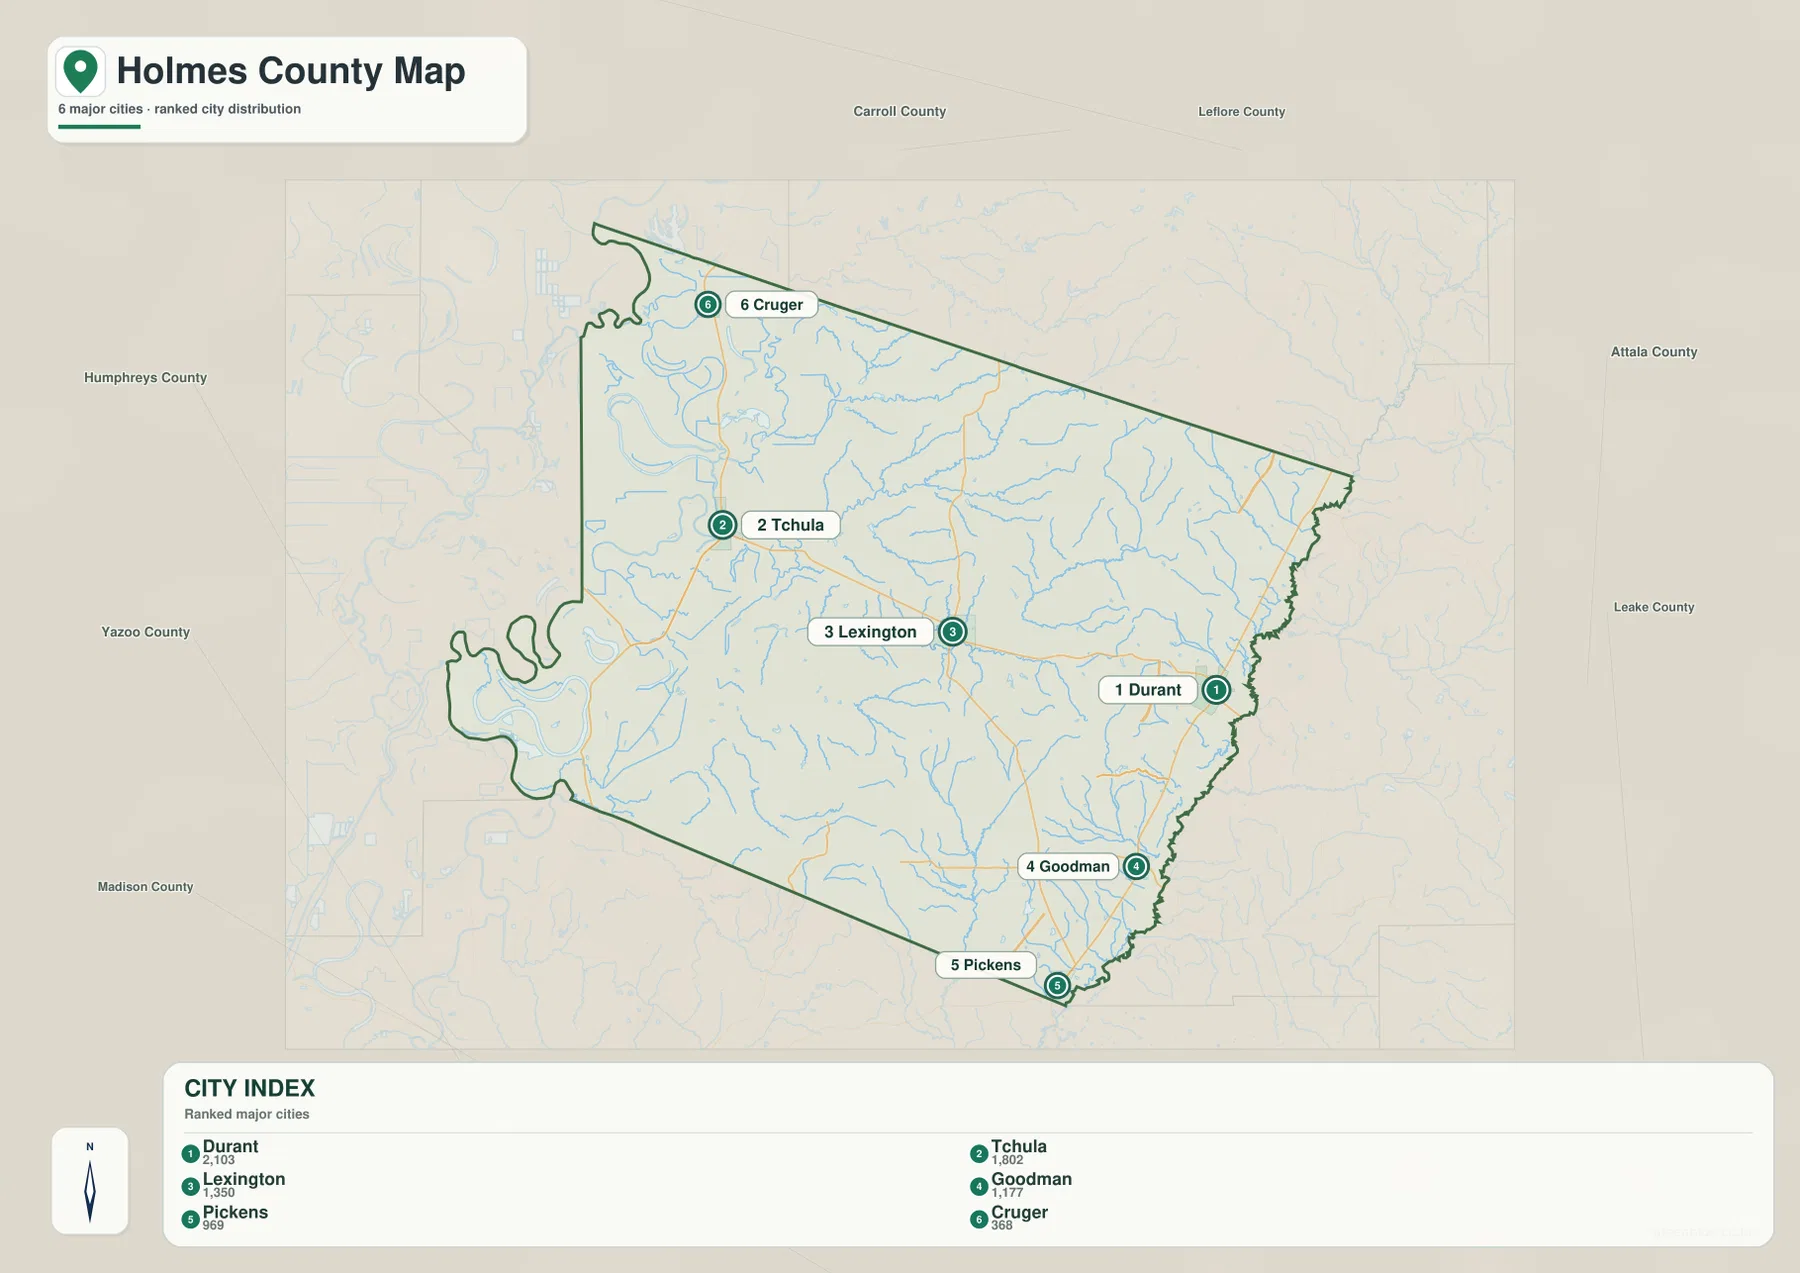
The ranking should not be confused with administrative status. Durant has the highest number in the city index, but Lexington remains the county seat. That distinction matters when using the map for practical orientation: Lexington is the better reference for county government and the middle of Holmes County, whereas Durant is more useful for understanding access to the I-55 and US 51 corridor.
Tchula and Cruger belong to a very different map setting. Their surroundings are flatter and contain more visible water features, so they are easiest to recognize when the city map is paired with the water or elevation map. Pickens and Goodman, by contrast, sit near narrow valleys and rolling ground on the eastern side. The county therefore has no single settlement pattern that describes every town equally well.
Old channels and lakes in the west, creeks and the Big Black River in the east
The water map gives the western side a distinctive appearance. Old River and Tchula Lake are labeled in the northwest, with Dollar Lake and Horseshoe Lake nearby. Farther south, Bee Lake and Bear Lake sit close to the irregular western boundary. These water bodies occupy the same broad lowland that appears as dark green on the elevation map, reinforcing the difference between the west and the hillier interior.
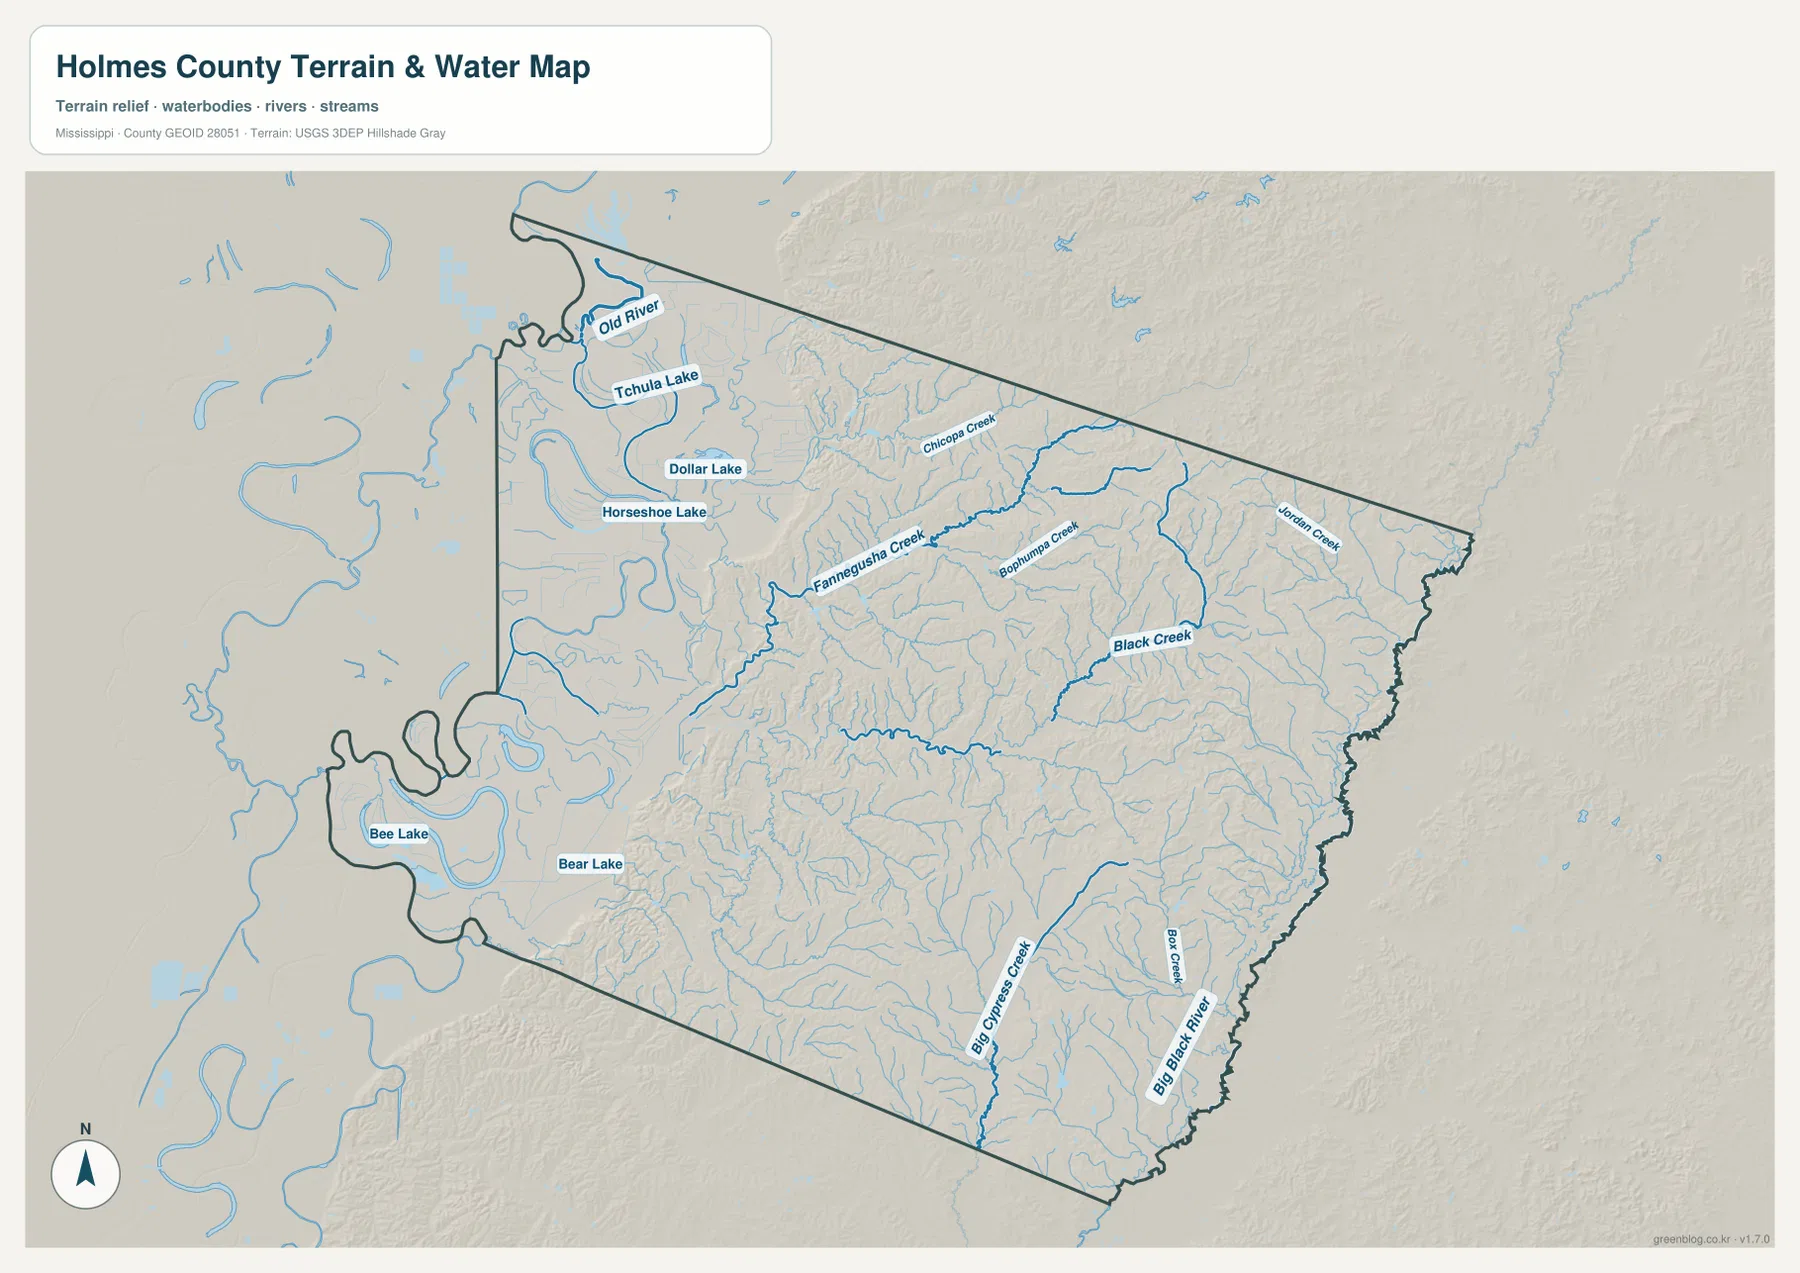
Moving eastward, the map changes from large curved water features to a dense network of smaller streams. Black Creek is prominent on the eastern side, while Fannegusha Creek and other tributaries cross the central hills. Big Cypress Creek and the Big Black River appear in the southeast. The contrast is useful because it shows two different kinds of drainage landscape within the same county: broad lowland channels in the west and many narrow creek valleys in the uplands.
This map is a location reference for rivers, lakes, and streams. It is not a flood-zone map, property survey, navigation chart, or statement about whether a particular road or parcel will flood. For those questions, use the official product designed for the specific decision rather than treating the water layer as a hazard map.
The 26–155 m elevation range explains the county’s sharp east-west contrast
The elevation map lists an actual county range of about 26 to 155 meters, with a mean of 75 meters. The broad western portion stays low and comparatively smooth. Near the middle of the county, that flat surface gives way to a much more dissected landscape, and the eastern half contains closely spaced ridges and valleys. The highest terrain is concentrated mainly in the eastern and northeastern uplands rather than around the low western lakes.
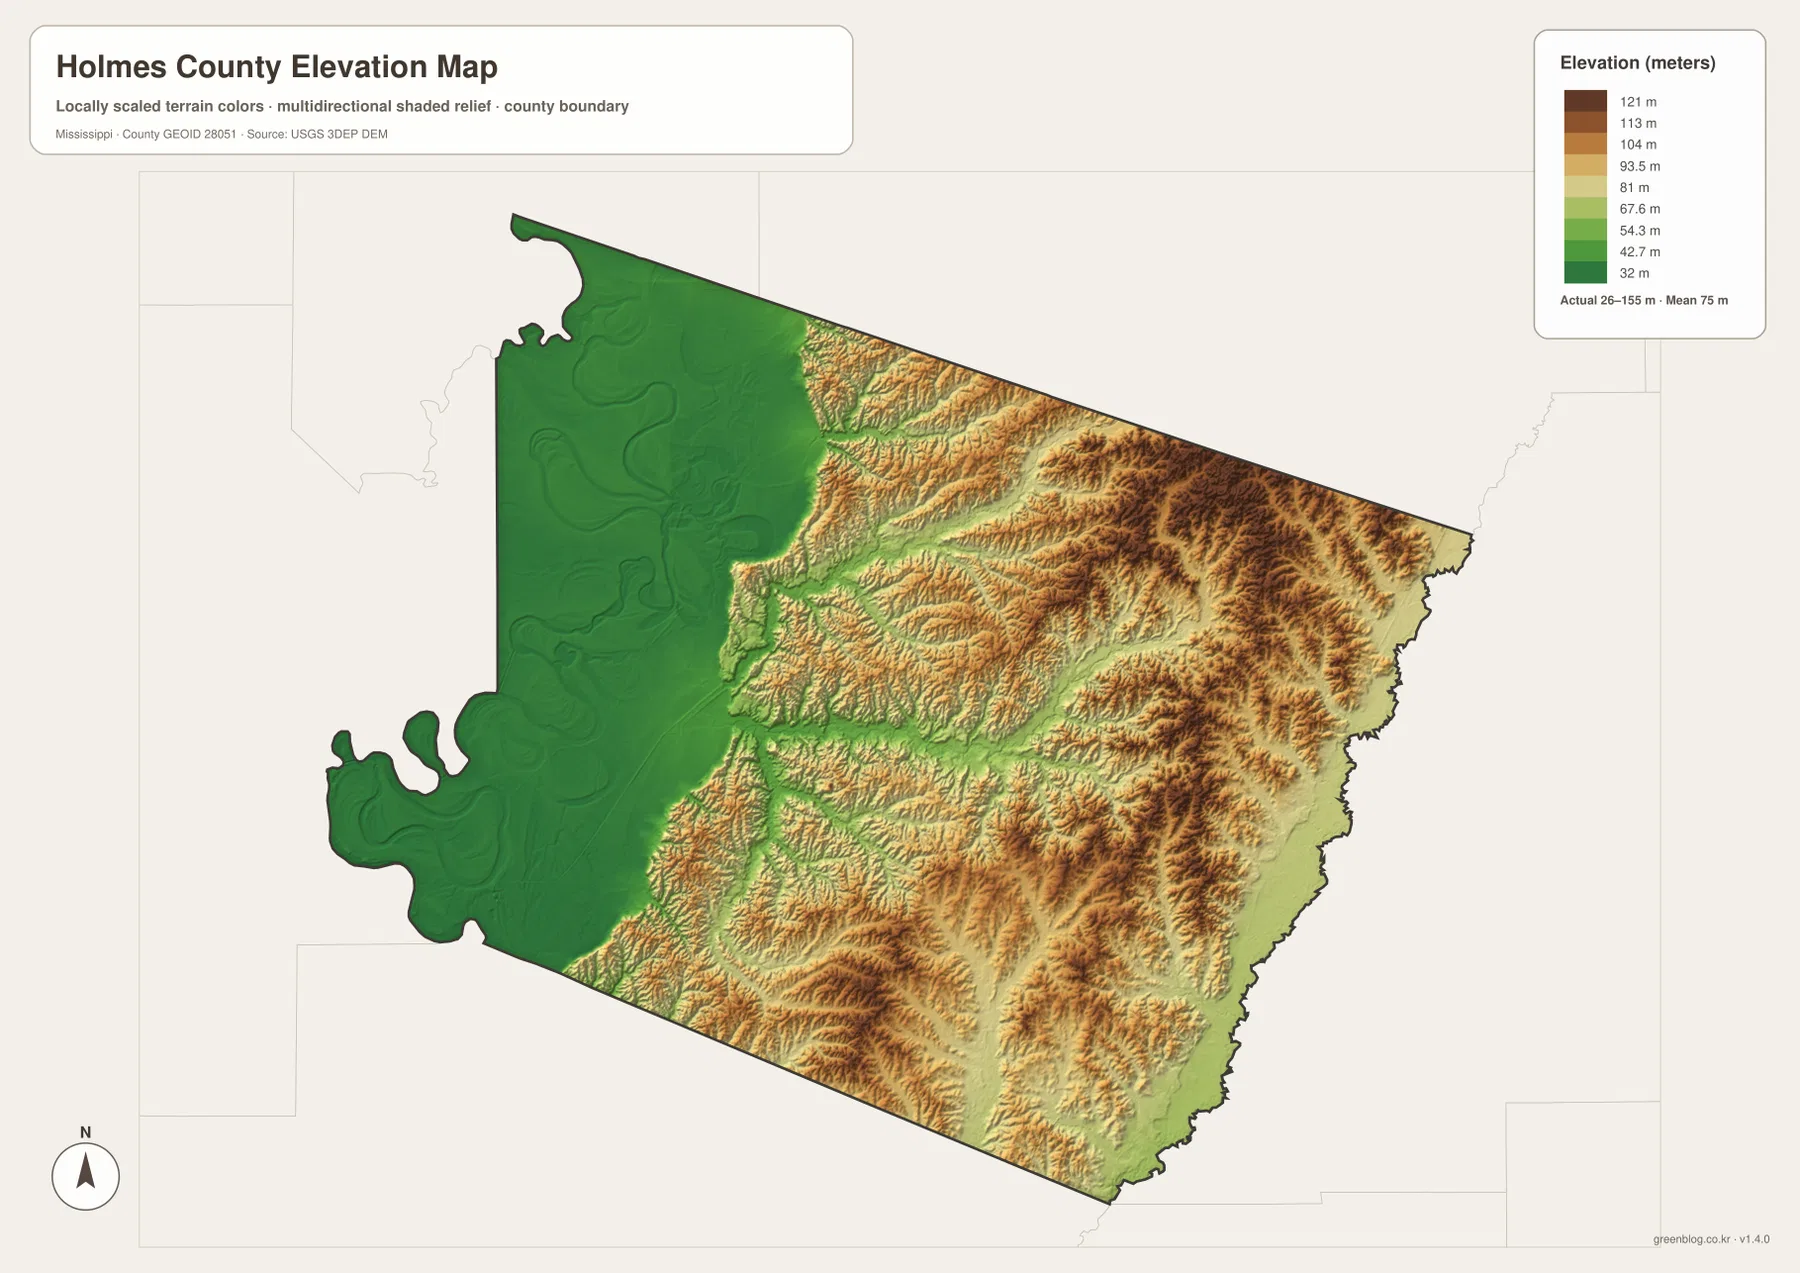
That terrain helps make sense of the town pattern. Tchula and Cruger sit on the low side, while Lexington lies close to the transition into rougher ground. Durant is surrounded by the eastern upland pattern, and the Goodman-Pickens area includes both low stream valleys and nearby ridges. When a town looks close to another place on the county map, the elevation layer adds important context about the land between them.
The elevation surface is intended for county-scale comparison. It should not be treated as a survey measurement for a building site, drainage design, or engineering project. If a precise point elevation is needed, the USGS 3D Elevation Program and site-specific survey information are better sources.
Choosing the map that matches the question
For a first look at Holmes County, start with the county map because it combines boundaries, major towns, and principal roads in one view. The city map is better when the question is where the six ranked towns sit relative to one another. Use the water map for Old River, Tchula Lake, Black Creek, the Big Black River, and the many smaller streams. The elevation map is the clearest choice when the main question is why western Holmes looks so different from the Lexington and Durant side.
- County orientation: use the boundary map for Lexington, Tchula, Durant, Pickens, I-55, US 51, and the main cross-county routes.
- Town comparison: use the city map to compare the six ranked places and their east-west distribution.
- Rivers and lakes: use the water map for Old River, Tchula Lake, Horseshoe Lake, Black Creek, and the Big Black River.
- Terrain: use the elevation map to compare the low western plain with the higher, more broken eastern hills.
The separation of these layers is useful when preparing a printout or presentation. A road-focused explanation does not need every creek label, and a terrain discussion is clearer when hill shading is not competing with city ranking labels. Downloading the original JPG files lets you choose the version that best fits the task instead of forcing all information into one crowded image.
Frequently Asked Questions
Why is western Holmes County much flatter than the Lexington side?
The west around Tchula and Cruger lies on the low side of the county, where Old River, Tchula Lake, and other curved water features are common. Elevation rises toward Lexington and the eastern half, where ridges and narrow valleys become much more prominent. The elevation map shows that shift directly across the middle of the county.
Durant ranks first on the city map, so why is Lexington the county seat?
The city index and county-seat status describe different things. Durant has the highest displayed city figure at 2,103, while Lexington is shown at 1,350. Lexington is still the county seat, so it remains the administrative reference point even though Durant ranks above it in the city index.
Can the water map be used as a flood-risk map?
No. The water map shows the location of named rivers, lakes, creeks, and other mapped water features. It does not show flood insurance zones, parcel boundaries, expected flood depth, or navigation conditions. Use the appropriate official hazard or property source for those decisions.
Map File Information
The ZIP contains high-resolution JPG versions of the county, city, water, and elevation maps shown on this page. Download the archive, extract it, and choose the file that matches your print, presentation, classroom, or reference task.
- Included Files: county, city, water, and elevation maps
Related Maps
Sources and References
- U.S. Census Bureau — Holmes County QuickFacts
- U.S. Census Bureau Gazetteer Files
- Mississippi Department of Transportation Official Highway Map
- USGS National Hydrography
- USGS 3D Elevation Program
- Mississippi Encyclopedia — Delta
Green Map creates custom-edited map images using open geographic data sources such as geoBoundaries, Natural Earth, OpenStreetMap, and government open data. These maps are edited visual materials, not raw data files, and are provided for education, documents, presentations, and graphic reference.