A high-resolution JPG ZIP download is available directly on this page. Clinton County, Indiana, is easiest to understand by starting with Frankfort and then looking outward. Frankfort sits a little west of the county’s center, where several important roads converge. Rossville and Mulberry are to the north and northwest, Michigantown is farther east, Kirklin lies in the southeast, and Colfax is near the southwest side. The water map shows branches of Wildcat Creek together with Prairie Creek, Sugar Creek, and smaller tributaries, while the elevation map spans about 192 to 307 meters. Lower ground is most noticeable toward the west and northwest, with broader higher ground to the east and southeast. The downloadable ZIP contains the same map set as high-resolution JPG files for closer viewing, printing, or offline reference.
Frankfort provides a practical reference point because the road pattern changes around it. State Road 28 runs east through the city, State Road 39 heads south, and State Road 75 approaches from the north. Farther east, State Road 29 forms another north–south line, while U.S. 421 is easy to find near the southeastern side of the county. U.S. 52 and I-65 appear near the southwest edge. Instead of treating these numbers as a list, it helps to connect each road with the places it passes or approaches, because that makes the spread of Clinton County’s settlements much easier to follow.
The terrain adds another layer to that road-and-town pattern. The northwest and western side contain broad areas of lower elevation, and several creek valleys cut through the center and north. By contrast, the eastern and southeastern parts of the county are shown in warmer elevation colors and rise well above the lowest valleys. With about 115 meters between the mapped low and high points, Clinton County is not simply one flat surface. The creek network and gradual eastward rise create visible local differences even though much of the landscape is gently rolling rather than mountainous.
Table of Contents
Frankfort gives the road network a clear center
The county map makes Frankfort the most useful place to begin. State Road 28 crosses the city and continues east toward State Road 29, while State Road 39 turns south from the Frankfort area. State Road 75 links the city with the northern part of the county. Once those three roads are located, the rest of the map becomes easier to organize: State Road 29 anchors the eastern side, U.S. 421 runs through the southeast, and State Road 38 passes close to Kirklin. This pattern explains why Frankfort stands out as the central road hub even though other towns are spread widely around the county.
The southwest has a different road pattern. U.S. 52 and I-65 cut across the edge at an angle rather than running through Frankfort, and Colfax sits near that corner of the county. Mulberry is much farther north and west, while Rossville is near the northern boundary. State Road 26 runs east–west near the top of the county, so northern trips are easier to understand by using that road as a reference instead of tracing everything back through downtown Frankfort.
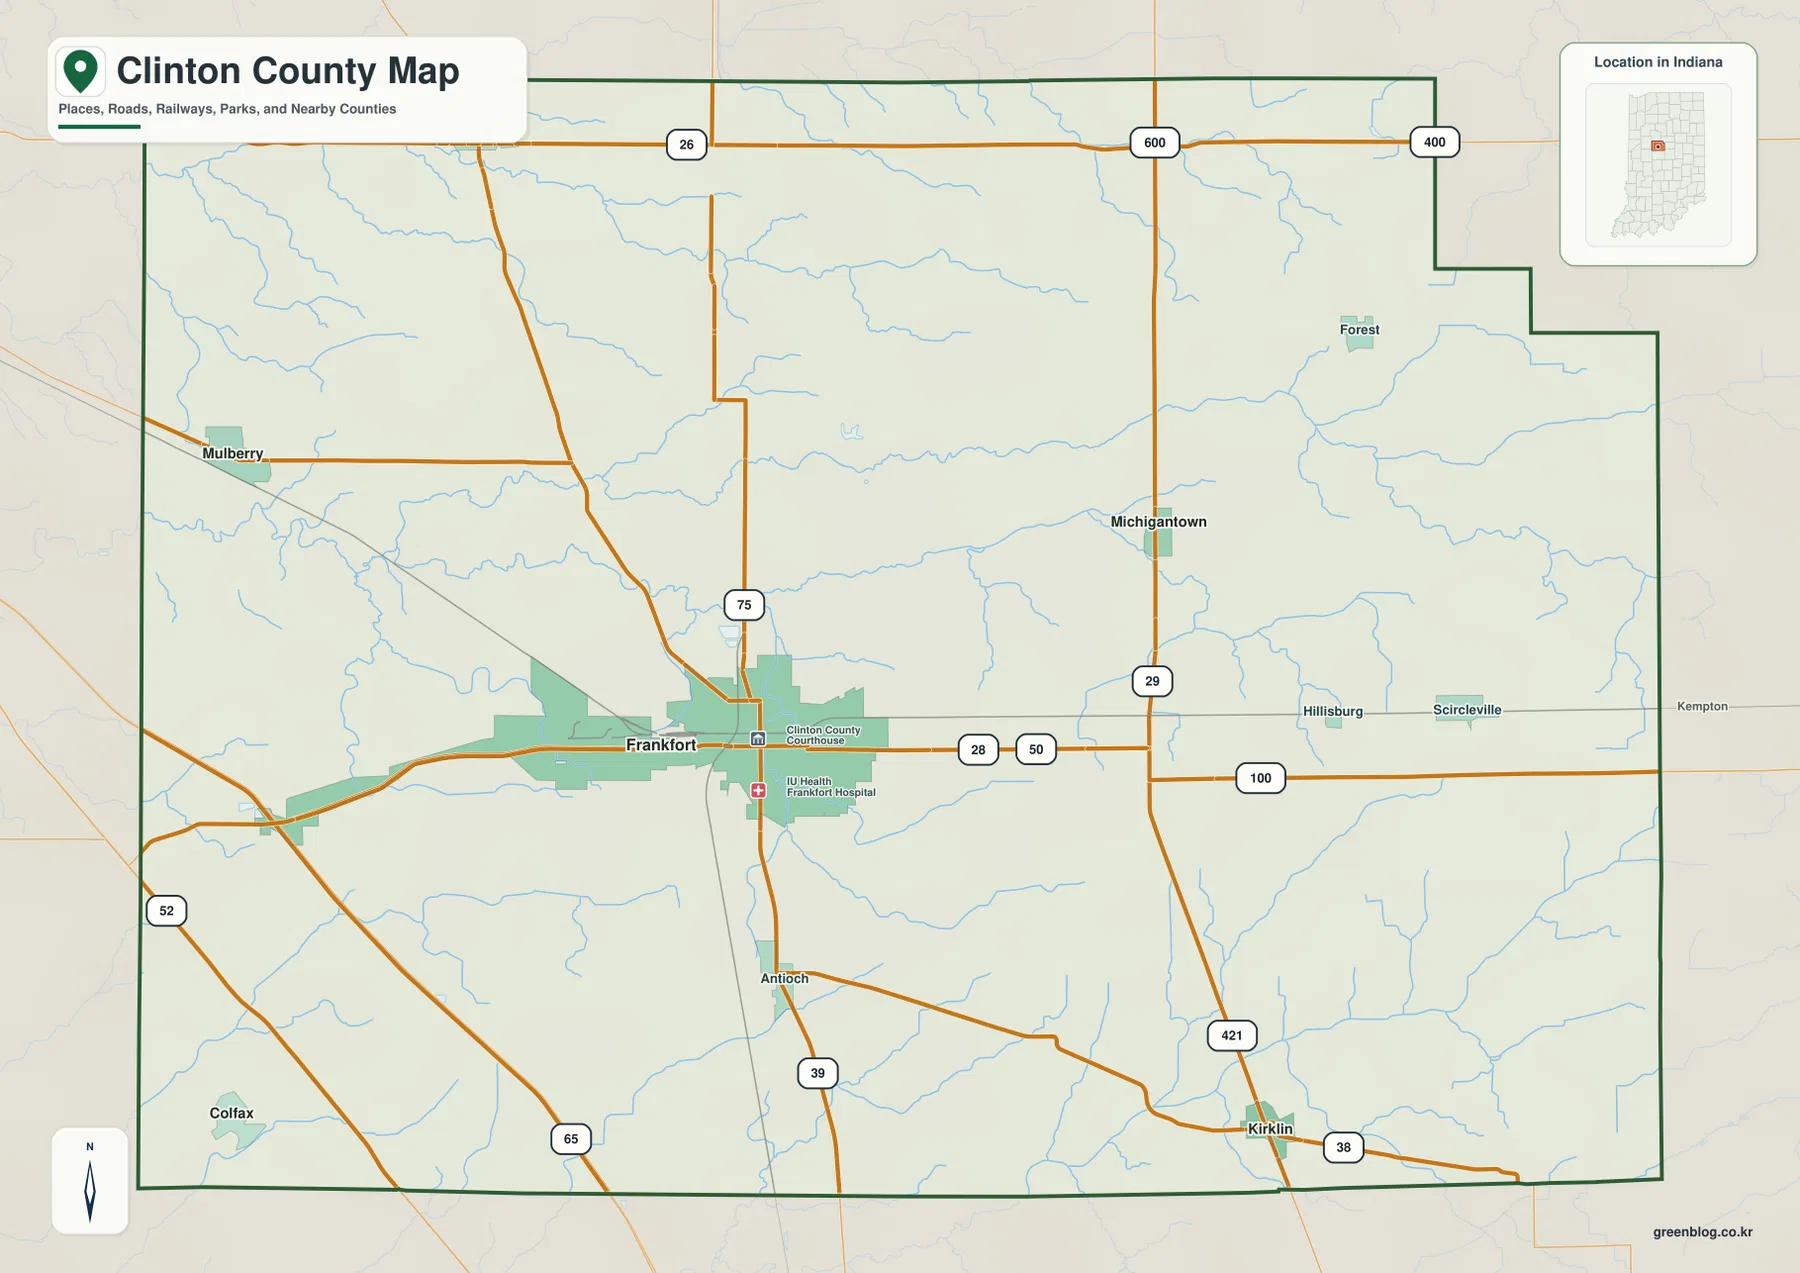
The county outline also matters. Much of the north and west boundary is fairly straight, but the northeast and east side step inward and outward several times. That irregular edge changes how the northeastern area fits around Michigantown and the higher eastern terrain. The general map is useful because it keeps those boundary changes, roads, settlements, and streams visible together instead of separating them into different layers.
Six main communities are spread around Frankfort rather than packed into one corridor
The city-distribution map highlights Frankfort, Rossville, Mulberry, Kirklin, Colfax, and Michigantown. Frankfort occupies the central position, but the other five points are widely separated. Rossville is near the north, Mulberry is northwest, Michigantown is east, Kirklin is southeast, and Colfax is southwest. That arrangement gives Clinton County a ring-like settlement pattern around its county seat rather than a single straight chain of towns.
The City Index also makes the difference in community size obvious. Frankfort is shown as by far the largest place, followed by Rossville and Mulberry, with Kirklin, Colfax, and Michigantown appearing as smaller centers. The map should not be treated as a detailed population-analysis graphic, however. Its main value is positional: it shows how far apart the communities are and which direction each one lies from Frankfort. That information becomes especially useful when the city map is compared with the road map.
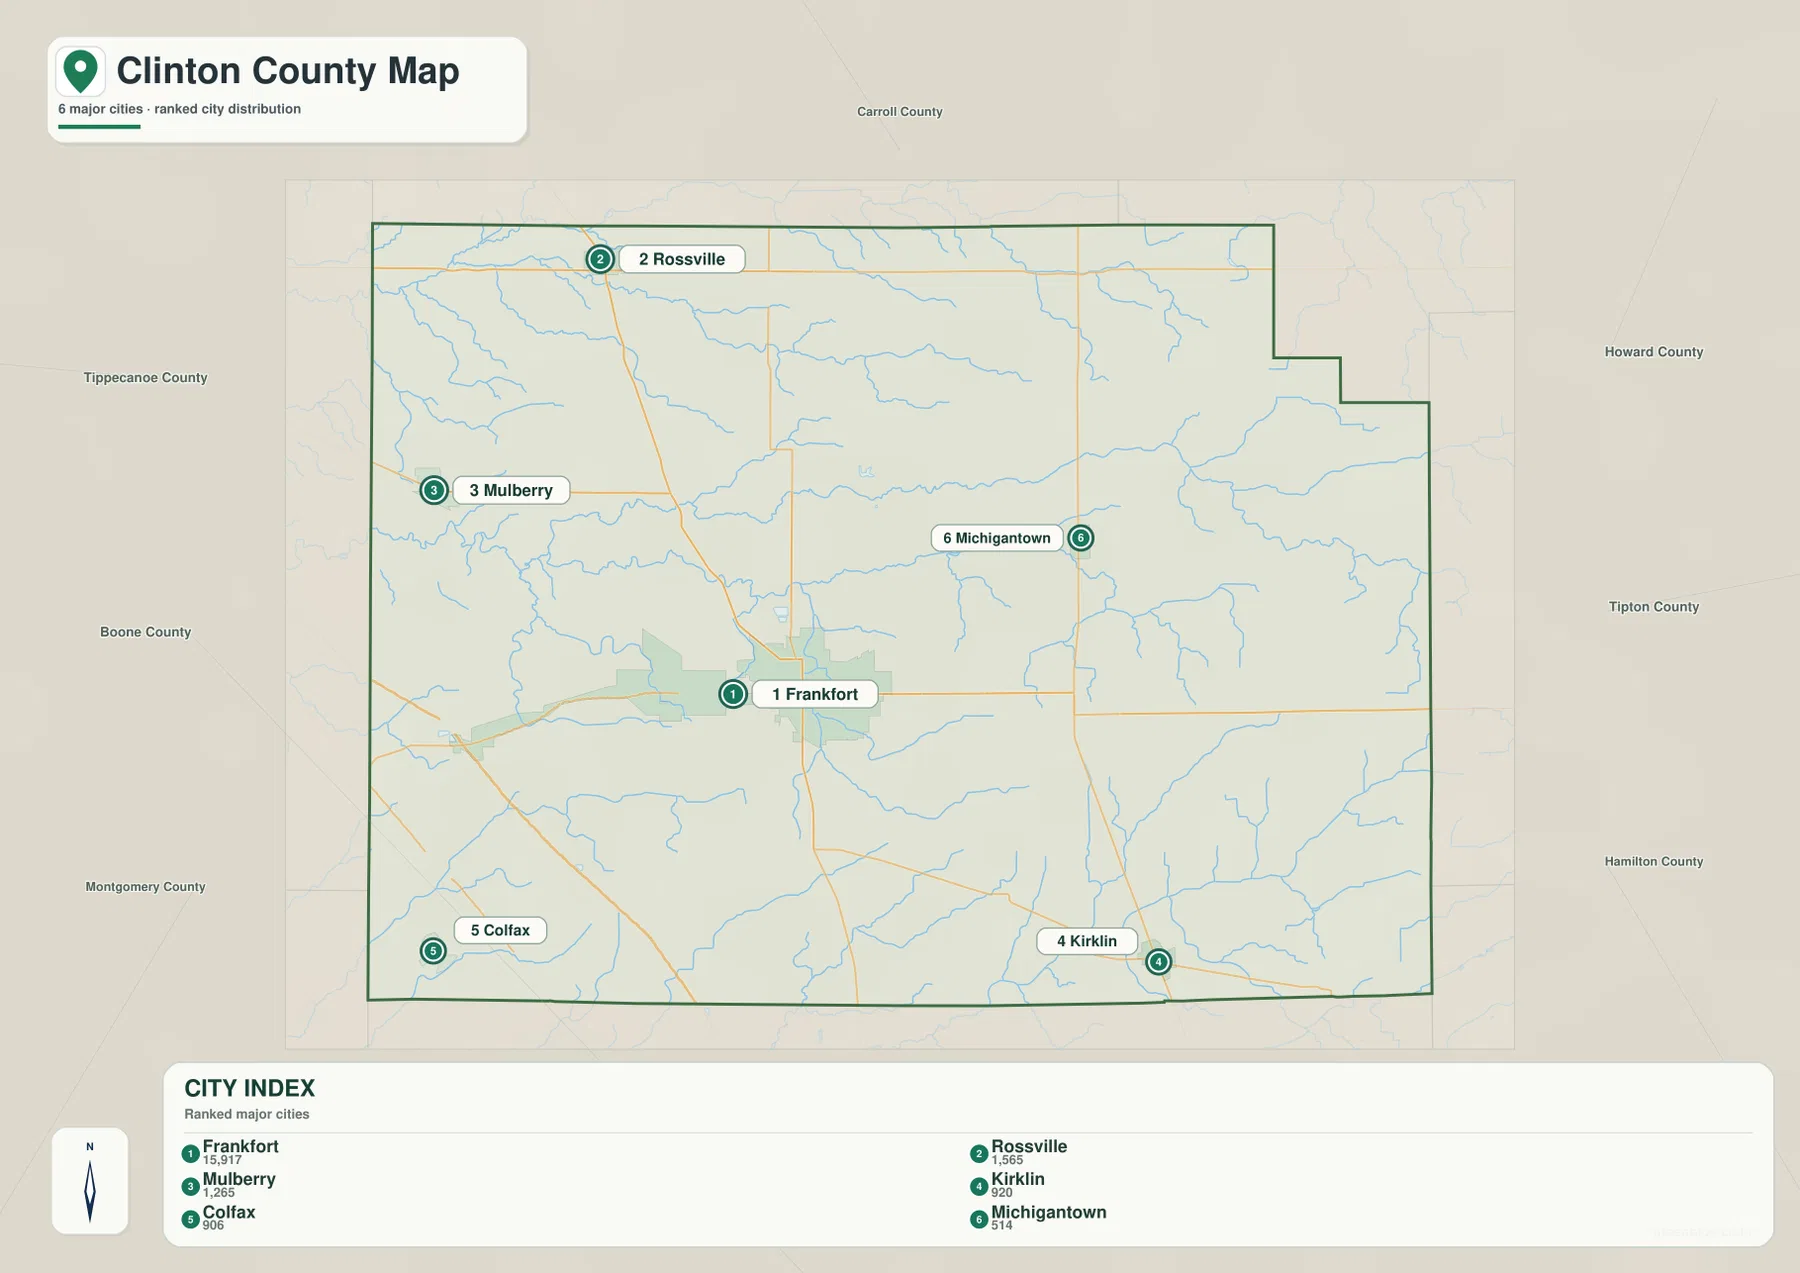
Putting the two maps together reveals why different roads matter in different parts of the county. Michigantown aligns naturally with State Road 29, Kirklin is close to U.S. 421 and State Road 38, and Frankfort is tied to the SR 28–SR 39–SR 75 cluster. Mulberry and Rossville belong to the northern side of the county, where State Road 26 and local connecting roads become more important. Colfax sits far enough southwest that the angled U.S. 52 and I-65 corridor becomes part of its broader orientation.
Wildcat Creek branches shape the lower northern and central valleys
The terrain-and-water map is dominated by the Wildcat Creek system rather than by one large river. Middle Fork Wildcat Creek appears in the north, while South Fork Wildcat Creek crosses the central part of the county and continues toward the west. Kilmore Creek follows a broad east–west route between them. Smaller named waterways such as Campbells Run, Chico Run, and Swamp Creek feed into the same general drainage network, giving the northern half of Clinton County a closely connected web of creeks.
South of that network, Prairie Creek curves through the central-southern area. Little Potato Creek appears toward the southwest, while Sugar Creek runs near the southeastern boundary. The map also labels Scott Wincoop Ditch and other smaller drainage features. These straight or partly straight channels sit alongside natural creeks, which is useful context in a county where agricultural drainage is visible on the map. The combination of tributaries and drainage channels is much easier to see here than on the general road map.
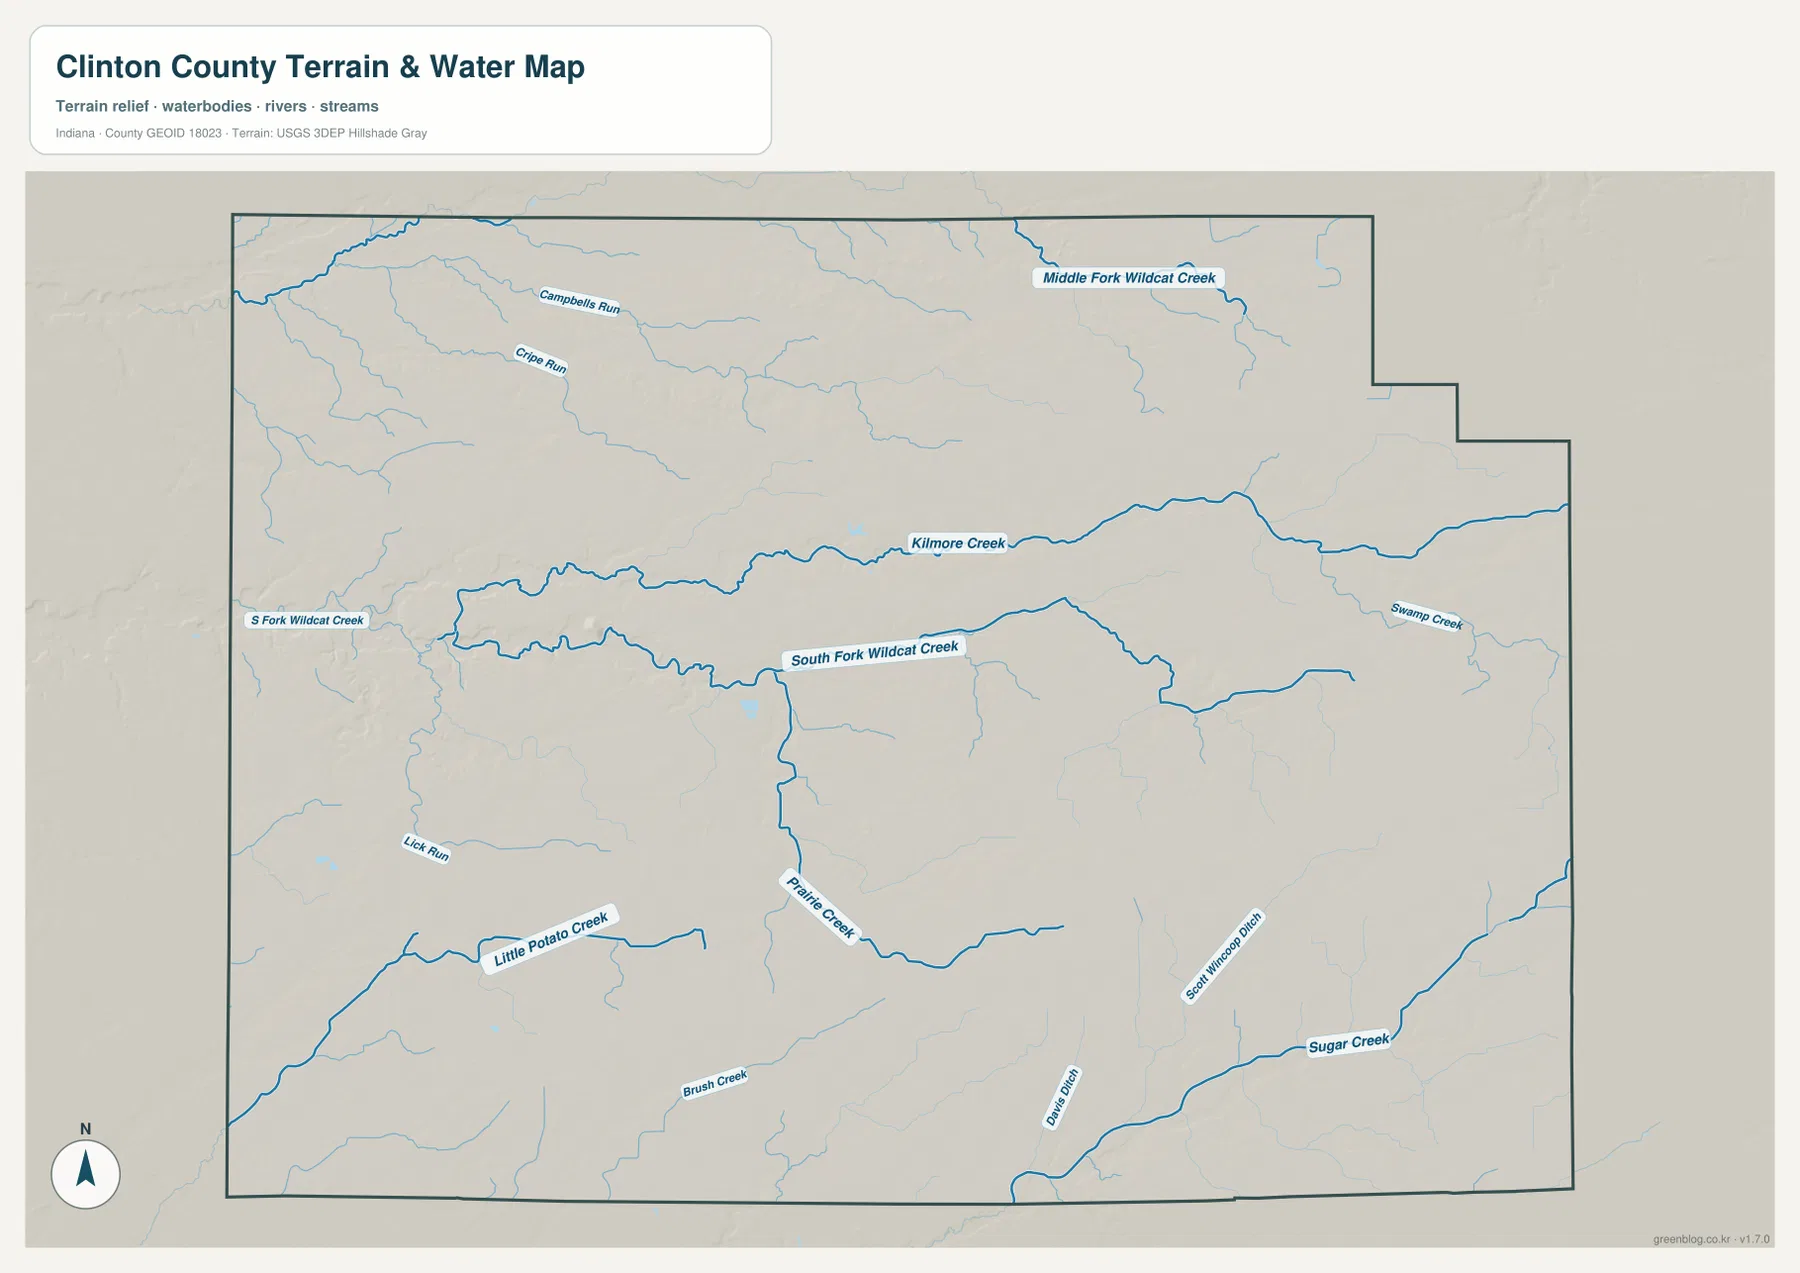
This map is best used for orientation rather than legal or engineering decisions. It shows where named creeks and drainage features are located, but it does not establish flood zones, water depth, navigability, property boundaries, or current field conditions. Small ditches and tributaries can also change in appearance by season or maintenance condition. Flood-risk, construction, drainage-design, or property questions should be checked against the appropriate official datasets and site-specific information.
The 192–307 m elevation range rises noticeably toward the east and southeast
The elevation map gives an actual range of about 192 to 307 meters, with a mean near 260 meters. The lowest greens are concentrated on the western and northwestern side, and lower corridors also follow parts of the creek system. West of Frankfort, the terrain drops into a broad green zone, while narrow low bands extend inland along tributaries. Those bands line up well with the water map and make it easier to see how stream valleys cut into otherwise gently rolling ground.
Higher ground becomes more extensive east of the county center. The area around and east of Michigantown is mostly shown in yellow, orange, and brown shades, and the southeastern side near Kirklin also rises above the western lowlands. The higher colors do not form one smooth plateau. Small drainage lines continue to carve shallow valleys through the eastern terrain, so the surface is better understood as broad higher ground broken by local creek channels.
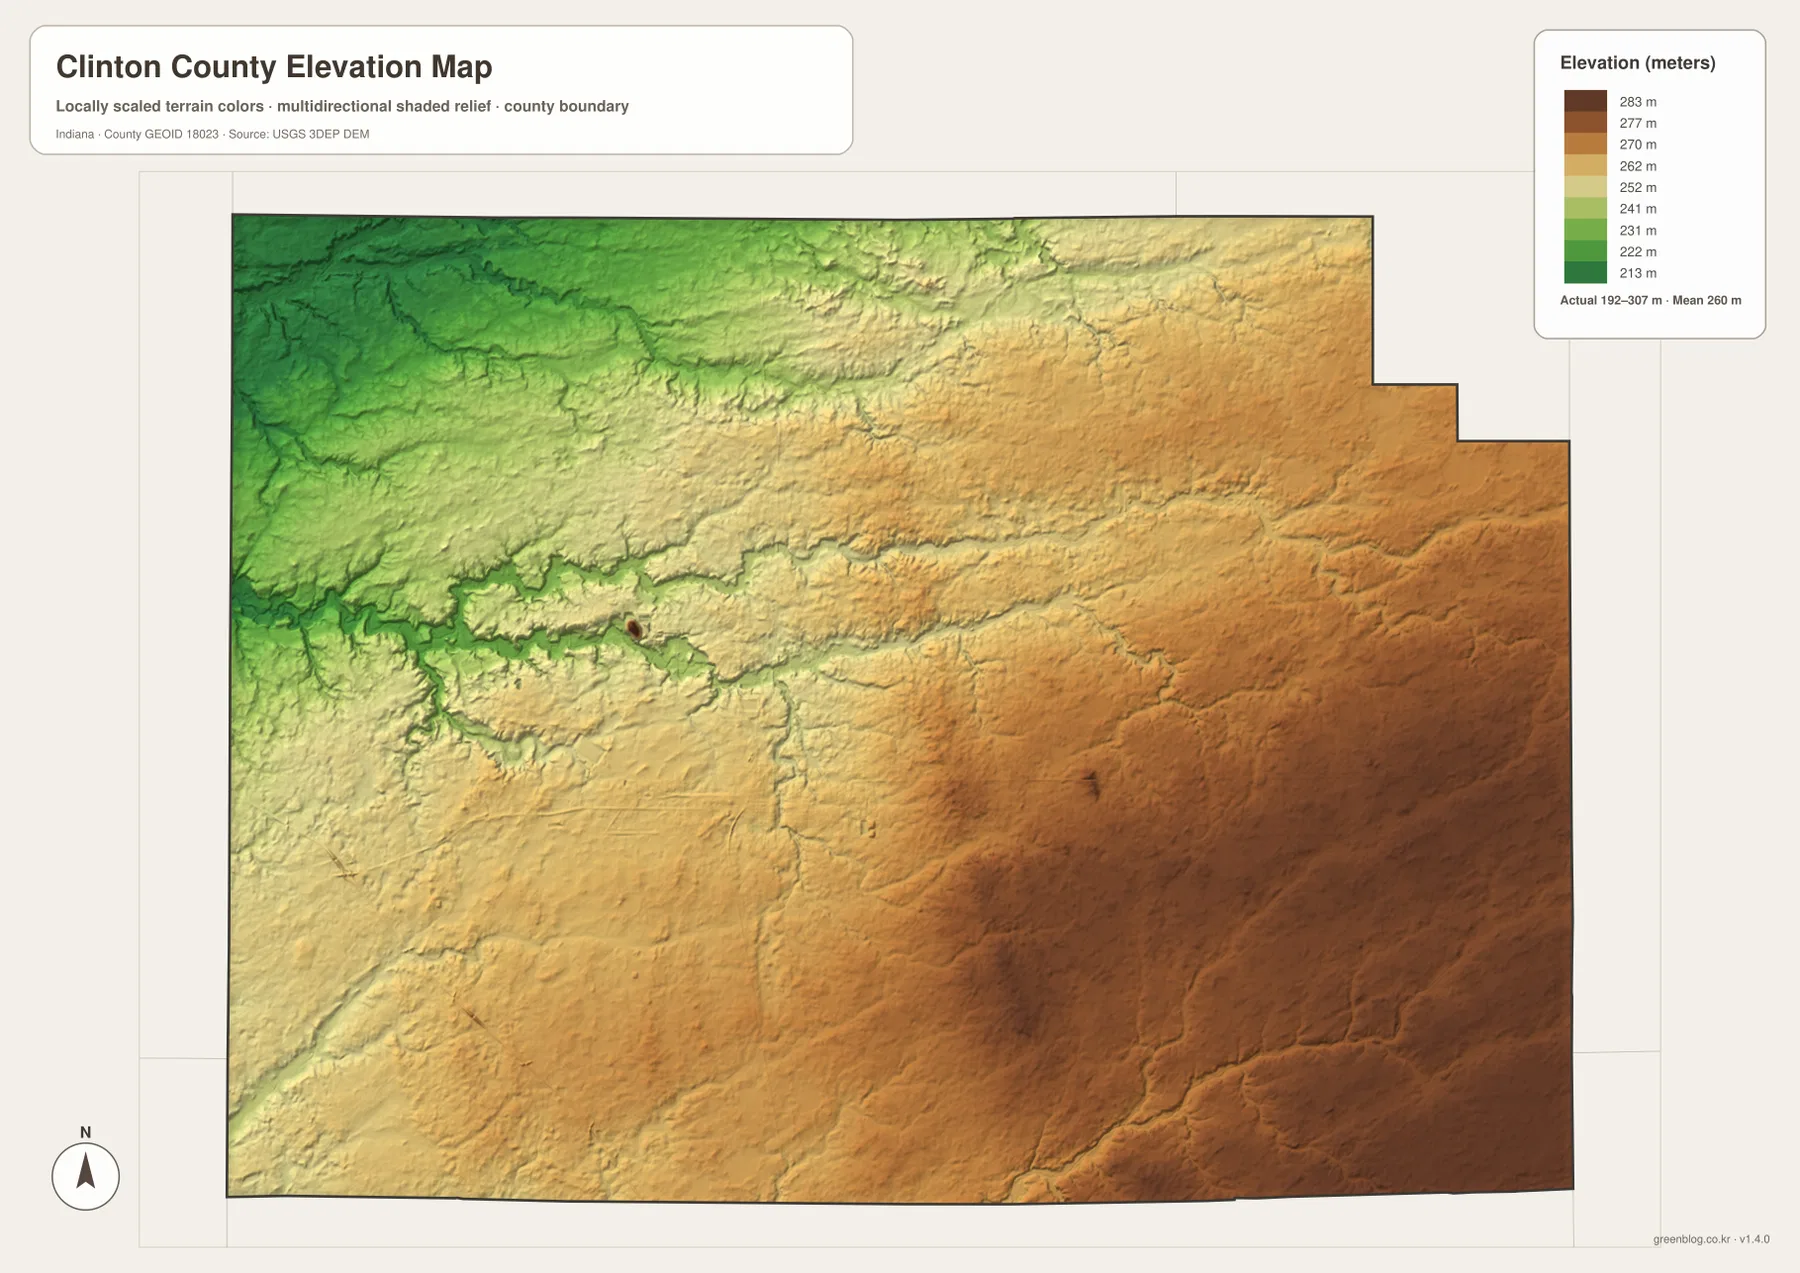
The colors are intended for county-scale comparison, not survey work. Elevation can vary within a single color band, and small embankments, roadside cuts, drainage works, and individual building sites are simplified at this scale. For engineering, construction, drainage, or precise site measurements, use the underlying USGS elevation data or professional survey information. Here, the map is most useful for understanding the broad difference between the lower Wildcat Creek valleys and the higher eastern half of the county.
A simple viewing order connects towns, roads, water, and relief
For a first look at Clinton County, start with the city-distribution map to place Frankfort and the five outlying communities. Then switch to the general county map to see which roads connect those locations. From Frankfort, SR 28 makes the east–west direction obvious, while SR 29 and U.S. 421 help organize the eastern side. Mulberry, Rossville, Colfax, and Kirklin each sit on different edges of that network, so the general map fills in the travel context that the simplified city map intentionally leaves out.
If the goal is to understand the landscape, begin with South Fork Wildcat Creek and Prairie Creek on the water map and then find the same areas on the elevation map. The broad lower zones and narrow valley bands align with those waterways, while the east and southeast hold more of the higher terrain. Comparing the two maps makes the county’s relief much clearer than looking at elevation colors alone.
The WebP images in the article are reduced for fast web viewing. If you want to enlarge road numbers, read smaller creek labels, compare boundary details, or print the maps, the ZIP below contains the original high-resolution JPG versions. Each image measures 3638 × 2572 pixels, and the set includes the general county map, city-distribution map, terrain-and-water map, and elevation map.
Choose the high-resolution file by the question you need to answer
The four JPG files show different parts of the county story. Use the general map when you need roads, towns, boundaries, and streams in one view. Use the city-distribution map when the spacing among Frankfort, Rossville, Mulberry, Michigantown, Kirklin, and Colfax matters more than road detail. The terrain-and-water map is the best choice for named creeks and drainage features, while the elevation map gives the clearest comparison between lower western valleys and higher eastern ground.
For local background, the official Clinton County history page explains the county’s formation in 1830 and the choice of Frankfort as the county seat. The Clinton County Historical Society provides additional local history, while the Census Bureau and USGS sources below support the boundary, hydrography, and elevation context used for the map set. These maps are intended for geographic orientation and downloadable reference, not as replacements for parcel records, flood determinations, or survey-grade measurements.
Frequently Asked Questions
Which map is the quickest way to place Rossville, Mulberry, Michigantown, Kirklin, and Colfax around Frankfort?
Start with the city-distribution map. It places Frankfort as the main reference point, with Rossville to the north, Mulberry to the northwest, Michigantown to the east, Kirklin to the southeast, and Colfax to the southwest. Then use the general county map to connect those places with SR 28, SR 29, U.S. 421, and the rest of the road network.
Why are the Wildcat Creek corridors lower on the elevation map?
Creeks commonly occupy lower valleys, and that relationship is visible across Clinton County. South Fork Wildcat Creek and nearby tributaries line up with lower green bands, especially toward the west and northwest. Comparing the terrain-and-water map with the elevation map makes those valley corridors much easier to recognize.
What files are included in the downloadable Clinton County ZIP?
The ZIP contains high-resolution JPG versions of the same map types shown in the article: the general county map, city-distribution map, terrain-and-water map, and elevation map. Each JPG is 3638 × 2572 pixels, which is better suited to zooming and printing than the reduced web images.
Map File Information
Download the Clinton County map set as high-resolution JPG files for closer viewing, printing, or offline reference.
- File Type: JPG
Related Maps
Sources and references
- Clinton County, Indiana — official history and county information
- Clinton County Historical Society & Museum — local history
- U.S. Census Bureau TIGER/Line Shapefiles — county boundaries, roads, and places
- USGS National Hydrography — rivers, streams, and drainage data
- USGS 3D Elevation Program — elevation and terrain data
Green Map creates custom-edited map images using open geographic data sources such as geoBoundaries, Natural Earth, OpenStreetMap, and government open data.
These maps are edited visual materials, not raw data files, and are provided for education, documents, presentations, and graphic reference.