Bartholomew County is easiest to understand by starting with Columbus. The county seat sits near the center of the mapped road and river network, while Interstate 65 and U.S. 31 create a strong north-south framework around it. The maps on this page show that transportation pattern, the smaller communities spread around Columbus, the river system that converges through the central lowlands, and an elevation range of about 158 to 309 meters. High-resolution JPG versions of all four maps are available together in the ZIP download below.
The official Bartholomew County website describes the county as covering about 409 square miles, with Columbus serving as the county seat and much of the county lying in the comparatively level area around the East Fork of the White River and its tributaries. That description matches the map pattern well. Columbus occupies the broad middle of the county, the largest roads concentrate there, and several rivers and creeks approach the same central zone from different directions. The western edge, however, is a very different landscape, climbing rapidly into much higher and more dissected terrain.
The most useful pattern to keep in mind before reading farther is the contrast between a heavily connected center and a much rougher western edge. Roads and settlements converge on Columbus, while the river and elevation views explain why the central corridor is broad and low and why the landscape changes so quickly toward the west. The separate maps isolate these relationships without forcing every label onto one crowded page.
Table of Contents
Columbus anchors a road network that spreads in every direction
On the general map, Columbus is clearly the main point of orientation. The built-up area is the largest on the page, and several county landmarks are labeled around it, including the Bartholomew County Courthouse, Columbus Regional Hospital, and Ivy Tech Community College. Interstate 65 passes to the west of the city and continues north toward Taylorsville and the Edinburgh area, while U.S. 31 also provides a north-south route through the northern part of the county. State Road 46 forms one of the most obvious east-west lines through the Columbus area.
East of Columbus, the road pattern becomes more dispersed. Hope sits in the northeast near the State Road 9 corridor, Hartsville is farther east, and Elizabethtown lies southeast of the county seat. The map also shows Newbern between the Columbus area and the eastern edge. South of Columbus, State Road 11 and the I-65 corridor continue toward Jonesville, helping explain why the county’s settlement pattern stretches well beyond the central city rather than forming one continuous urban block.
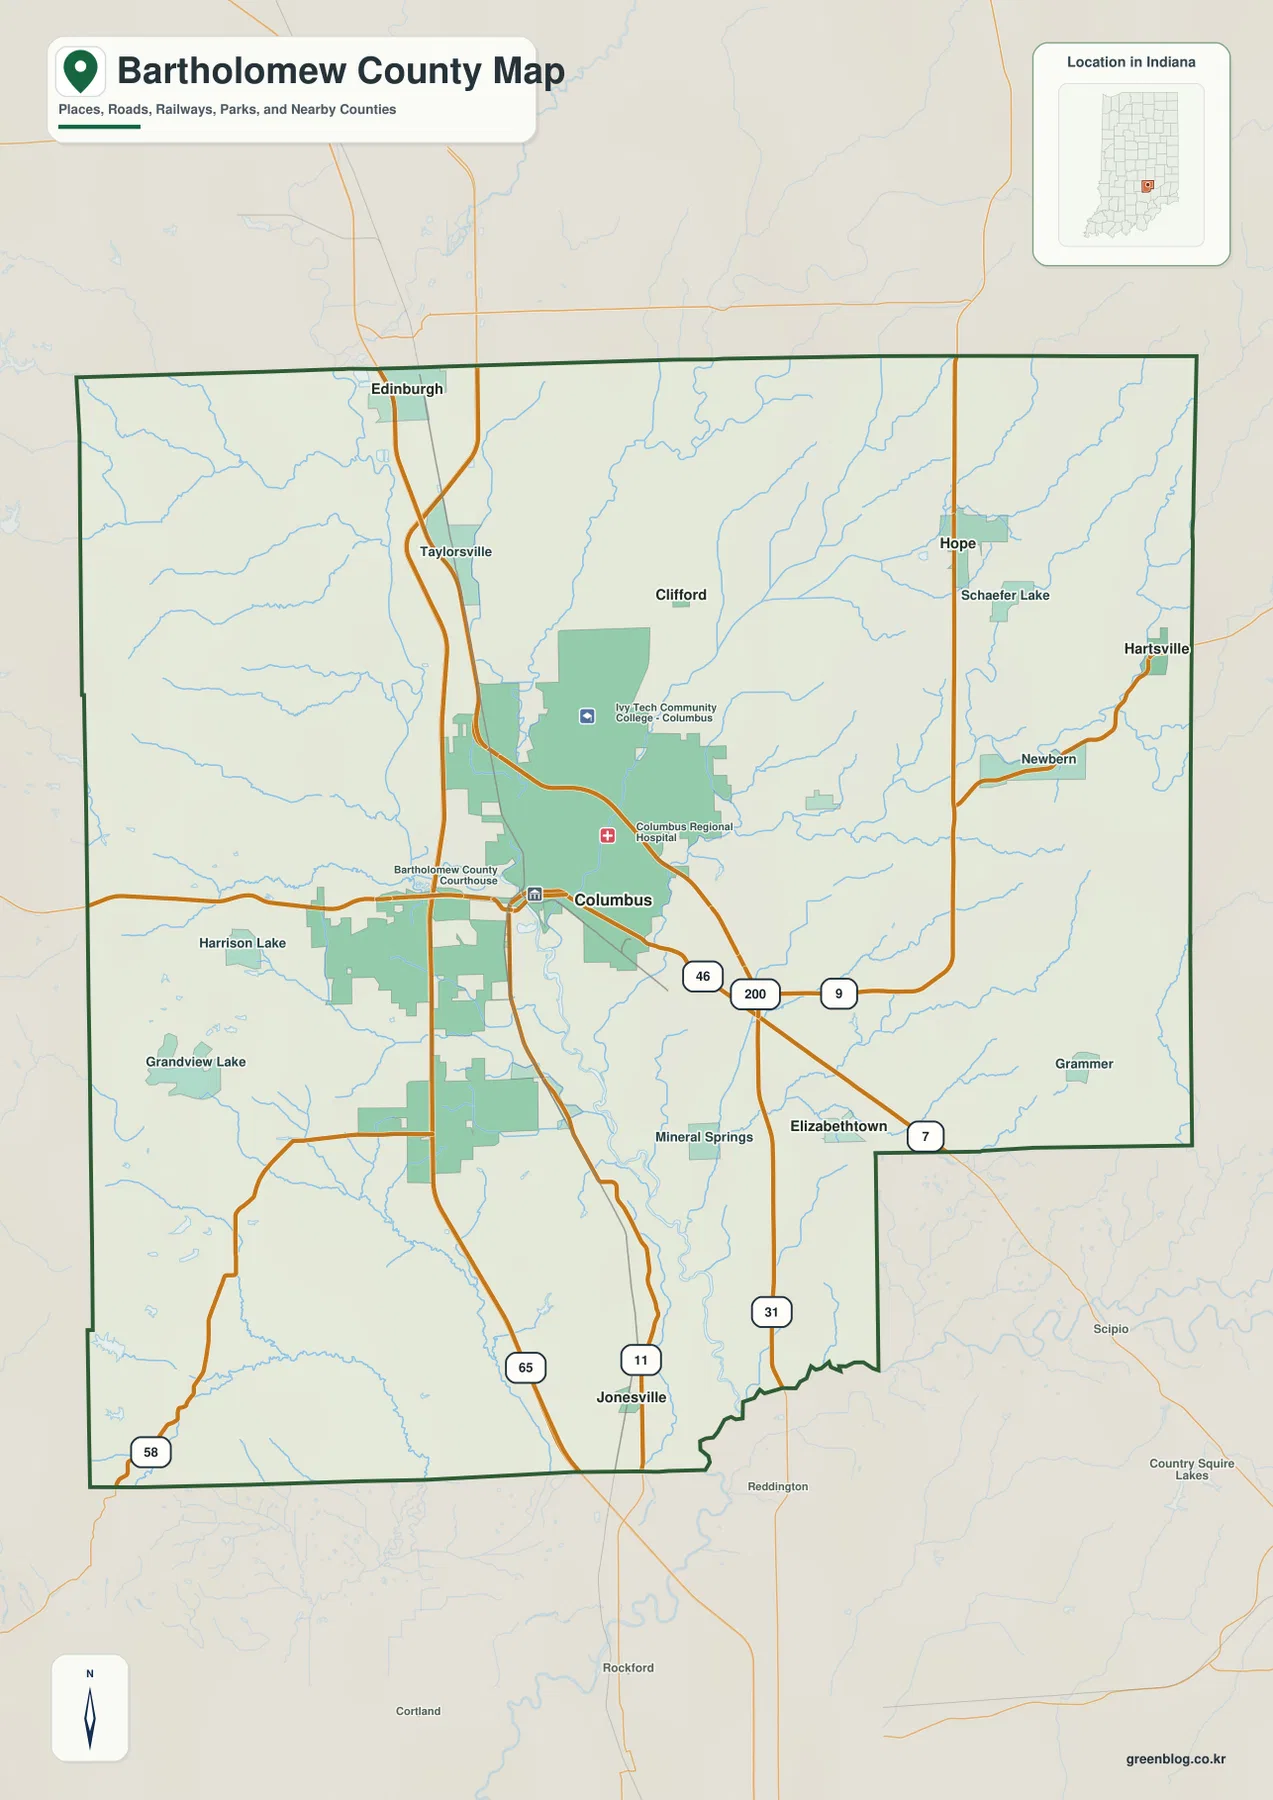
The western half of the map looks different from the east. Fewer named towns appear there, while Harrison Lake and Grandview Lake stand out among a network of smaller roads and streams. The county line cuts around this varied terrain before reaching the southern edge. This is useful context when looking at the elevation map later, because the western side is also where the relief becomes much more pronounced.
For a quick mental map, three routes are enough to establish the basic frame: I-65 on the western side of Columbus, U.S. 31 extending north, and State Road 46 crossing the county through Columbus. Once those are located, the smaller communities are much easier to place. This map is meant for county-scale orientation rather than turn-by-turn navigation, parcel identification, or live traffic conditions, so detailed travel planning should still use current road information.
One dominant city and five smaller communities define the settlement pattern
The city distribution map makes the imbalance between Columbus and the other mapped communities immediately visible. Columbus is ranked first and occupies the central position. Hope is shown to the northeast, Elizabethtown to the southeast, Hartsville along the eastern side, Clifford north of Columbus, and Jonesville near the southern edge. Removing most road labels makes it much easier to see that the county does not have several similarly sized centers; instead, one dominant city is surrounded by much smaller communities with considerable space between them.
The eastern communities are not lined up along a single corridor. Hope is noticeably farther north, Hartsville sits farther east and somewhat south of Hope, and Elizabethtown is lower and closer to the southeast side of Columbus. Clifford occupies a north-central position, while Jonesville is detached from the others near the south. This arrangement gives the county a broad, radial settlement pattern around Columbus rather than a simple north-south chain.
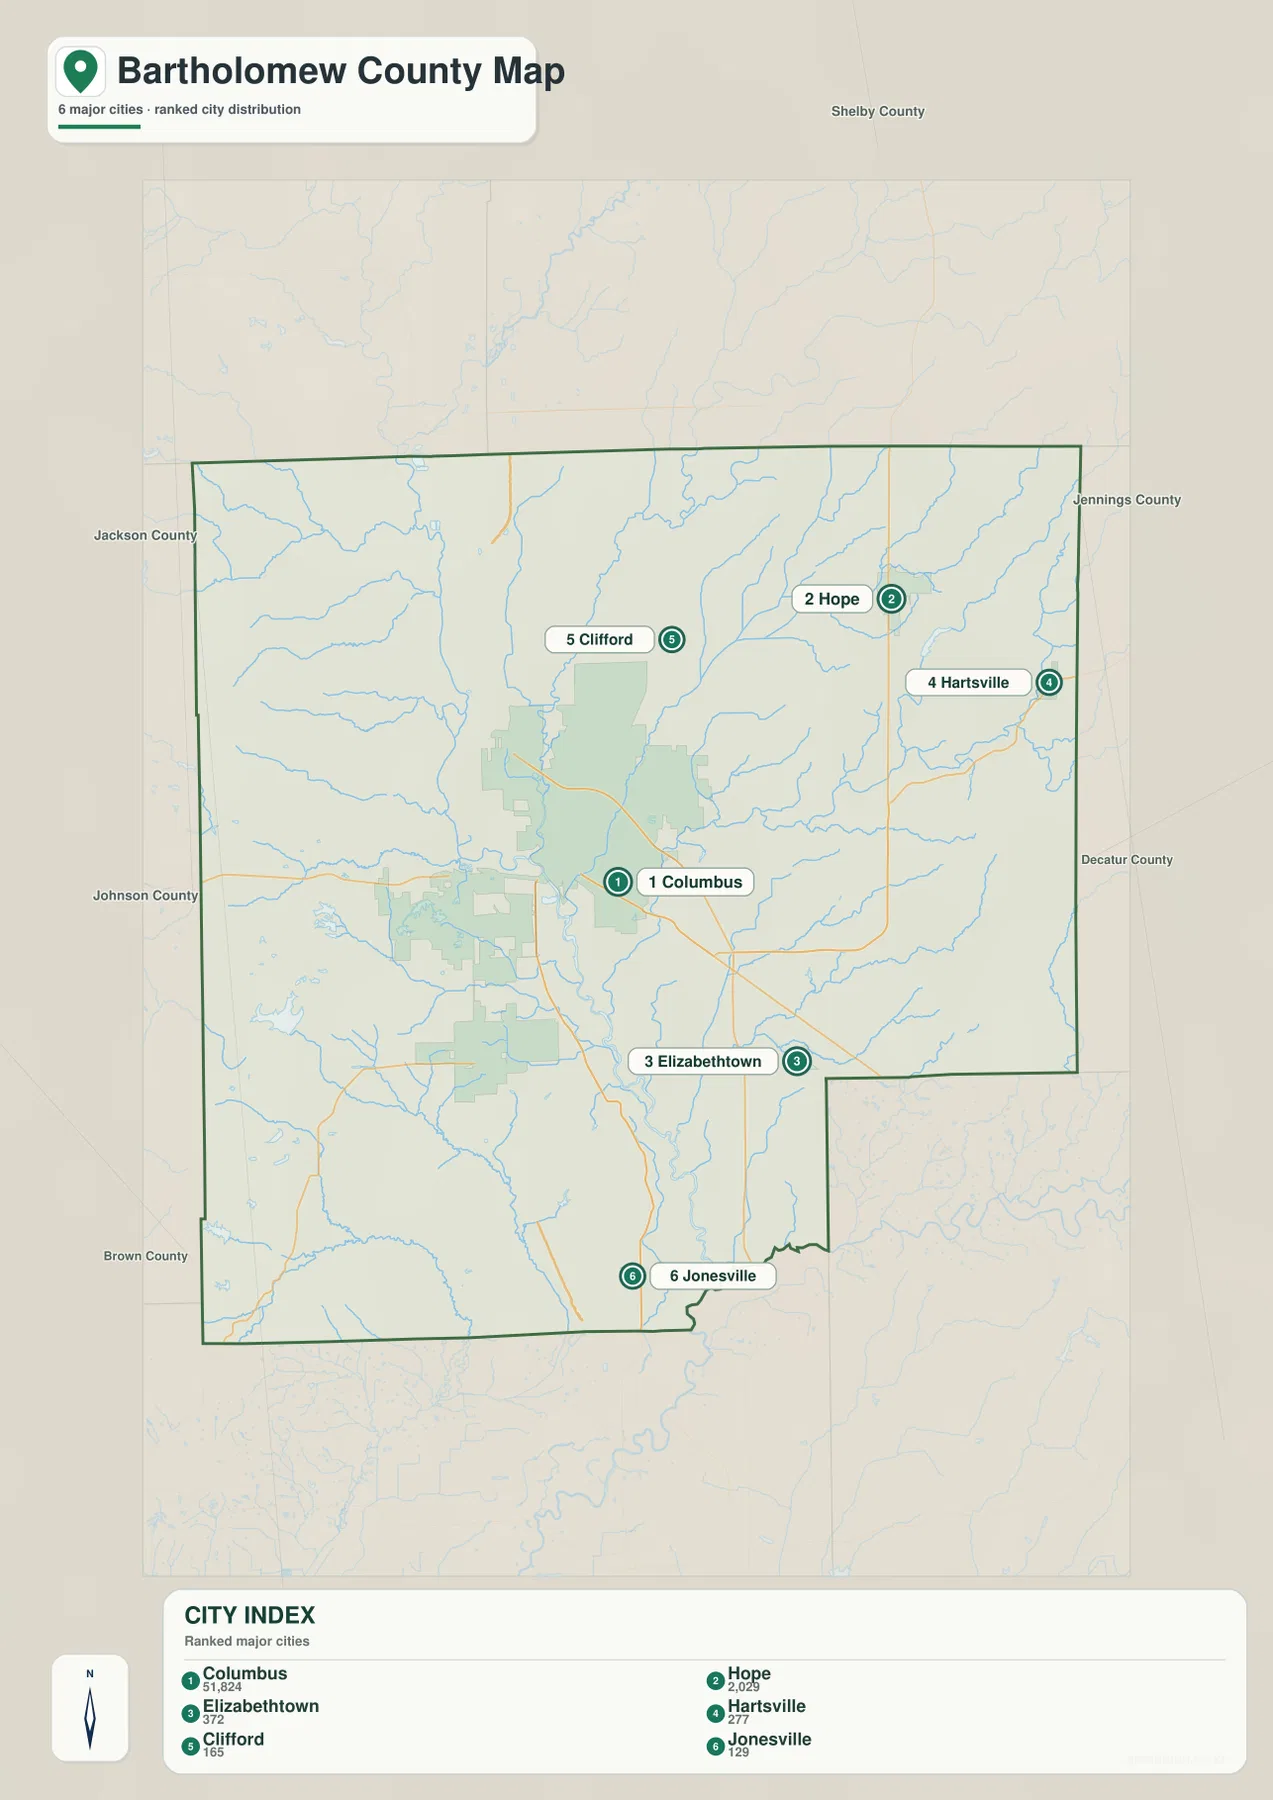
The index printed on the supplied map includes numerical values for the six communities, but this article does not reinterpret those figures as a current population table. Their most useful role here is to show the map’s intended ranking and the very large visual gap between Columbus and the smaller places. For up-to-date population statistics, a dated official statistical source should be used instead.
When road relationships matter, the city map should be paired with the general map. For example, Hope’s northeast position becomes more meaningful when State Road 9 is visible, and Elizabethtown is easier to place once the eastern and southeastern road connections are restored. Jonesville’s isolation near the southern edge also makes more sense when the I-65 and State Road 11 corridors are visible. The two maps therefore answer different parts of the same question: where the communities are, and how the main roads connect them.
Rivers and creeks converge toward the broad central lowland
The terrain-and-water map changes the emphasis completely. In the north, the Driftwood River descends along the western side of the central plain while the Flatrock River approaches from farther east. Haw Creek runs down from the northeast, and Clifty Creek follows a winding path across the eastern half of the county. These waterways all point toward the same general central and south-central lowland where the White River becomes the dominant named channel.
This convergence helps explain the setting of Columbus. The city lies near the part of the county where several drainage paths come close together, so the central area is shaped by both transportation and water. Bartholomew County’s official website similarly describes much of the county as level land associated with the East Fork of the White River and its tributaries. The water map provides a visual version of that description by reducing road clutter and making the blue stream network the main feature.
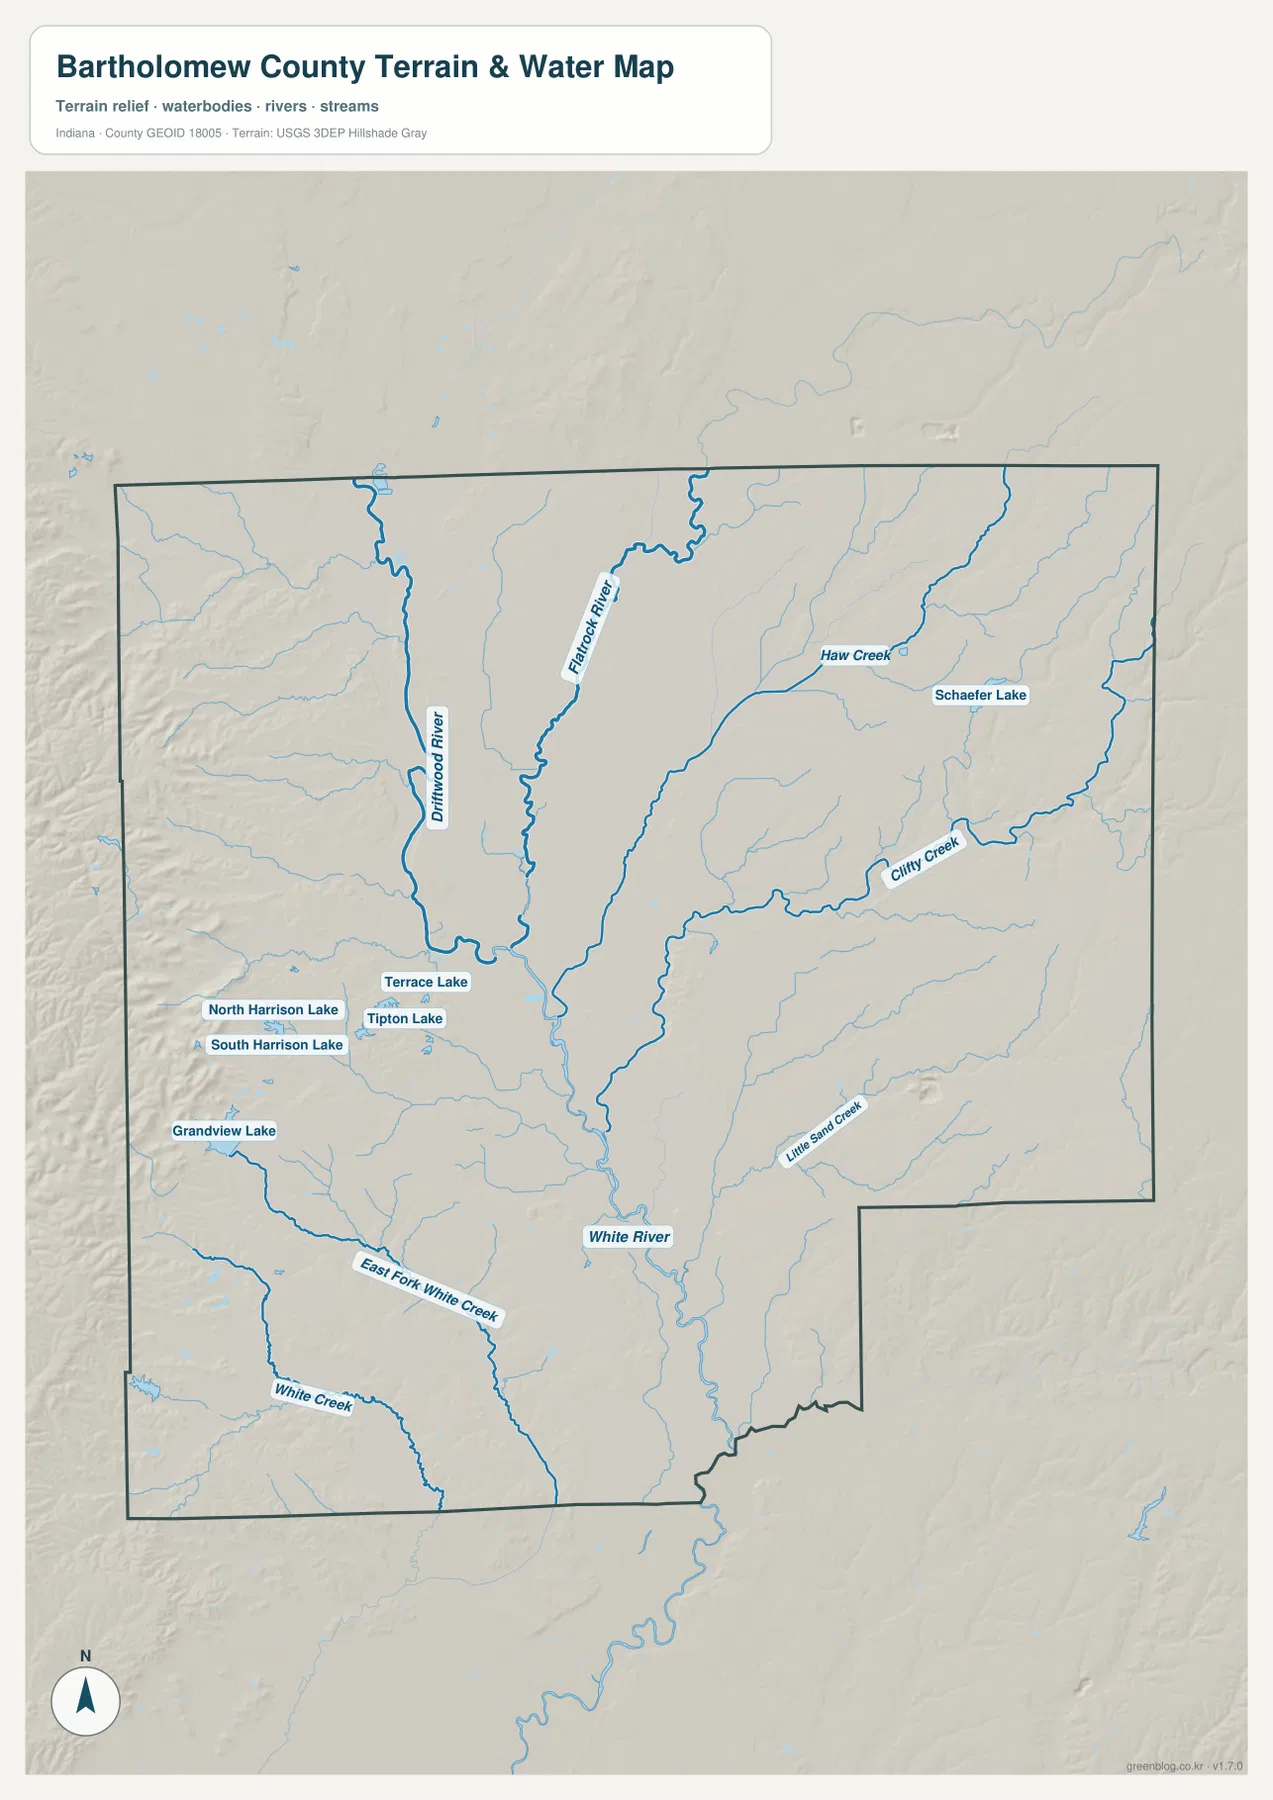
Several smaller water bodies are also labeled. North Harrison Lake, South Harrison Lake, Terrace Lake, Tipton Lake, and Grandview Lake form a small cluster across the western and west-central part of the county, while Schaefer Lake appears in the northeast near Haw Creek. Farther south, smaller tributaries such as Little Sand Creek and White Creek break up the drainage pattern. These features are minor compared with the main rivers, but they help show that the county’s water network is not limited to one channel.
The most useful comparison is with the elevation map. The main river corridors correspond to broad green low areas, while the terrain rises quickly west of them. That relationship is important, but the water map should not be treated as a flood map. It does not show flood probability, water depth, legal drainage boundaries, navigability, or parcel limits. Those questions require current official data prepared specifically for those purposes.
From 158 to 309 meters, the sharpest climb is west of the river plain
The supplied elevation map gives Bartholomew County an actual mapped range of about 158 to 309 meters, with a mean near 206 meters. The lowest colors occupy a large central corridor rather than a narrow single valley. That broad green zone follows the same general area where the river network converges around Columbus and continues southward. The pattern makes the central part of the county look distinctly flatter than the edges.
The western edge is the strongest contrast. Moving west from the central lowland, the map changes from dark and medium greens into yellow, tan, and brown over a relatively short distance. The terrain surface becomes much more dissected, with ridges and valleys packed closely together. This western band reaches the highest mapped elevations and is visually very different from the smoother central plain.
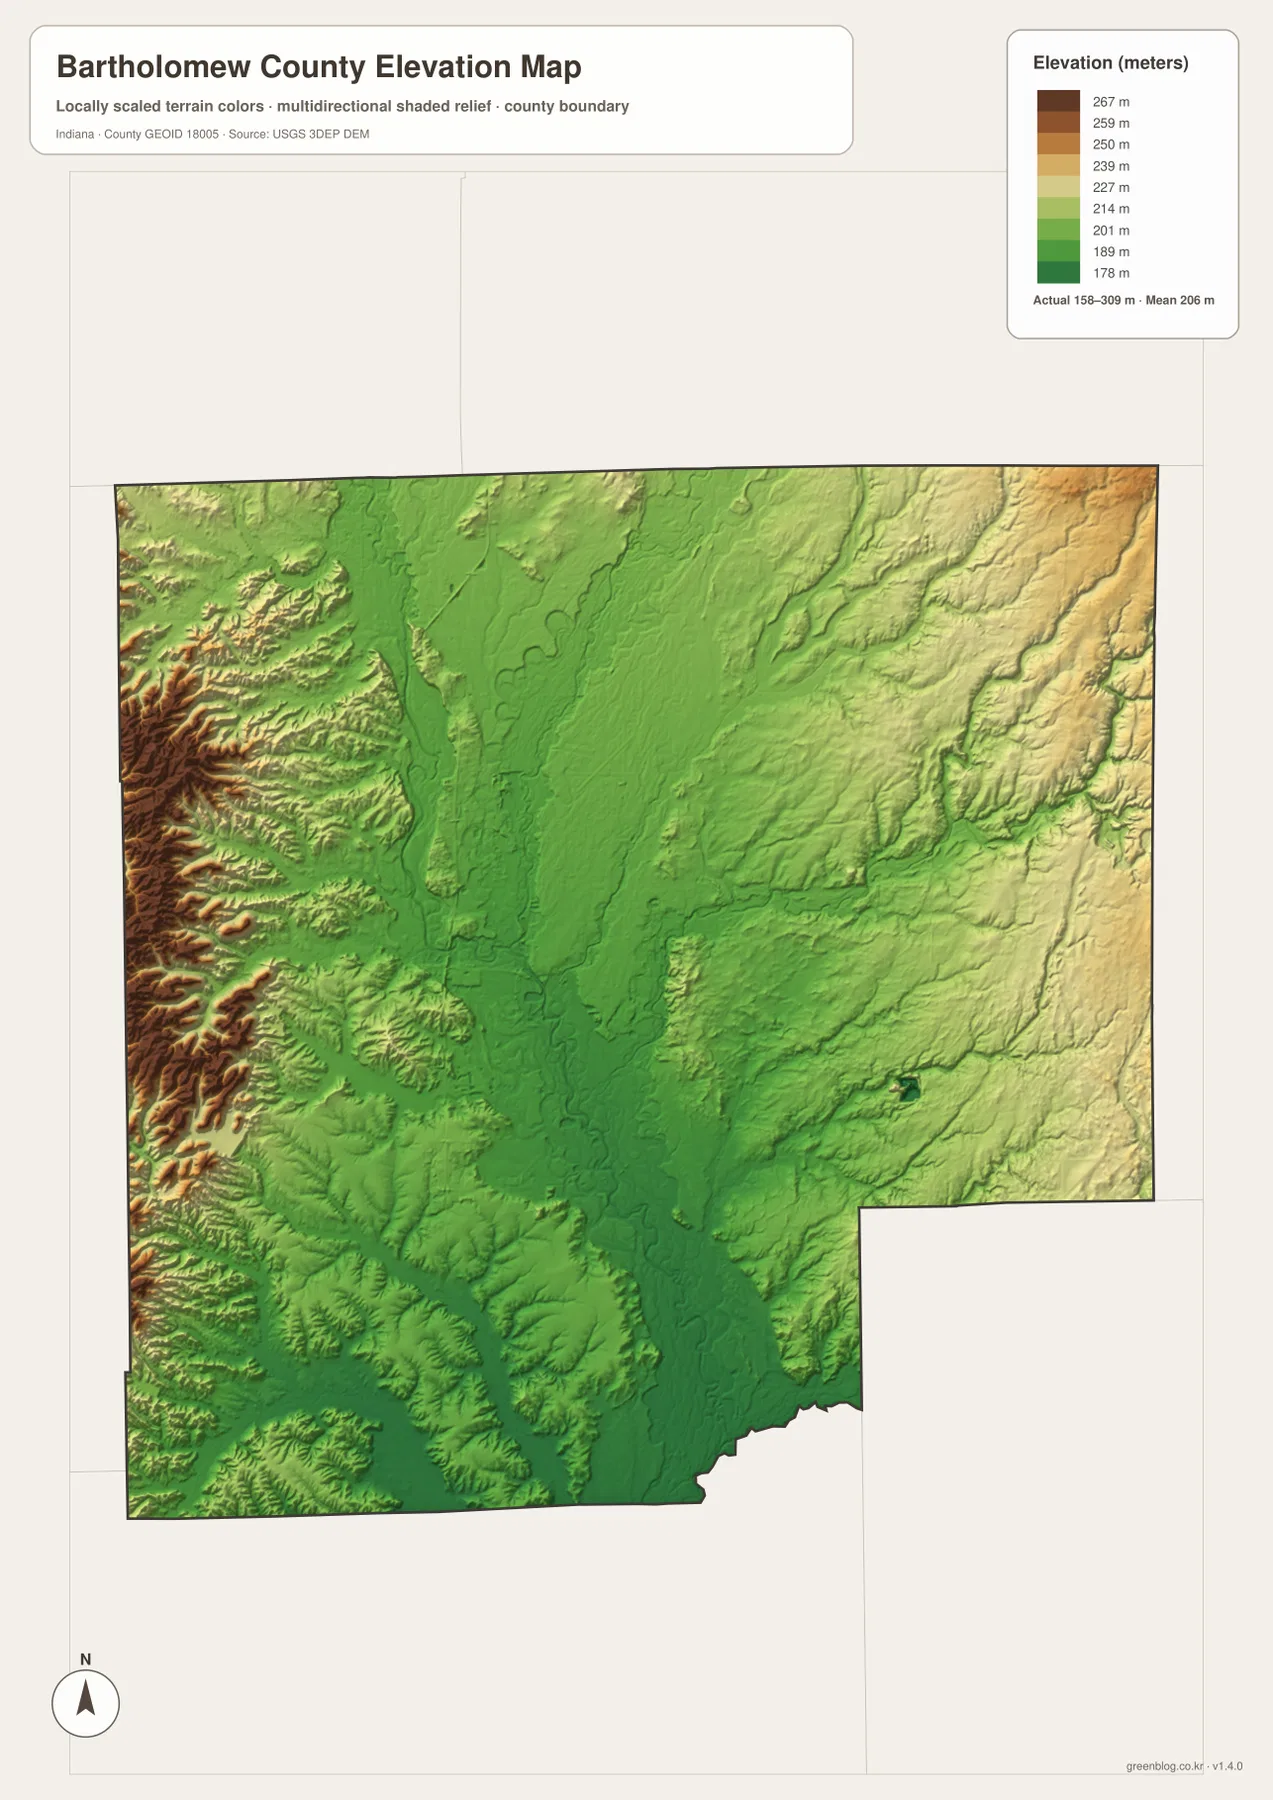
The eastern side has its own relief but changes more gradually. Higher ground appears toward the northeast and eastern edge, interrupted by lower stream valleys associated with Haw Creek, Clifty Creek, and their tributaries. The result is a landscape with three clear zones: the broad central lowland, the steep and rugged western margin, and a more moderate but still varied eastern upland. That is more informative than treating the county as uniformly flat.
This surface is appropriate for county-scale comparison, not for engineering measurements at a house, road cut, or construction site. The colors are generalized from elevation data so visitors can understand broad differences in height. Survey-grade work, drainage design, and site-specific construction decisions require finer official elevation data and often field measurement. Here, the main takeaway is the scale and direction of the relief: low in the central river corridor and much higher toward the west.
Which map works best for roads, communities, water, or relief?
Use the general county map when the question involves several kinds of information at once. It is the best choice for locating Columbus, comparing the main communities, following I-65 and U.S. 31, and keeping the county boundary visible. The city distribution map is cleaner when settlement alone matters. It removes much of the road detail and makes the central role of Columbus and the wide spacing of Hope, Hartsville, Elizabethtown, Clifford, and Jonesville easier to explain.
Choose the terrain-and-water map when river relationships are the priority. It is much easier there to trace the Driftwood and Flatrock rivers, Haw Creek, Clifty Creek, and the White River without road labels competing for attention. The elevation map answers a different question: it shows why the western side feels more rugged and why the Columbus corridor appears broad and low. Looking at the water and elevation maps together is especially useful because the river network and the low terrain reinforce one another.
The WebP images on the page are sized for convenient online viewing. The downloadable ZIP contains the same four map themes as high-resolution JPG files, each 2572 × 3638 pixels. Those larger originals are better for close inspection, classroom handouts, printed reference sheets, or presentations where labels need to remain readable. They are still general reference maps, however, and should not be substituted for legal surveys, flood determinations, navigation charts, or engineering plans.
Frequently Asked Questions
Which map is best for comparing Columbus with Hope and Elizabethtown?
The ranked city map is the quickest way to compare their relative positions because it removes most road detail. Columbus sits near the center, Hope is to the northeast, and Elizabethtown is to the southeast. If you also need the road connections, switch to the general county map, where I-65, U.S. 31, State Road 46, and the eastern state routes provide the transportation context.
Why is the western side of Bartholomew County much higher on the elevation map?
The central part of the county contains a broad lowland associated with the White River system and the rivers and creeks that approach Columbus. West of that low area, the terrain rises quickly into a more rugged band of ridges and narrow valleys. The supplied elevation surface ranges from about 158 to 309 meters, so the transition is large enough to stand out clearly on the color scale.
Can the water map be used to determine flood risk?
No. The water map is a county-scale reference showing the relative locations of the Driftwood River, Flatrock River, Haw Creek, Clifty Creek, White River, lakes, and smaller tributaries. It does not show flood zones, expected water depth, insurance classifications, legal drainage limits, or real-time river conditions. Use current official flood information for those decisions.
Map File Information
Download the high-resolution JPG originals for the Bartholomew County general map, ranked city map, terrain-and-water map, and elevation map in one ZIP archive.
- Included Files: 4 high-resolution JPG maps
- Printable Size: 2572 × 3638 px each
Related Maps
Sources and References
- Bartholomew County, Indiana official website – county overview, Columbus, and major transportation context
- U.S. Census Bureau TIGER/Line Shapefiles – county boundaries, roads, and place reference data
- USGS National Hydrography – rivers, streams, and water features
- USGS 3D Elevation Program – elevation data
Green Map creates custom-edited map images using open geographic data sources such as geoBoundaries, Natural Earth, OpenStreetMap, and government open data.
These maps are edited visual materials, not raw data files, and are provided for education, documents, presentations, and graphic reference.