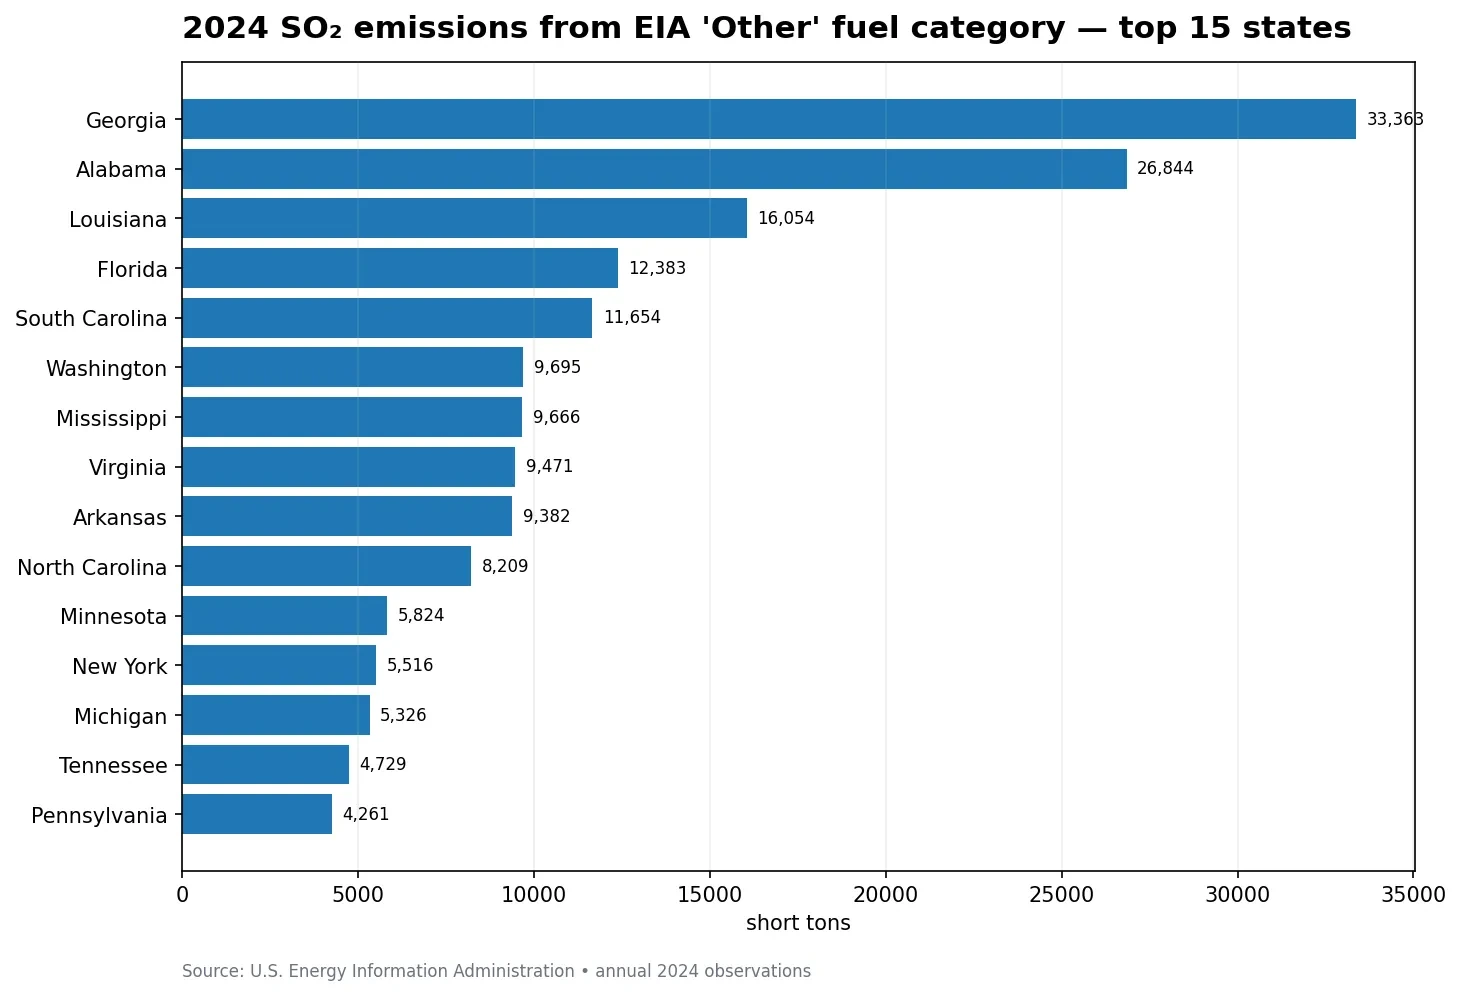
The 2024 state pattern for U.S. other-fuel SO2 emissions by state is highly uneven. The U.S. Energy Information Administration (EIA) State Electricity Profiles API reports 51 annual observations for the fuel facet OTH and the sulfur-dioxide field so2-short-tons. Added together, the 50 states plus the District of Columbia total 198,563 short tons of SO₂. Georgia leads with 33,363 short tons, followed by Alabama with 26,844 and Louisiana with 16,054.
The label Other needs to be treated as a data category, not as the name of one physical fuel. The supplied EIA route identifies the facet as fuelid=OTH, but the state file used here does not break that category into component fuels. The safe interpretation is therefore a comparison of emissions reported under EIA’s published Other grouping. Plant-level fuel composition, sulfur content, operating hours, and emissions controls would be needed before assigning a specific cause to an individual state’s value.
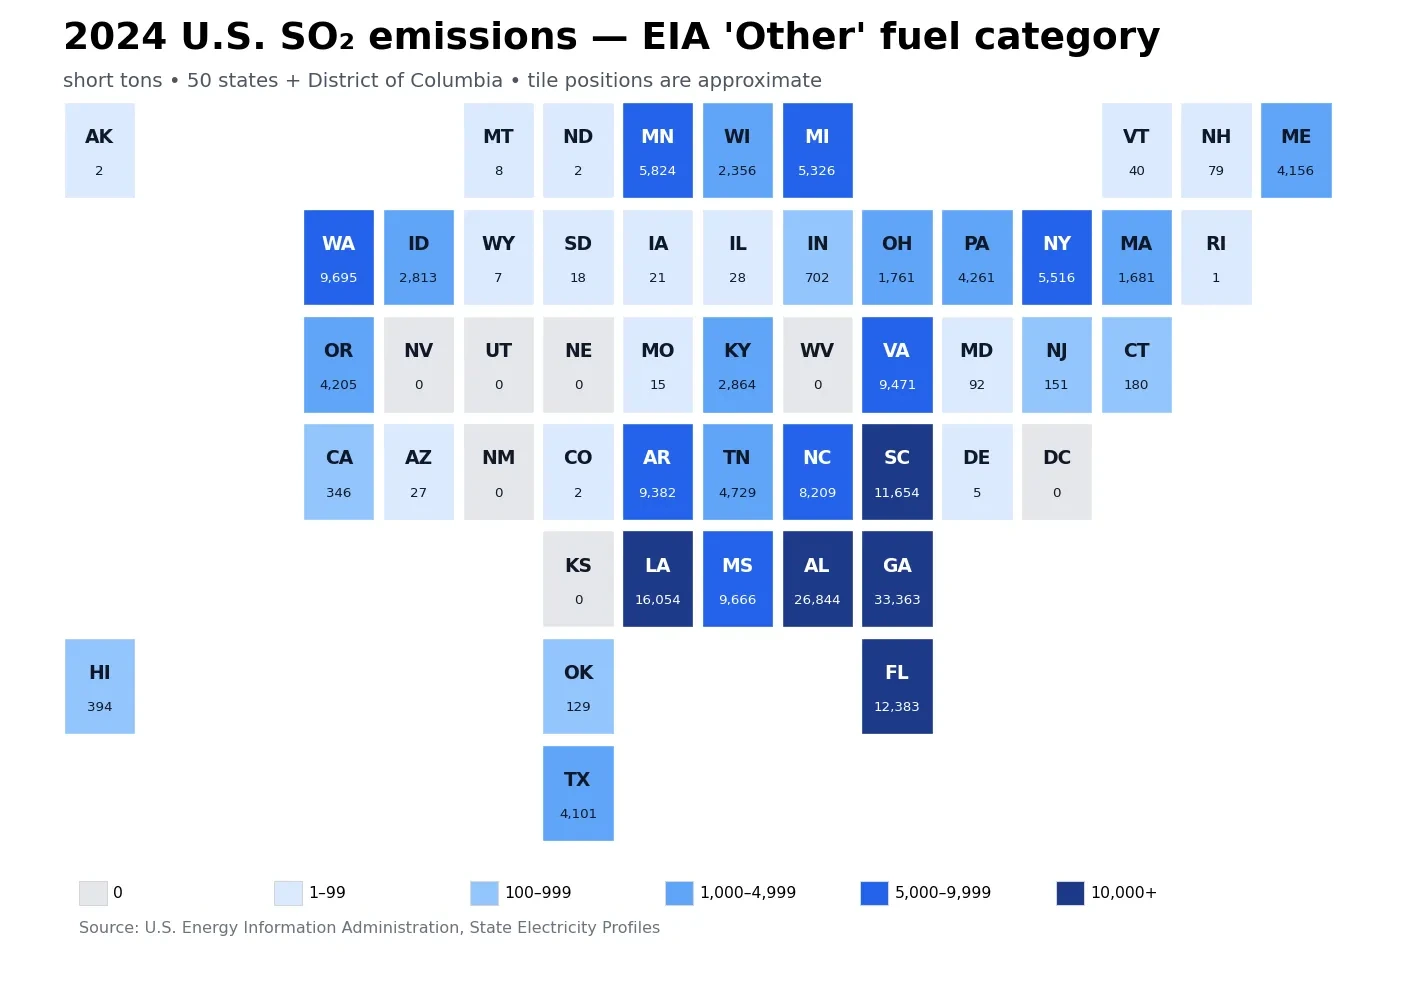
Table of Contents
Georgia and Alabama together account for about three-tenths of the state/DC sum
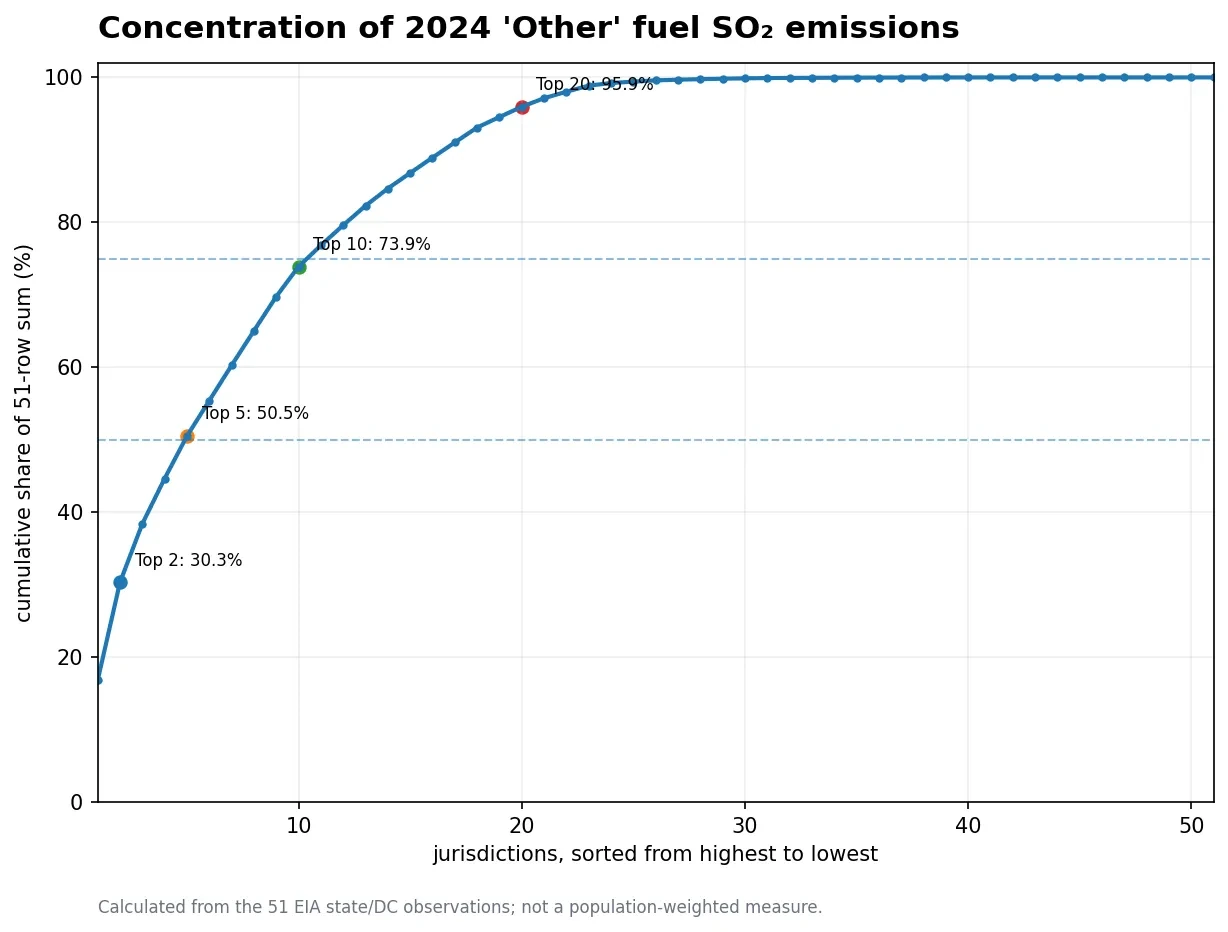
Georgia alone represents 16.8% of the 51-row total, while Alabama contributes 13.5%. Combined, the two states account for 30.3%. Adding Louisiana brings the top-three share to 38.4%. Florida at 12,383 short tons and South Carolina at 11,654 bring the top five to 50.5%. Half of the measured total is therefore reached with only five jurisdictions.
The next group consists of Washington at 9,695, Mississippi at 9,666, Virginia at 9,471, Arkansas at 9,382, and North Carolina at 8,209 short tons. After those ten jurisdictions, the cumulative share is 73.9%. The ranking has a clear southeastern presence, but Washington is a prominent exception and the dataset does not support a simple regional-cause story.
| Rank | State / jurisdiction | 2024 SO₂ (short tons) |
|---|---|---|
| 1 | Georgia | 33,363 |
| 2 | Alabama | 26,844 |
| 3 | Louisiana | 16,054 |
| 4 | Florida | 12,383 |
| 5 | South Carolina | 11,654 |
| 6 | Washington | 9,695 |
| 7 | Mississippi | 9,666 |
| 8 | Virginia | 9,471 |
| 9 | Arkansas | 9,382 |
| 10 | North Carolina | 8,209 |
| 11 | Minnesota | 5,824 |
| 12 | New York | 5,516 |
| 13 | Michigan | 5,326 |
| 14 | Tennessee | 4,729 |
| 15 | Pennsylvania | 4,261 |
A mean of 3,893 short tons hides a median of only 346
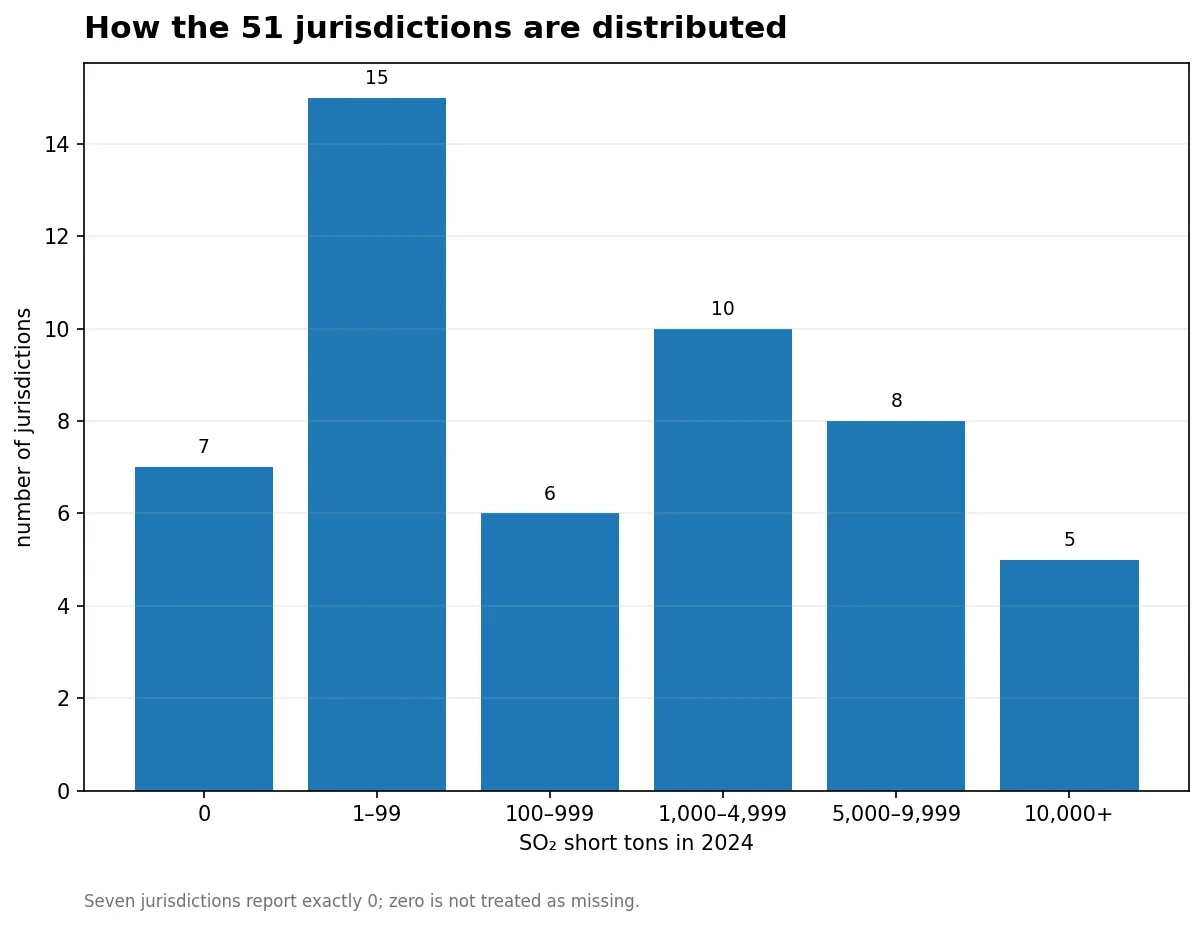
The arithmetic mean is 3,893.4 short tons, but the median jurisdiction reports just 346. That is an unusually large mean-median gap: the mean is about 11.3 times the median. The first quartile is 7.5 short tons and the third quartile is 5,027.5, so even the middle half of the observations spans a wide range. Georgia’s value is roughly 96.4 times the median.
The band counts make the skew easier to see. Seven jurisdictions are exactly zero, fifteen fall from 1 to 99 short tons, six are from 100 to 999, ten are from 1,000 to 4,999, eight are from 5,000 to 9,999, and five are at or above 10,000. In other words, 22 jurisdictions are below 100 short tons while a small upper tail contributes most of the total. That is why U.S. other-fuel SO2 emissions by state are better described with medians and concentration shares than with an average alone.
The geographic pattern is informative, but the dataset does not identify the plant-level cause
Nine of the top ten observations are in the South if Virginia is included in the broad regional grouping, while Washington is the major western outlier. That spatial pattern is worth noticing because it shows where the EIA OTH emissions total is concentrated. It is not enough, however, to determine why those states are high. The four-column state file contains a location, year, and emissions value; it does not contain individual generating units, detailed fuel streams, sulfur characteristics, or control equipment.
For U.S. other-fuel SO2 emissions by state, the OTH facet makes causal interpretation especially sensitive. A residual or miscellaneous fuel grouping can represent a mix of activities that differs among states. A rigorous follow-up would join the emissions observations to EIA plant and fuel records and then test which generating units contribute to the state total. This article deliberately stops at the level that the verified data support: state totals, rankings, dispersion, and geographic concentration.
The 51 OTH rows are about 22.3% of EIA’s 2024 all-fuel U.S. power-sector SO₂ total
EIA’s 2024 United States Electricity Profile reports 890,331 short tons of sulfur dioxide from all energy sources in the electric-power profile. The 198,563-short-ton sum of the OTH state/DC rows is about 22.3% of that nationwide all-fuel figure. This is a cross-table analytical comparison, not a separate EIA percentage series, so it should be presented as context rather than as a published indicator.
The same comparison is useful for several leading states. Georgia reports 44,558 short tons of all-fuel power-sector SO₂ and 33,363 short tons in the OTH slice, a derived ratio of about 74.9%. Alabama’s 26,844 OTH value is about 90.9% of its 29,545-short-ton all-fuel total. Louisiana’s 16,054 OTH value is about 64.3% of its 24,964 total. These examples show that the OTH category can be material within a state’s electricity-profile emissions, but the percentages are calculations from two official EIA tables rather than separately published EIA shares.
Seven exact zeros should not be confused with missing observations
The District of Columbia, Kansas, Nebraska, New Mexico, Nevada, Utah, and West Virginia are recorded as exactly 0 short tons in this 2024 OTH slice. There are no missing values. A map or ranking that converts those seven zeros into ‘no data’ would misstate the source, while a workflow that fills missing values with zero would create the opposite error.
Several other jurisdictions have very small but positive numbers: Rhode Island reports 1 short ton; Alaska, Colorado, and North Dakota report 2 each; Delaware 5; Wyoming 7; and Montana 8. Those distinctions have little effect on the national concentration pattern, but they matter for data integrity and for any later analysis that groups states by the presence or absence of reported emissions.
SO₂ is an air-pollution measure, not a carbon-emissions ranking
Sulfur dioxide is one of the criteria air pollutants regulated under the U.S. Clean Air Act. EIA publishes SO₂ and NOx emissions and emissions factors for electricity generation, and it treats them separately from energy-related carbon dioxide. A state with a high SO₂ total is therefore not automatically a state with high CO₂ emissions, nor does this ranking measure the full environmental burden of electricity generation.
Annual state emissions are also not the same as ambient exposure or health impact. Source location, stack conditions, weather, atmospheric transport and chemistry, and population distribution all influence the concentrations people experience. The dataset is well suited to comparing the scale of one electric-power emissions category across jurisdictions; it is not a direct air-quality or health-risk index.
Data definition and calculation method
The primary dataset is the U.S. Energy Information Administration State Electricity Profiles API route for emissions by state by fuel. The extraction fixes frequency to annual, year to 2024, the data field to so2-short-tons, and the fuel facet to OTH. All 51 rows are numeric. Sums, rankings, quartiles, band counts, and cumulative shares in this article are calculated directly from those observations without imputation.
EIA describes this electricity emissions family as emissions associated with electricity generation and useful thermal output at conventional power plants and combined-heat-and-power plants. The national all-fuel context comes from the 2024 United States Electricity Profile, and EIA’s general explanation of electricity SO₂ and NOx emission factors is available in its emissions-factor FAQ. U.S. other-fuel SO2 emissions by state should therefore be read as a bounded EIA electric-power indicator, not as all sulfur-dioxide emissions from every source in each state.
Frequently Asked Questions
Which state had the highest 2024 SO2 emissions in EIA’s Other fuel category?
Georgia was highest at 33,363 short tons, followed by Alabama at 26,844. Together they represent about 30.3% of the 51-jurisdiction sum.
Does EIA’s OTH category mean one specific fuel?
No. OTH is the published Other category in this API slice. The supplied state file does not disaggregate its component fuels, so the values should not be assigned to one specific fuel without additional data.
Are the seven zero values missing data?
No. The dataset contains 51 numeric observations with no missing values. Seven jurisdictions are reported as exactly 0 short tons.
Can this SO2 ranking be used as an air-quality or health-risk ranking?
No. It measures annual emissions for one electric-power fuel category. Ambient exposure and health impacts depend on source locations, weather, atmospheric chemistry, transport, and population distribution.
Related Articles
These related Green Map articles provide broader electricity-fuel context for interpreting how generation mixes differ across places.
- Fossil-fuel electricity share by country in 2021
- Coal dependence in electricity generation in 2021
- Natural-gas share of electricity generation in 2021
Green Map creates custom-edited map images using open geographic data sources such as geoBoundaries, Natural Earth, OpenStreetMap, and government open data.
These maps are edited visual materials, not raw data files, and are provided for education, documents, presentations, and graphic reference.