Petroleum-related nitrogen oxides (NOx) from U.S. power plants were extraordinarily concentrated in a few jurisdictions in 2024. The 50 states and the District of Columbia in the EIA fuel-specific file sum to 38,691 short tons. Hawaii alone reports 17,081 short tons and Alaska 7,444. Together they account for 63.4% of the 51-row total. That concentration is the defining feature of U.S. petroleum power-sector NOx emissions by state: the national state-level pattern is dominated by a very small number of places rather than spread evenly across the country.
The scope is narrower than the phrase “petroleum emissions” might suggest. This EIA State Electricity Profiles dataset covers emissions from energy consumption at conventional power plants and combined-heat-and-power plants, including emissions associated with electricity generation and useful thermal output. The fuel category Petroleum includes petroleum liquids and petroleum coke under EIA electricity definitions. The values are therefore not a measure of NOx from cars, trucks, ships, refineries, buildings, or every petroleum-consuming activity in a state. They describe a specific fuel-and-emissions slice of the electric power industry.
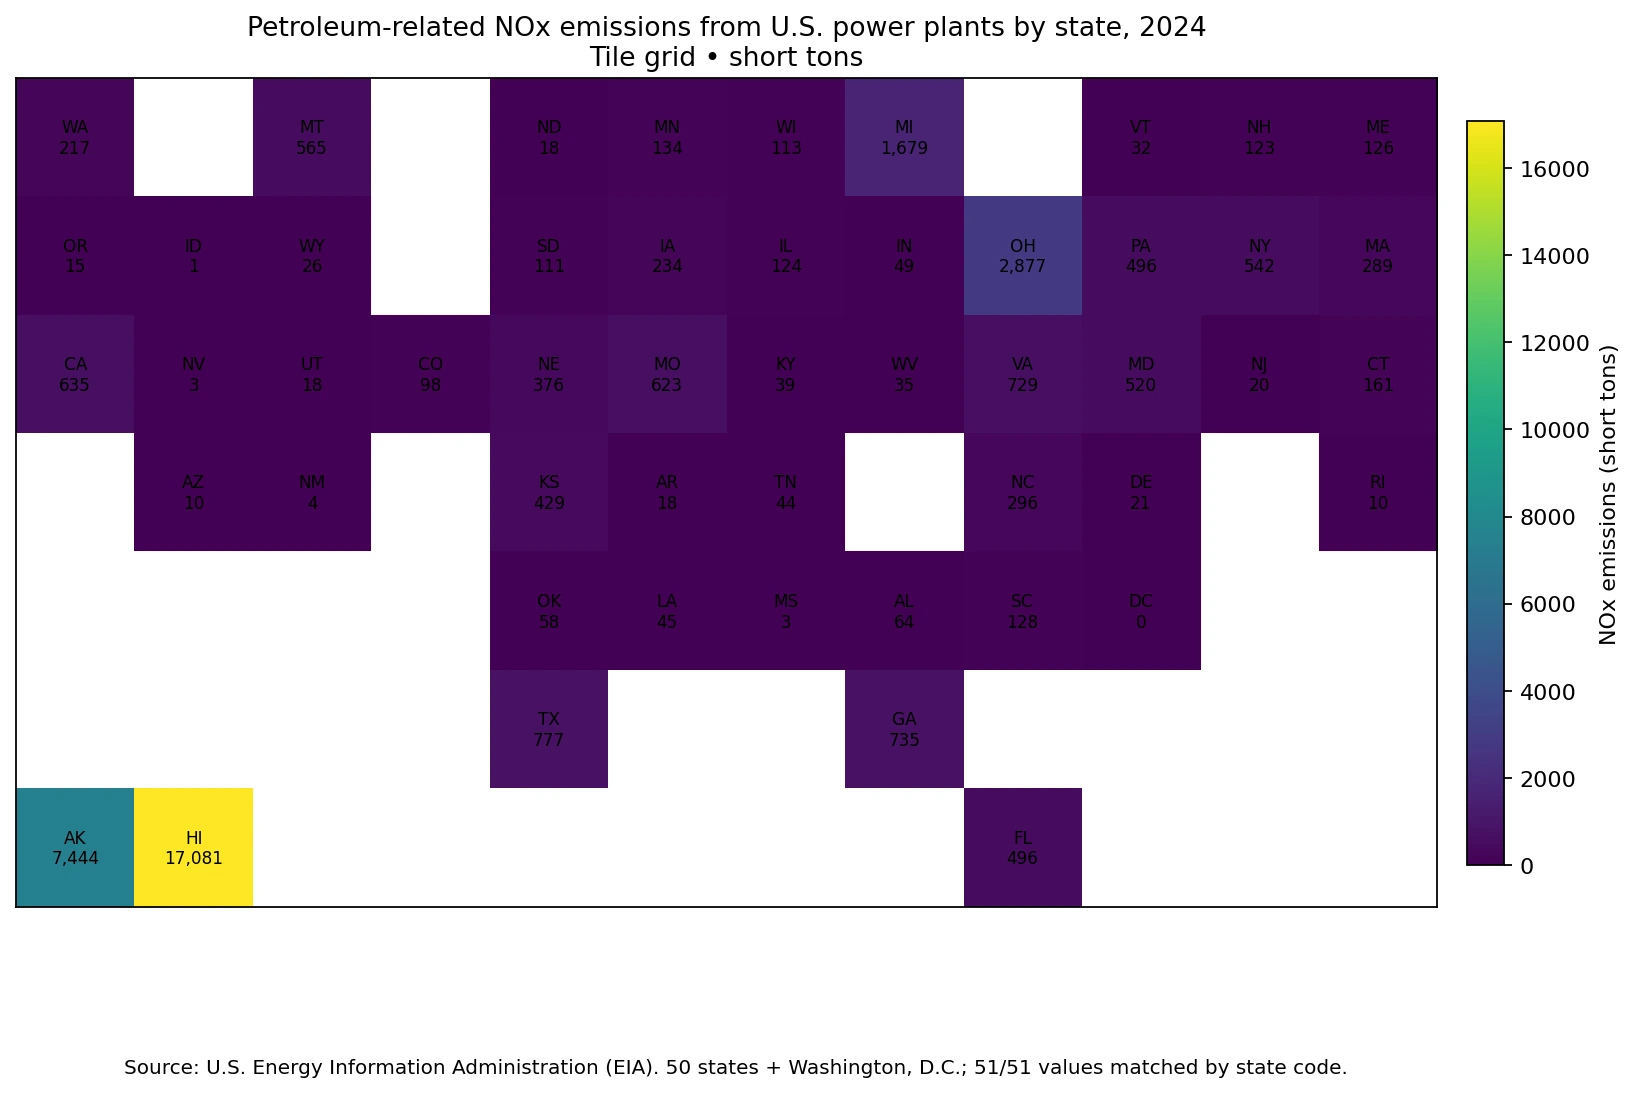
Table of Contents
Hawaii and Alaska account for 63.4% of the 51-jurisdiction petroleum NOx sum
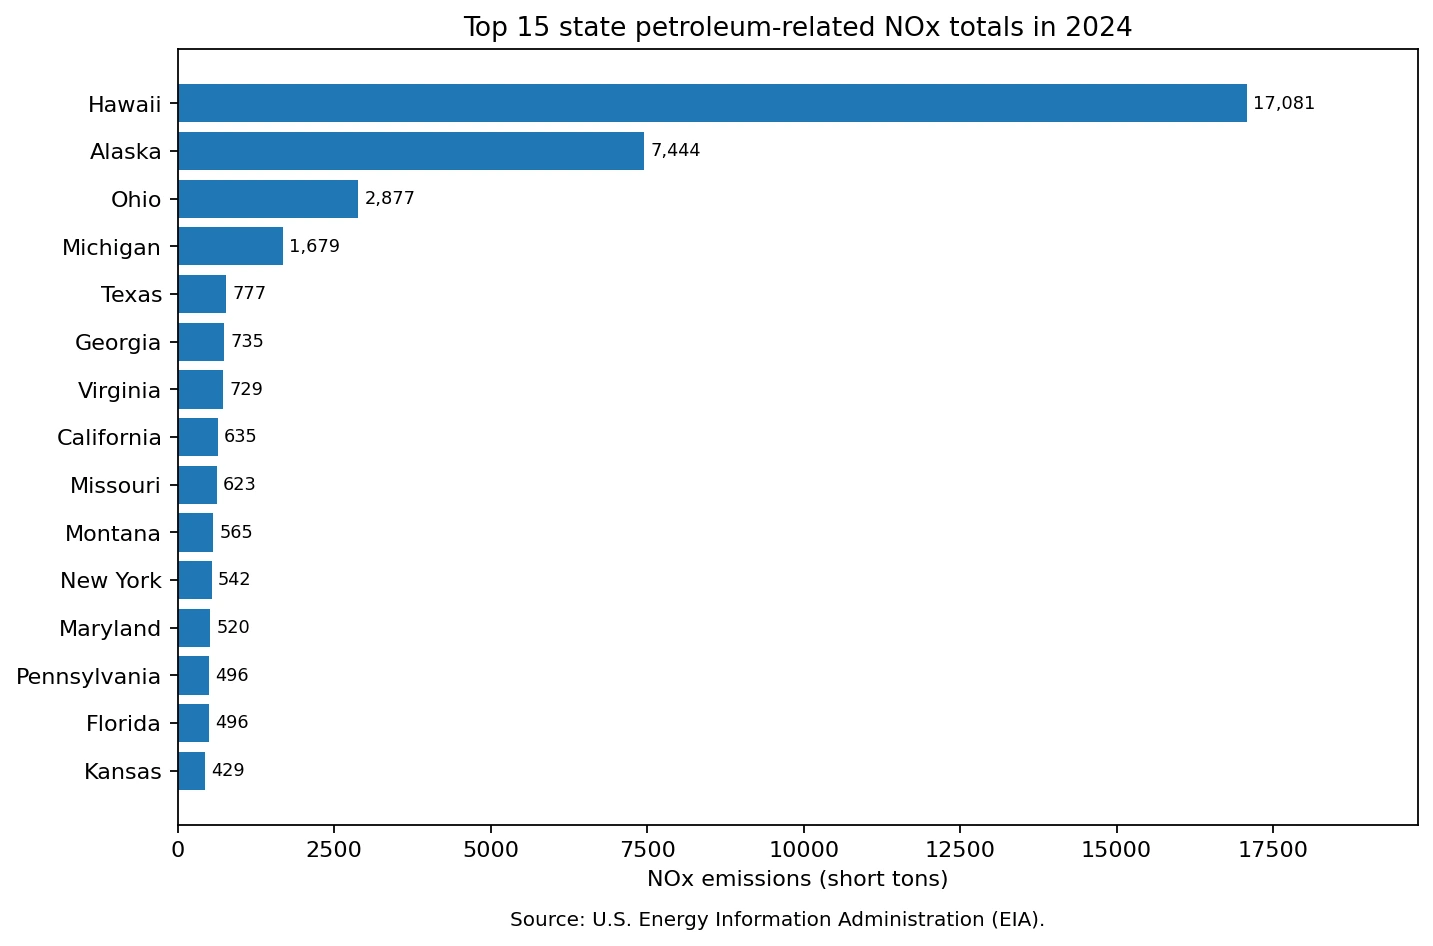
Hawaii is an extreme outlier at 17,081 short tons, representing 44.1% of the 51-row sum by itself. Alaska follows at 7,444 short tons, or 19.2%. Adding Ohio at 2,877 pushes the top-three share to 70.8%. Michigan contributes 1,679 and Texas 777; the top five together make up 77.2% of the state-and-D.C. petroleum NOx total.
The next tier is much smaller: Georgia records 735 short tons, Virginia 729, California 635, Missouri 623, and Montana 565. Those five complete the top ten, which together account for 85.7% of the 51-jurisdiction sum. The geography is not a simple mainland regional cluster. The two noncontiguous states dominate, followed by states in the Midwest, South, West, and East. The ranking therefore deserves an emissions-specific interpretation rather than a broad claim that one U.S. region is uniformly responsible.
| Rank | State / jurisdiction | 2024 NOx (short tons) |
|---|---|---|
| 1 | Hawaii | 17,081 |
| 2 | Alaska | 7,444 |
| 3 | Ohio | 2,877 |
| 4 | Michigan | 1,679 |
| 5 | Texas | 777 |
| 6 | Georgia | 735 |
| 7 | Virginia | 729 |
| 8 | California | 635 |
| 9 | Missouri | 623 |
| 10 | Montana | 565 |
| 11 | New York | 542 |
| 12 | Maryland | 520 |
| 13 | Florida | 496 |
| 14 | Pennsylvania | 496 |
| 15 | Kansas | 429 |
The mean is 758.6 short tons, but the median is only 123
The simple average across the 51 jurisdictions is 758.6 short tons, while the median is 123. The mean is about 6.2 times the median because Hawaii and Alaska pull it sharply upward. The first quartile is 23.5 short tons and the third quartile 496, so the middle half of the observations lies roughly between those values. Hawaii is about 139 times the median, which makes the average a poor description of a typical middle state.
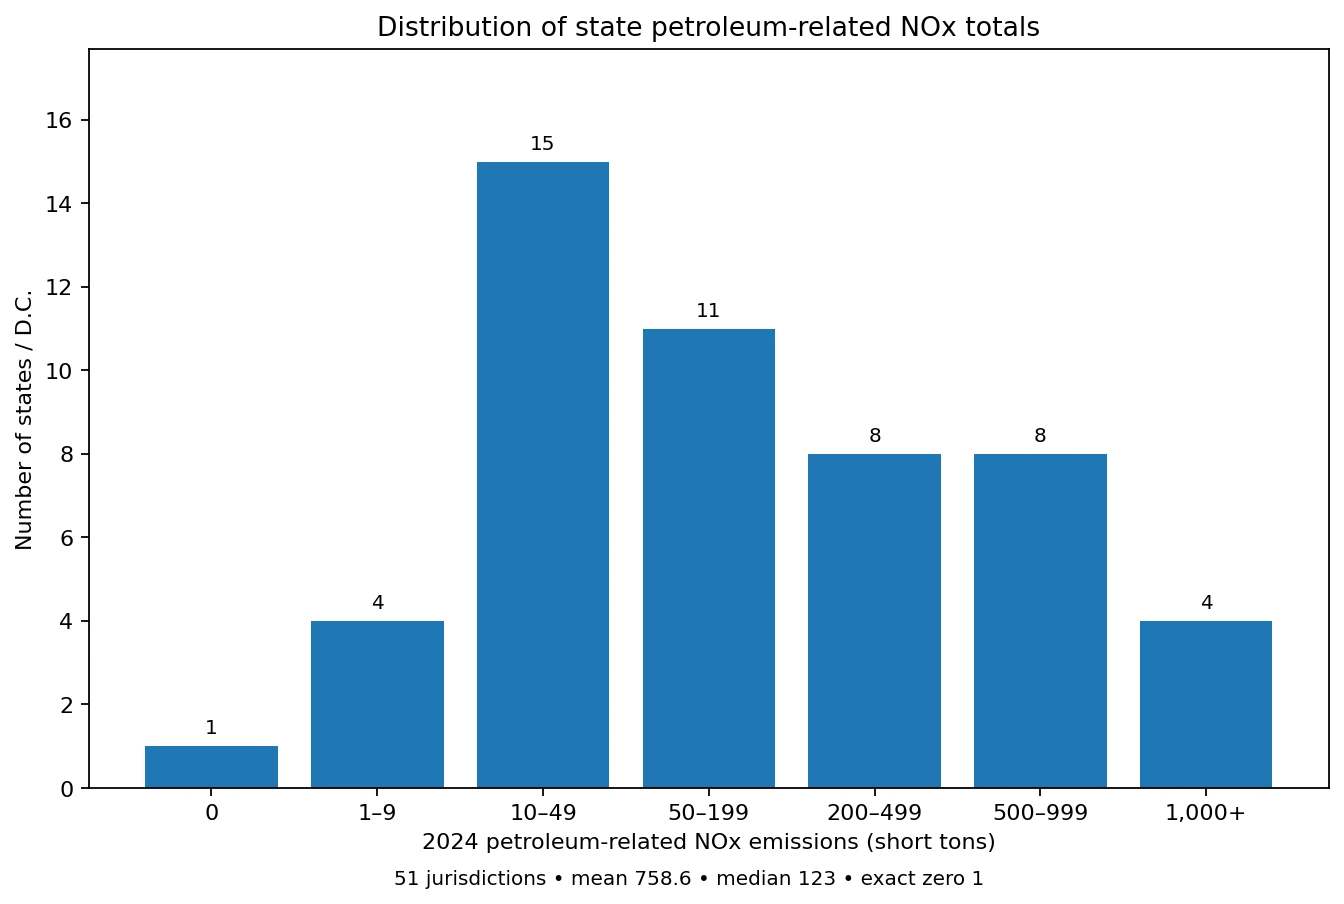
The band counts make the skew easier to see. One jurisdiction reports exactly zero, 4 fall between 1 and 9 short tons, 15 between 10 and 49, 11 between 50 and 199, 8 between 200 and 499, and 8 between 500 and 999. Only 4 jurisdictions reach 1,000 short tons or more. Twenty of the 51 observations are below 50 short tons, yet the largest observation is above 17,000. That long upper tail is why U.S. petroleum power-sector NOx emissions by state should be described with medians and concentration shares as well as a mean.
| 2024 petroleum NOx band (short tons) | Jurisdictions |
|---|---|
| 0 | 1 |
| 1–9 | 4 |
| 10–49 | 15 |
| 50–199 | 11 |
| 200–499 | 8 |
| 500–999 | 8 |
| 1,000+ | 4 |
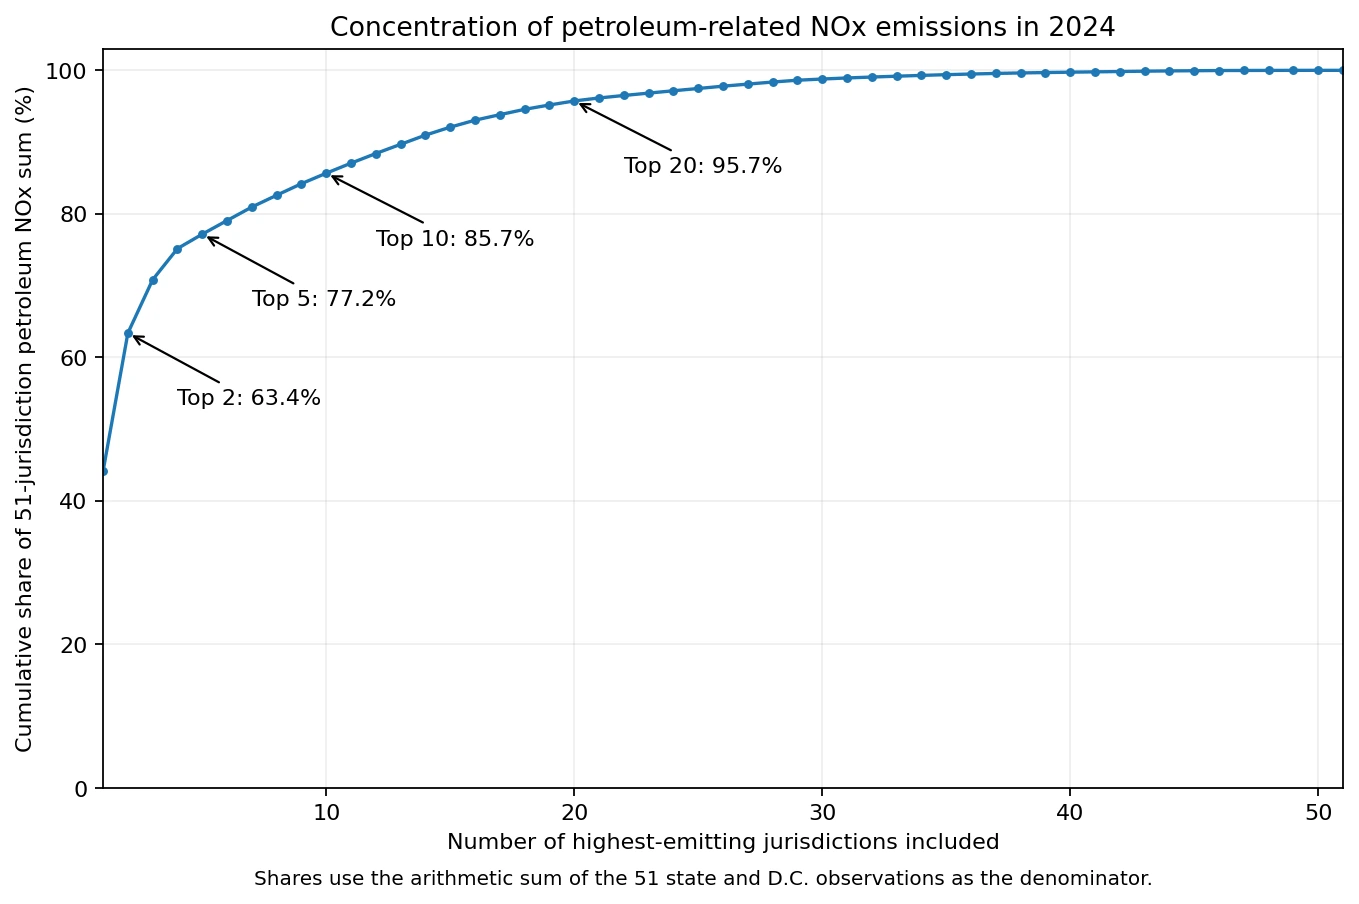
The top five account for 77.2%, and the top twenty reach 95.7%
Sorting jurisdictions from highest to lowest produces a steep cumulative curve. The top five account for 77.2% of the 51-row sum, the top ten 85.7%, and the top twenty 95.7%. The remaining 31 jurisdictions therefore contribute only about 4.3% of the state-and-D.C. total. Petroleum-related power-sector NOx is not merely uneven; in 2024 it is highly concentrated in a limited set of jurisdictions.
These are absolute emissions totals, not emissions intensity. They are not adjusted for population, gross state product, electricity generation, or petroleum-fired generation. A state can rank high because it burns more petroleum for electricity or useful thermal output, because its generating units have different combustion characteristics or controls, or because several factors occur together. The dataset does not identify which explanation is dominant. An intensity study would need a denominator such as MWh from the same petroleum fuel category and would need to preserve the same plant and sector coverage.
Hawaii is a case where petroleum explains most of the state electricity-profile NOx total
EIA’s 2024 Hawaii Electricity Profile reports 18,131 short tons of NOx from all energy sources in the state electric power profile. The petroleum-specific value in this dataset is 17,081 short tons, equivalent to about 94.2% when the two EIA tables are compared. The same Hawaii profile identifies petroleum as the state’s primary electricity energy source. That provides useful context for why Hawaii is such an extreme observation, although the 94.2% ratio is a derived comparison rather than a separately published EIA indicator.
Alaska demonstrates why the petroleum-specific ranking should not be confused with the overall fuel mix. Its 2024 electricity profile lists natural gas as the primary energy source and reports 20,325 short tons of total NOx. Petroleum contributes 7,444 short tons in the fuel-specific file, about 36.6% of that total. Ohio reports 34,673 short tons of total NOx, while its petroleum-specific value is 2,877 short tons, about 8.3%. A state can therefore rank high in petroleum NOx without petroleum being the dominant source of all power-sector NOx.
Petroleum is a small share of U.S. all-fuel power-sector NOx, even though its state distribution is highly concentrated
The 2024 United States Electricity Profile reports 1,226,234 short tons of nitrogen oxide emissions from all energy sources. Comparing that total with the 38,691-short-ton sum of the 51 petroleum rows gives roughly 3.2%. This cross-table ratio is useful context: petroleum represents a relatively small slice of nationwide power-sector NOx, but that slice is geographically concentrated enough that it matters greatly in a few states.
The ratio should not be promoted as a stand-alone official EIA series. Its numerator is the arithmetic sum of 50 state observations plus the District of Columbia for the petroleum fuel category, while the denominator is the all-energy-source U.S. profile total. Both come from EIA’s 2024 electric-power data framework, but the calculation here is an analytical comparison. The stronger conclusion is qualitative: petroleum-related NOx is a small national component with a very uneven state footprint.
The zero in the District of Columbia is an observation, not a missing value
There are no missing values in the 51-row file. The District of Columbia is recorded as 0 short tons. Idaho reports 1, Mississippi 3, Nevada 3, and New Mexico 4. Those very small positive values should not be rounded into the zero category, and the zero should not be reinterpreted as missing data. Preserving this distinction matters for ranks, band counts, maps, and any later attempt to combine the emissions data with generation or plant characteristics.
Small differences at the bottom of the ranking should also be interpreted conservatively. EIA power-sector emissions are annual estimates and reported values, not a claim that every one-ton difference between low-emission states is environmentally meaningful. The dominant patterns are much larger: the extreme Hawaii and Alaska values, the sharp mean-median gap, and the rapid accumulation of the top-ranked jurisdictions.
NOx totals are not the same as air-quality impacts, and they are not interchangeable with CO₂
NOx refers to nitrogen oxides produced during combustion. These pollutants participate in atmospheric chemistry that contributes to ground-level ozone and particulate matter, but state emissions totals do not directly measure human exposure or health effects. The location and height of sources, weather, chemistry, transport, and population distribution all matter. This dataset is best used to compare the scale and geography of a particular emissions source, not to rank states by air-quality damage.
NOx also behaves differently from carbon dioxide as an emissions metric. CO₂ from fuel combustion is strongly related to fuel carbon content and the amount burned. NOx depends more heavily on combustion conditions, equipment type, and control technologies. EIA’s Electric Power Annual publishes uncontrolled NOx emission factors by fuel and combustion configuration as well as reduction factors for technologies such as low-NOx burners and selective catalytic reduction. Petroleum generation therefore cannot be converted to NOx with one universal state-level factor without additional plant information.
Data definition and calculation method
The primary dataset is the U.S. Energy Information Administration State Electricity Profiles API route for emissions by state by fuel. The extract fixes frequency to annual, year to 2024, fuel to PET, and the data column to nox-short-tons. It contains 51 numeric observations: the 50 states plus the District of Columbia. Rankings, sums, quartiles, band counts, and cumulative shares in this article are calculated directly from those observations. EIA describes the dataset as emissions from electricity generation and useful thermal output at conventional power plants and combined-heat-and-power plants.
EIA electricity definitions group petroleum liquids and petroleum coke within the Petroleum category. The broader source context can be checked in EIA Historical State Data, the 2024 United States Electricity Profile, and the Electric Power Annual. U.S. petroleum power-sector NOx emissions by state should therefore be read as one clearly bounded power-sector emissions indicator, not as a measure of all petroleum use or all nitrogen-oxide sources in each state.
Frequently Asked Questions
Which state had the highest petroleum-related power-sector NOx emissions in 2024?
Hawaii was highest at 17,081 short tons, followed by Alaska at 7,444. Together they account for about 63.4% of the 51-jurisdiction petroleum NOx sum.
Does this dataset include petroleum NOx from vehicles and refineries?
No. It covers the EIA electric-power scope: emissions associated with electricity generation and useful thermal output at conventional power plants and combined-heat-and-power plants.
What does Petroleum include in the EIA electricity data?
The EIA electricity category includes petroleum liquids and petroleum coke under the published fuel definitions.
Does Hawaii’s number mean it has the highest total power-sector NOx emissions?
No. The ranking is petroleum-specific. Hawaii’s 2024 all-fuel electricity-profile NOx total is 18,131 short tons, while other states can have much larger total NOx from different fuels.
Related Articles
Petroleum-related NOx is an emissions measure, while fuel shares describe electricity-mix composition. These related Green Map articles provide broader fossil-fuel and generation context.
- Fossil-fuel electricity share by country in 2021
- Coal dependence in electricity generation in 2021
- Natural-gas share of electricity generation in 2021
Green Map creates custom-edited map images using open geographic data sources such as geoBoundaries, Natural Earth, OpenStreetMap, and government open data.
These maps are edited visual materials, not raw data files, and are provided for education, documents, presentations, and graphic reference.