Benton County is easiest to understand by starting at Fowler, the county seat near the middle of the map, and then following the roads and small towns outward. The supplied maps show Fowler between Earl Park to the northwest, Boswell and Ambia to the southwest, and Oxford to the southeast. They also separate the county’s dense network of creeks and ditches from a modest but visible 203–277 meter elevation range. High-resolution JPG versions of all four maps are available in the ZIP download below.
The county’s official website identifies Fowler as the county seat and notes U.S. 41 and U.S. 52 among the area’s important highways. That matches the map well: U.S. 52 runs diagonally through Fowler toward Oxford and Templeton, while U.S. 41 appears farther southwest near Boswell. State Road 18 crosses Fowler east to west, giving the central town a strong road junction even though Benton County has no single large urbanized belt.
The physical landscape adds another layer. The elevation map places broad higher ground through the interior and south-central part of the county, while greener lower areas follow the western edge and the eastern drainage corridors. On the water map, Sugar Creek and Upper Sugar Creek dominate the northwestern half, while Big Pine Creek and Little Pine Creek stand out farther east and southeast. Comparing those two maps explains why the county can look like open prairie and still contain meaningful local relief.
Table of Contents
Fowler sits at the county’s clearest road junction
On the general county map, Fowler is the most useful starting point because several major routes meet or pass close to it. State Road 18 runs east-west through the town, while U.S. 52 approaches from the northwest and continues southeast toward Oxford and Templeton. Earl Park lies northwest of Fowler, offset from the diagonal U.S. 52 corridor, while Boswell occupies the southwestern part of the county near U.S. 41.
The southern half becomes easier to read when Boswell and Oxford are treated as two separate anchors. Boswell is west of center and connected to the north-south U.S. 41 corridor. Oxford is farther east, close to the diagonal U.S. 52 route and another north-south road. Ambia sits much closer to the southwest corner, while Otterbein appears just beyond the eastern county line. Those positions show how the county’s incorporated places are spread across a wide rural area rather than merged into one continuous townscape.
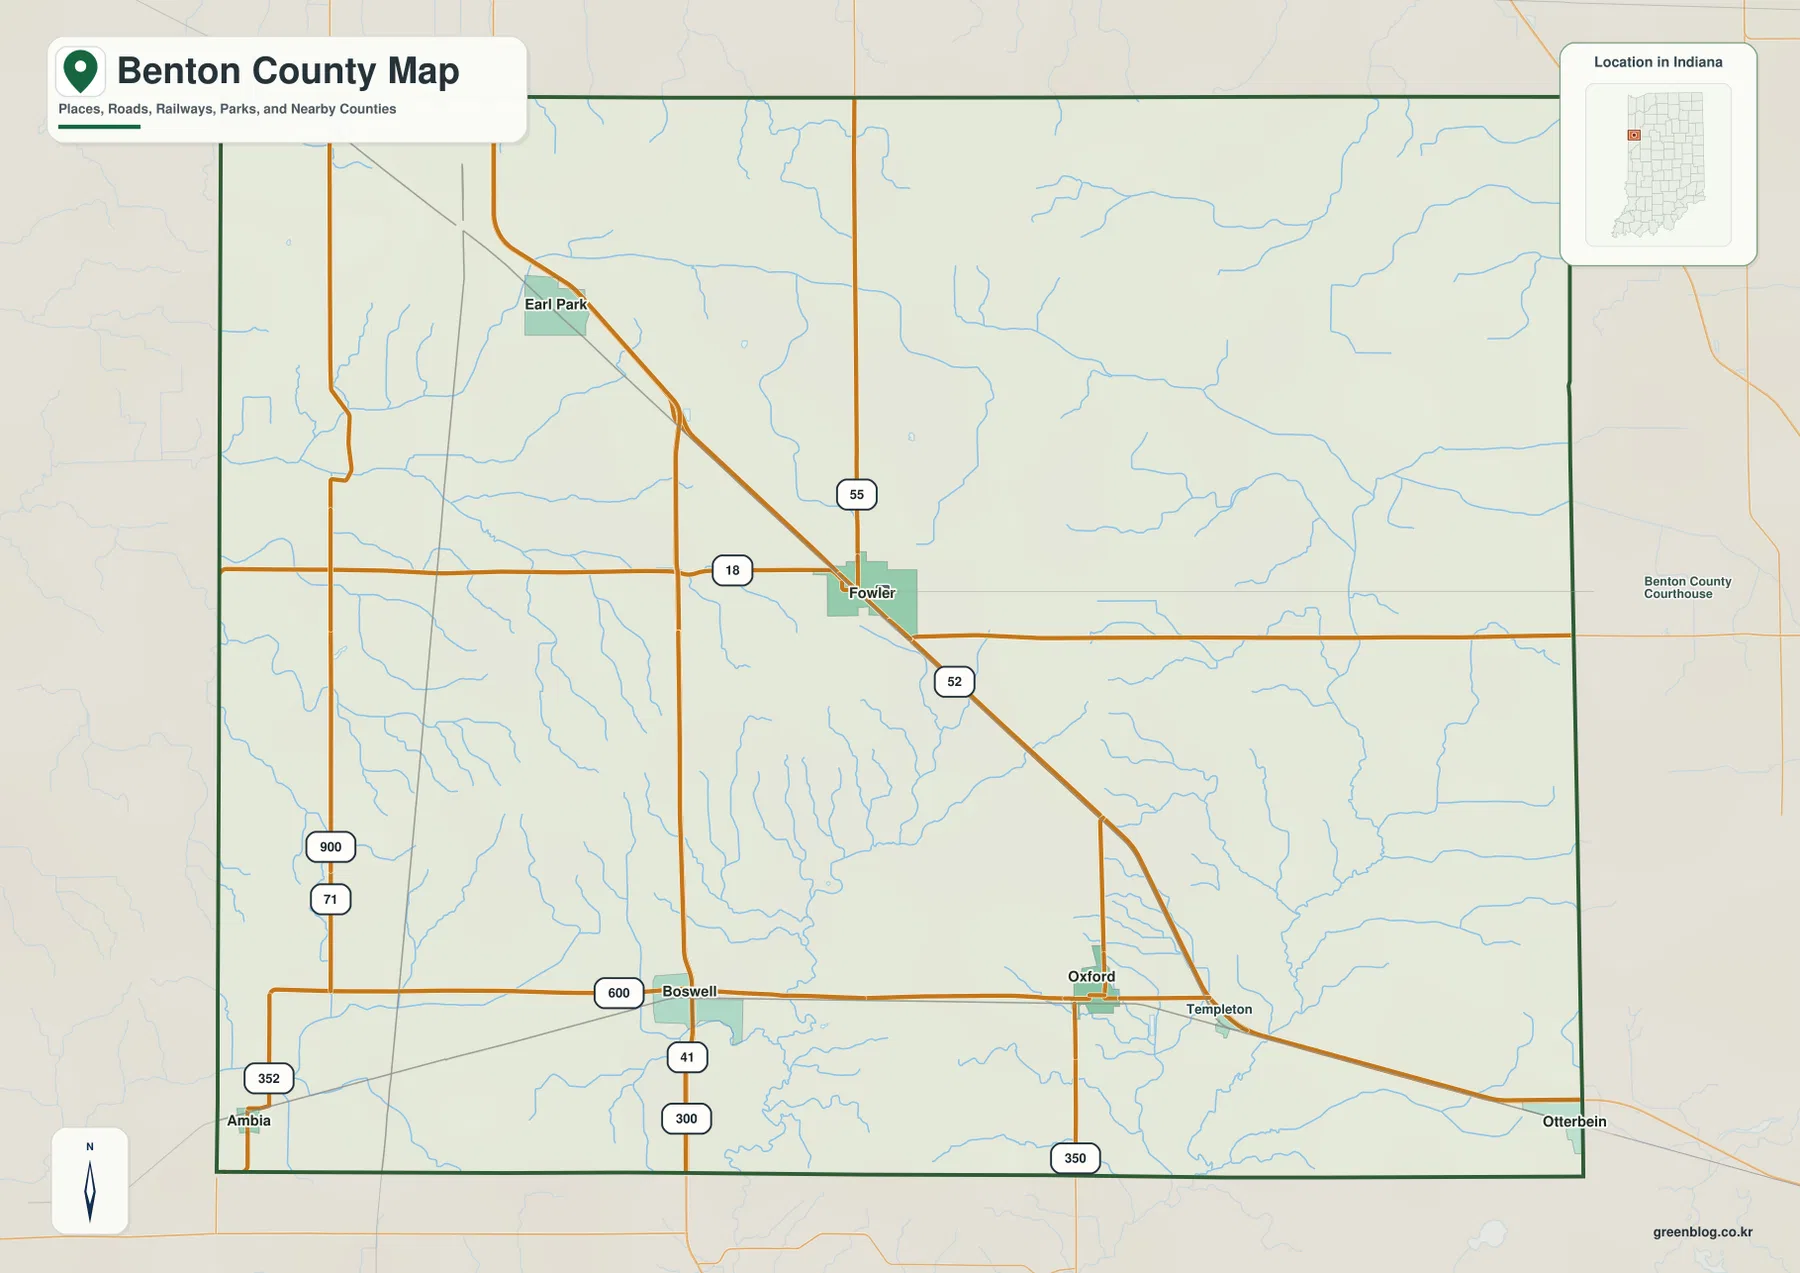
The northern half contains fewer large place labels and more open space crossed by streams and local roads. That visual difference helps explain why Fowler is such a practical orientation point: once it is found, the diagonal route to Oxford, the western route toward Earl Park, and the southwestern direction toward Boswell are easy to separate. The map is useful for county-scale orientation, but it is not meant to replace turn-by-turn navigation or current road-condition information.
A simple way to read the map is to trace State Road 18 across Fowler first, then follow U.S. 52 southeast to Oxford. After that, locate Boswell and U.S. 41 in the southwest and Earl Park in the northwest. This sequence reveals the county’s basic settlement pattern without requiring every smaller road to be read at once.
Three towns sit about seven straight-line miles from Fowler
The city-connections map strips away most road detail and measures direct distance from Fowler. Boswell, Oxford, and Earl Park are each shown at about 7 miles from the hub. Their distances are similar, but their directions are not: Boswell lies southwest, Oxford southeast, and Earl Park northwest. Together they form a loose ring around Fowler rather than a single line of settlement.
Ambia is different. It is shown about 14 straight-line miles from Fowler and sits near the far southwestern edge of the county. That makes it a useful reminder that the southern and western parts of Benton County extend well beyond the compact 7-mile group around the county seat. The city map therefore emphasizes spacing more clearly than the general road map does.
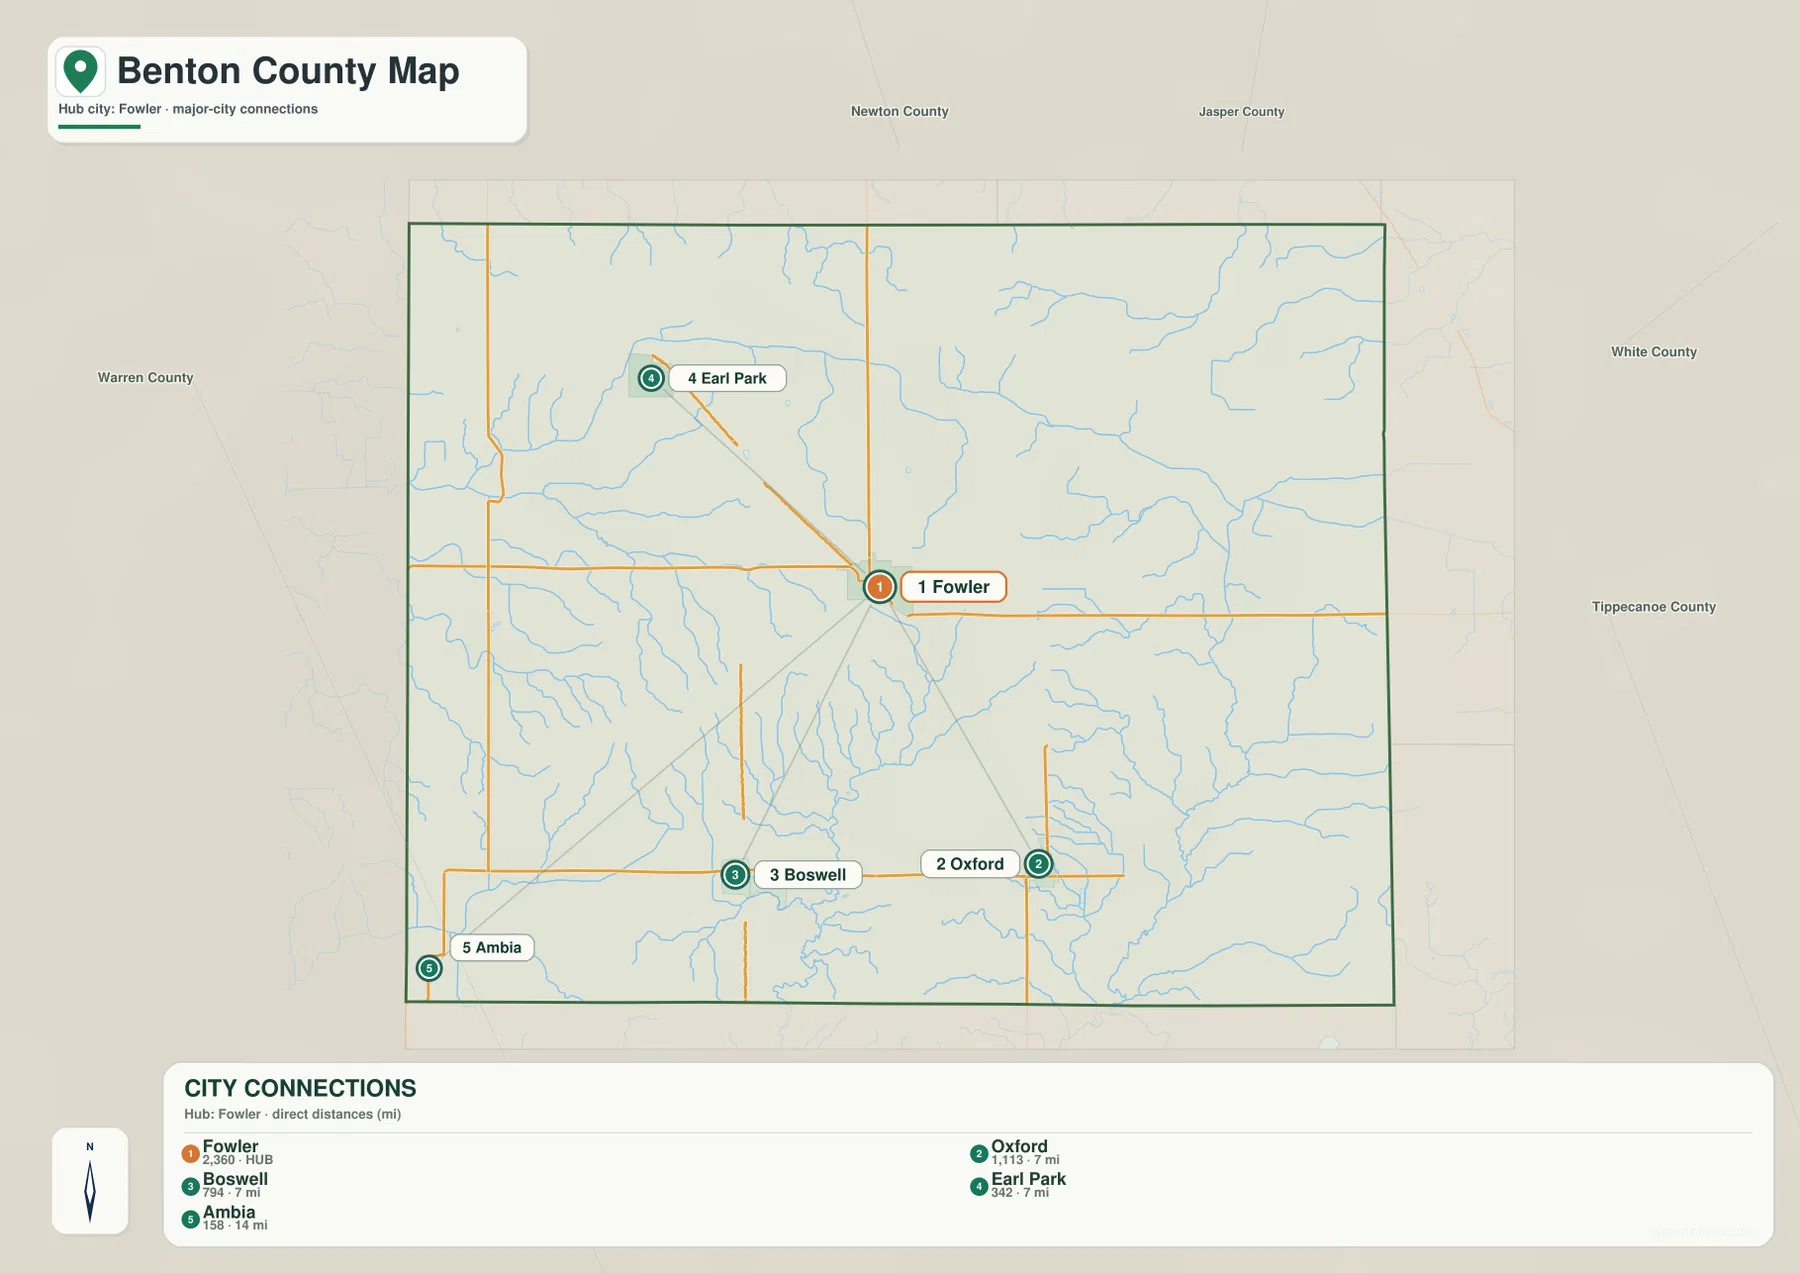
The figures printed on this map are direct distances, not driving miles. A real road trip may be longer because the road network does not follow a perfect straight line. The map also includes a city index, but that index should not be reinterpreted here as a current census count. Its strongest value is geographic: it makes the relative position of the county’s main small towns easy to compare.
For a presentation focused on communities, this is the cleaner choice because the eye does not have to sort through road shields and minor drainage lines. When the route between those places matters, the general county map is the better companion. Looking at both maps together shows why Fowler works as a hub even though Benton County’s towns remain widely separated.
Sugar Creek in the northwest and Pine Creek branches in the east
The terrain-and-water map reveals a county divided among several drainage lines rather than organized around one dominant river. Sugar Creek runs across the northwestern side, with Upper Sugar Creek continuing the system farther east. Mud Creek branches through the western half, while Carpenter Creek is labeled near the north and northeast.
The eastern and southeastern side has a different set of names. Big Pine Creek and Little Pine Creek are the most prominent channels there, joined by several smaller ditches and tributaries. Brown Ditch, Greenwood Ditch, and Harrington Ditch are among the labeled features. The mix of named creeks and ditches is especially characteristic of the map and reflects a fine-grained drainage network across the county.
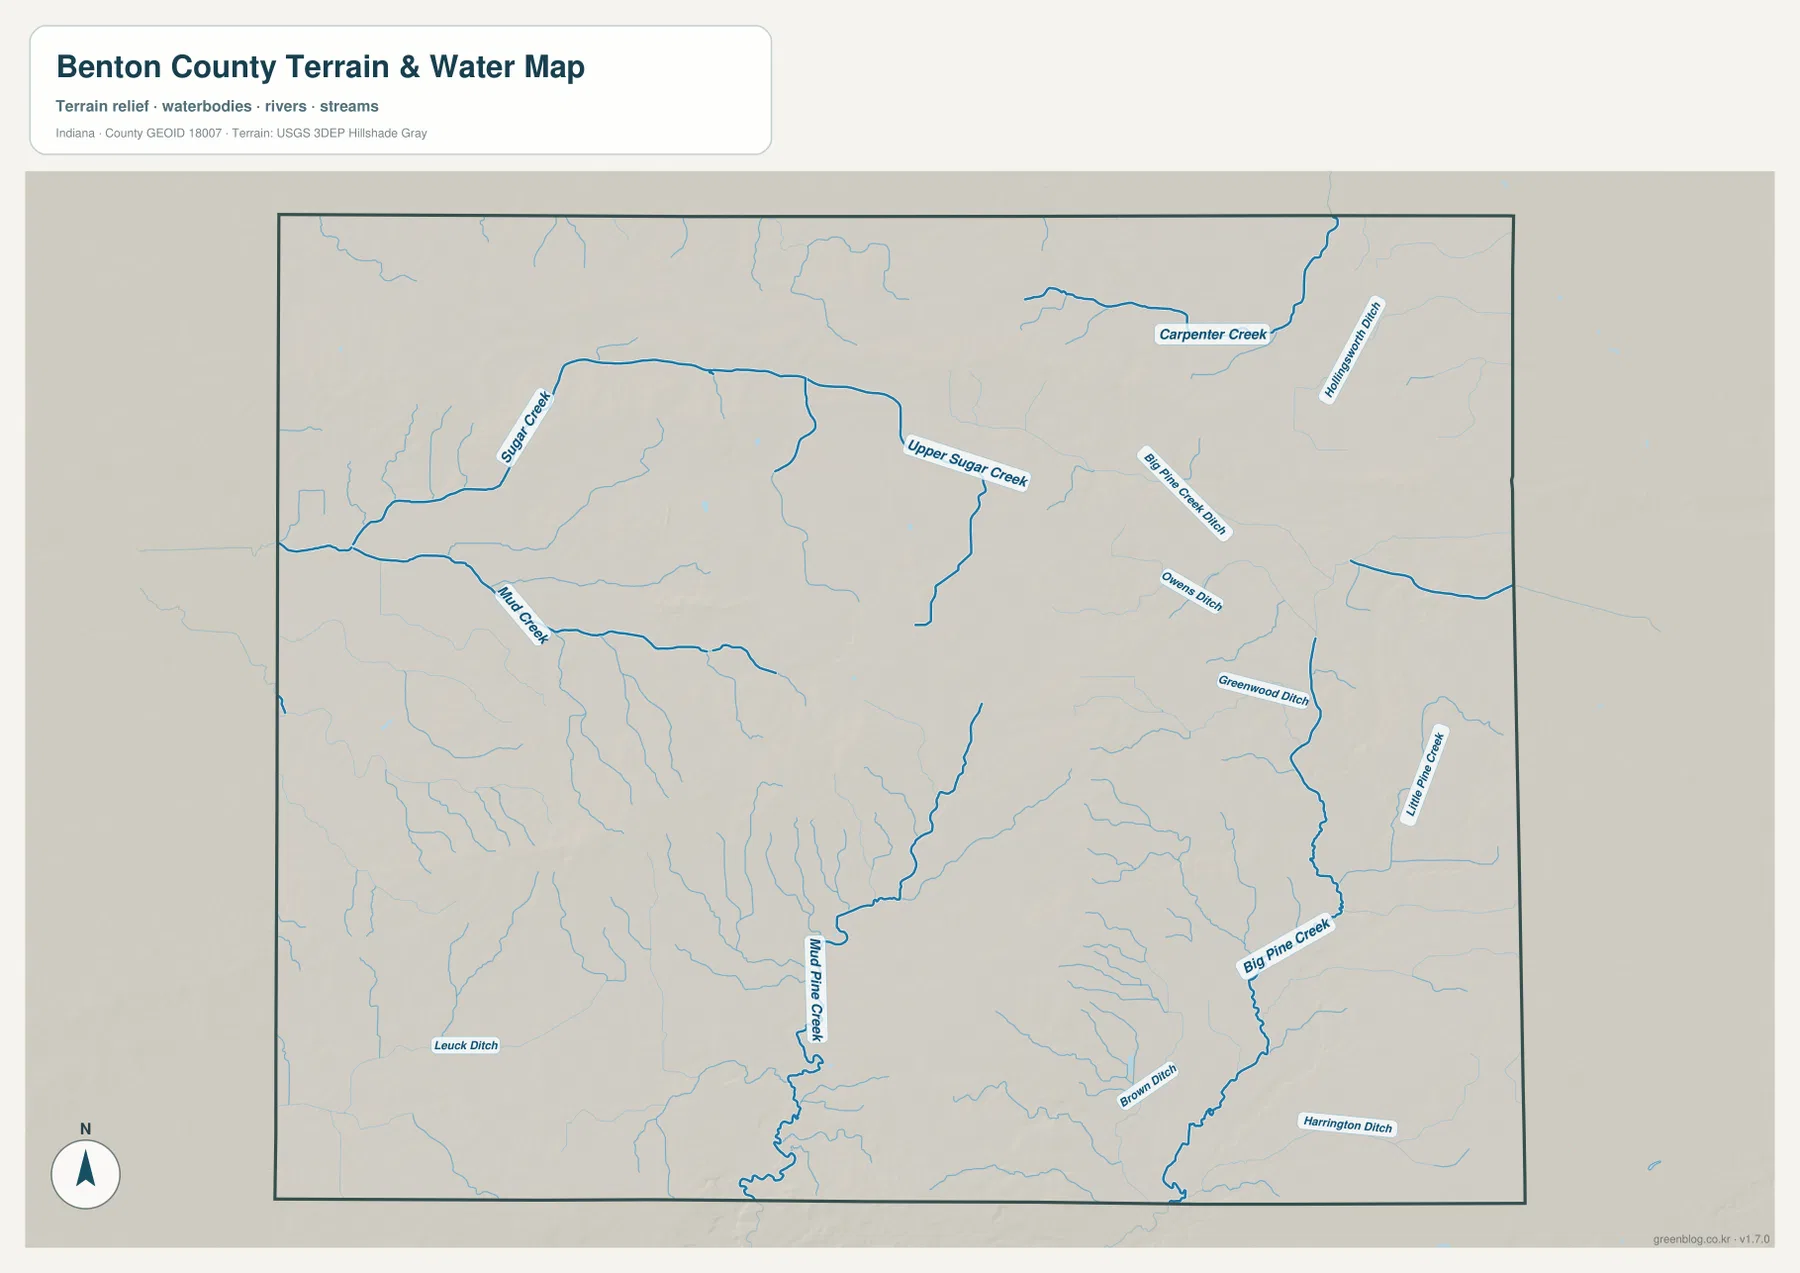
The important pattern is the separation between drainage systems. The northwestern creeks do not form one obvious countywide trunk with the Pine Creek branches in the east. Instead, the central higher ground sits between lower drainage corridors, so water leaves different parts of the county in different directions. This relationship becomes much easier to see once the elevation map is placed beside the water map.
This is a reference map of visible waterways and terrain, not a flood-risk product. It does not establish flood zones, drainage easements, legal ditch boundaries, water depth, navigability, or parcel ownership. Those questions require current official maps prepared for the specific legal or safety purpose involved.
A 203–277 m surface with higher ground through the interior
The supplied elevation map gives Benton County an actual mapped range of about 203 to 277 meters and a mean near 231 meters. A 74-meter spread is modest compared with mountainous counties, yet the colors show a clear structure. Broad orange and brown areas occupy much of the interior and south-central part of the county, and another higher belt extends across the north-central area.
Lower ground appears along both sides of that interior upland. The western edge is broadly green, while the eastern and southeastern drainage corridors also drop into green shades around the Pine Creek system. The result is not a simple west-to-east slope. Instead, Benton County has a gently elevated interior broken by lower stream valleys and lower margins on more than one side.
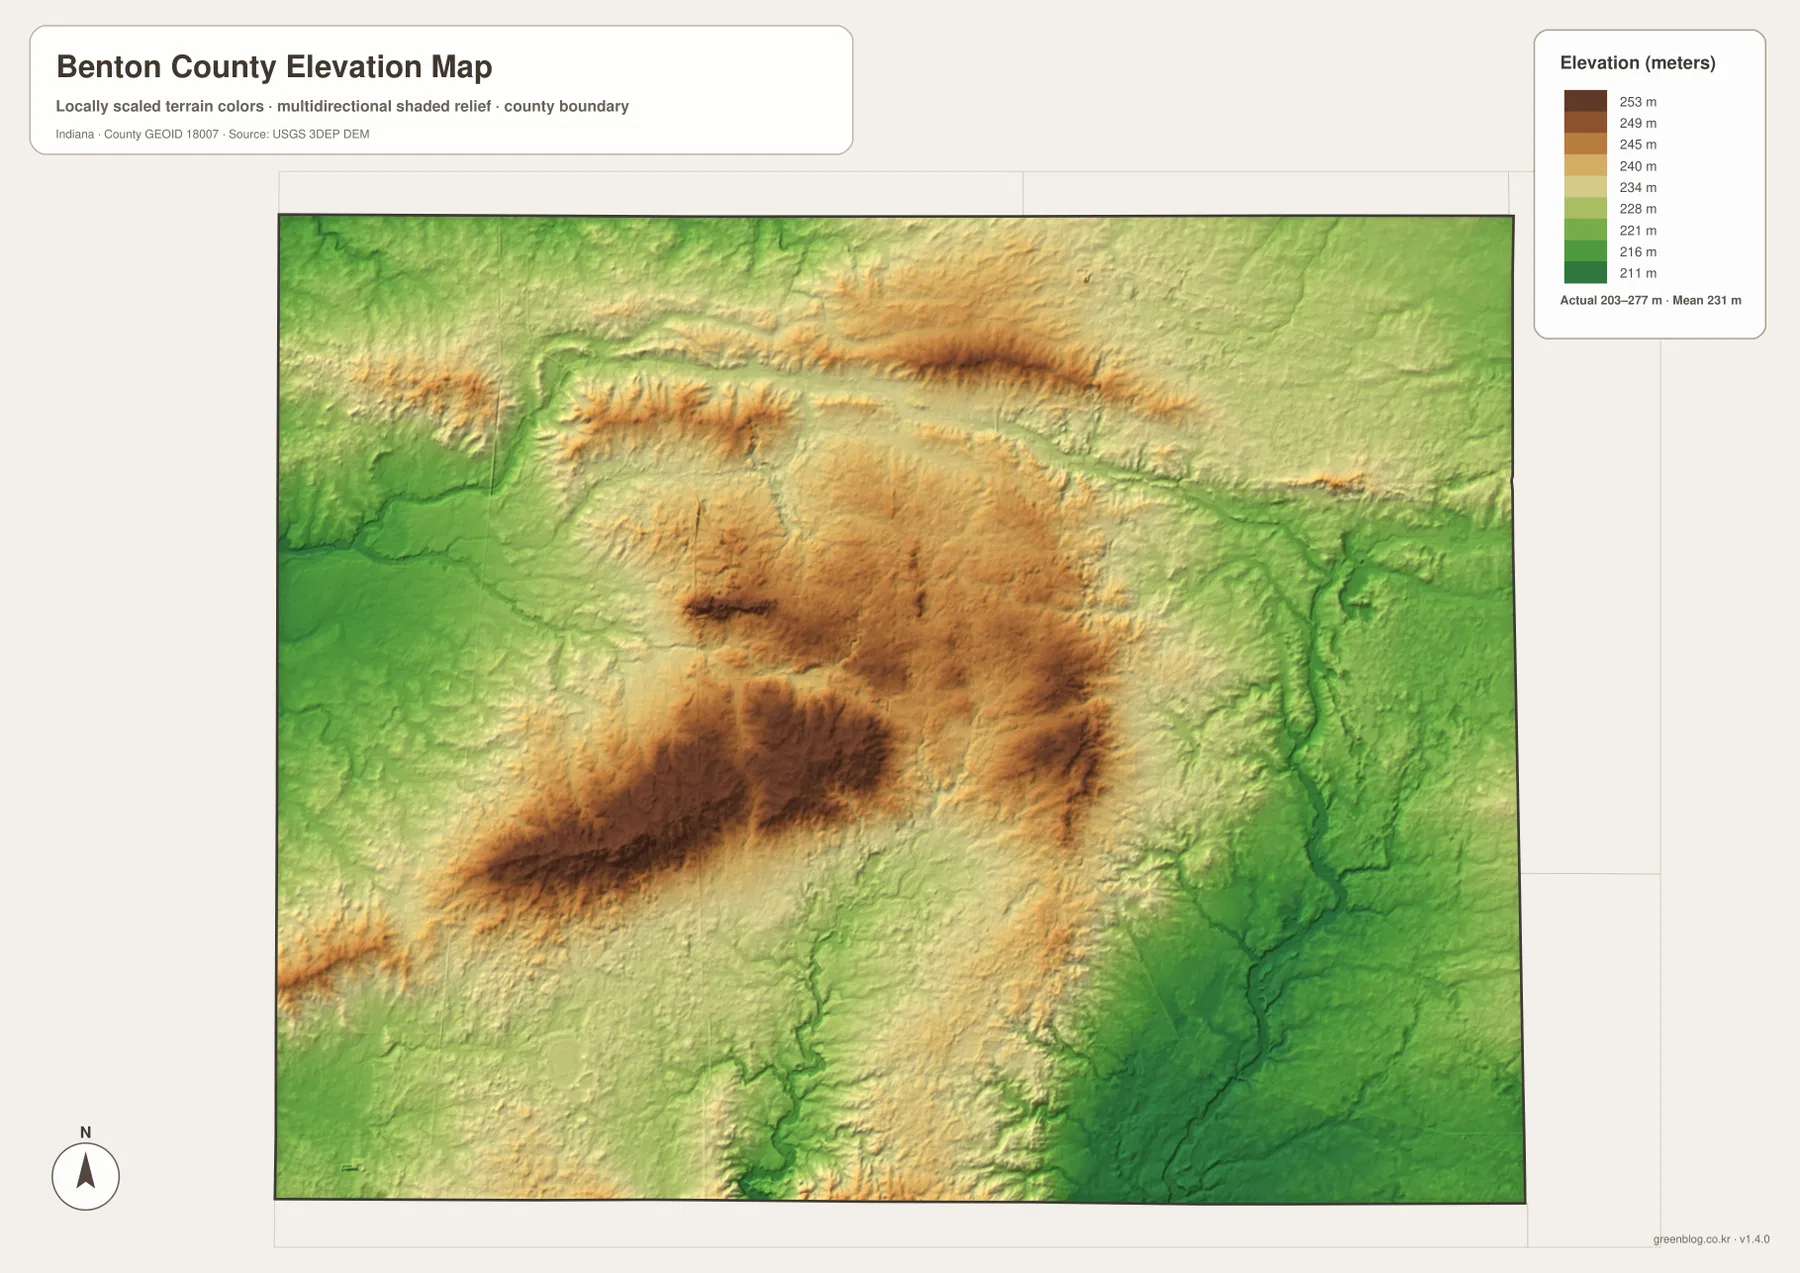
The brown areas should not be read as mountain terrain. They represent broad uplands and rolling rises that stand above nearby creek and ditch valleys. Likewise, the green areas are lower drainage ground rather than deep canyons. This distinction matters because the elevation map is designed to show relative height across the county, not to exaggerate small differences into dramatic landforms.
The map is also generalized for county-scale reading. It is useful for comparing Fowler’s surroundings with the western and eastern drainage margins, but it does not provide survey-grade elevation at a property, road, or construction site. Engineering, drainage design, and site planning require finer official elevation data and often field measurement.
Which Benton County map should you use?
Use the general county map when you need the fullest orientation. It places Fowler, Boswell, Oxford, Earl Park, Ambia, road shields, county boundaries, and many drainage lines on one page. It is the best starting point for understanding how U.S. 52 crosses the county diagonally and how U.S. 41 serves the southwestern area around Boswell.
The city-connections map is better for comparing the communities without extra visual clutter. It makes the 7-mile straight-line relationship between Fowler and Boswell, Oxford, and Earl Park immediately clear and shows Ambia as the more distant southwestern place at about 14 miles. The water map serves a different purpose: it is the easiest way to trace Sugar Creek, Upper Sugar Creek, Big Pine Creek, Little Pine Creek, and the many smaller ditches.
Choose the elevation map when the question is why those drainage lines occupy different corridors. The 203–277 meter surface shows broad higher ground through the interior and lower zones along the margins and creek valleys. Using the water and elevation maps together is especially helpful because one names the channels while the other shows the relative height around them.
The WebP images on this page are optimized for online viewing. The downloadable ZIP contains the same four themes as high-resolution JPG files, each 3638 × 2572 pixels. The larger originals are more convenient for printing, classroom use, and presentations where labels need to stay legible, but they remain general reference maps rather than legal surveys, flood determinations, or engineering plans.
Frequently Asked Questions
How far are Boswell, Oxford, and Earl Park from Fowler on the city map?
All three are shown at about 7 miles from Fowler in direct straight-line distance. Boswell is southwest, Oxford southeast, and Earl Park northwest. Ambia is farther away at about 14 miles. These are not road-trip distances, so actual driving mileage and travel time can be longer.
What does the elevation map add to the creek map?
The water map identifies Sugar Creek, Upper Sugar Creek, the Pine Creek branches, and smaller ditches. The elevation map explains the terrain around them by showing higher interior ground and lower drainage corridors. With an actual mapped range of about 203 to 277 meters, the county has enough relief for those stream valleys to stand out even though the landscape is not mountainous.
Can the water map be used as a flood or parcel map?
No. It is a county-scale reference for relative waterway location and terrain. It does not show official flood zones, parcel ownership, legal drainage boundaries, water depth, or real-time conditions. Use the appropriate current government source for legal, property, drainage, or flood decisions.
Map File Information
Download the high-resolution JPG originals for the Benton County general map, city-connections map, terrain-and-water map, and elevation map in one ZIP archive.
- Included Files: 4 high-resolution JPG maps
- Printable Size: 3638 × 2572 px each
Related Maps
Sources and References
- Benton County, Indiana official overview – county seat and local context
- Benton County official living and location page – U.S. 41, U.S. 52, and transportation context
- U.S. Census Bureau TIGER/Line Shapefiles – county boundaries, roads, and place reference data
- USGS National Hydrography – rivers, creeks, and water features
- USGS 3D Elevation Program – elevation data
Green Map creates custom-edited map images using open geographic data sources such as geoBoundaries, Natural Earth, OpenStreetMap, and government open data.
These maps are edited visual materials, not raw data files, and are provided for education, documents, presentations, and graphic reference.