A North Dakota Map becomes more interesting once its 53 counties are viewed inside the state’s nearly rectangular frame. Much of the eastern and central pattern resembles a grid, but the western counties widen, the Missouri River system bends through several boundaries, and the Red River side forms an uneven edge beside Minnesota. These contrasts make a county map useful for more than locating the state: it shows how regular survey lines and major water features share the same administrative layout.
The map collection contains three matching county views. A color map separates adjoining counties with muted pastel fills, a black-and-white map retains every county name, and a blank outline removes the labels while keeping the internal divisions. All three published previews measure 1,200 × 848 pixels and use the same landscape composition, allowing a reference page and an exercise sheet to be placed side by side without rescaling one version differently.
Canada appears above the state, Montana to the west, Minnesota to the east, and South Dakota below. Roads, cities, elevation, and a distance scale are absent from the maps, so their strongest role is county identification and regional comparison. Teachers can build labeling activities, researchers can connect a county table to the labeled version, and designers can use the outline as a base for custom categories with their own documented source.
Table of Contents
Included Map Versions
Each North Dakota Map uses the same county geometry, surrounding labels, and water shapes, but the visual information changes from one file to the next. That consistency lets readers study with the labeled maps and then test recall with the outline. It also makes it easier to replace a color figure with a monochrome one in a report without changing the surrounding page design.
- Color county view: pastel fills distinguish adjacent counties while labels and pale-blue water features remain visible.
- Black-and-white labeled view: county names and boundaries remain, but the fills are removed for a quieter document style.
- Blank county outline: names and colors disappear, leaving the state shape, county divisions, and selected water outlines.
The visible county pattern changes from west to east. McKenzie, Dunn, McLean, and other western or central counties occupy broad areas, whereas Griggs, Steele, Traill, and several eastern counties form smaller blocks. Lake Sakakawea’s branching shape is especially noticeable across the west-central map, while Devils Lake and nearby waters interrupt the otherwise rectilinear pattern around Ramsey, Benson, and Nelson counties.
Color North Dakota Map for County Comparison
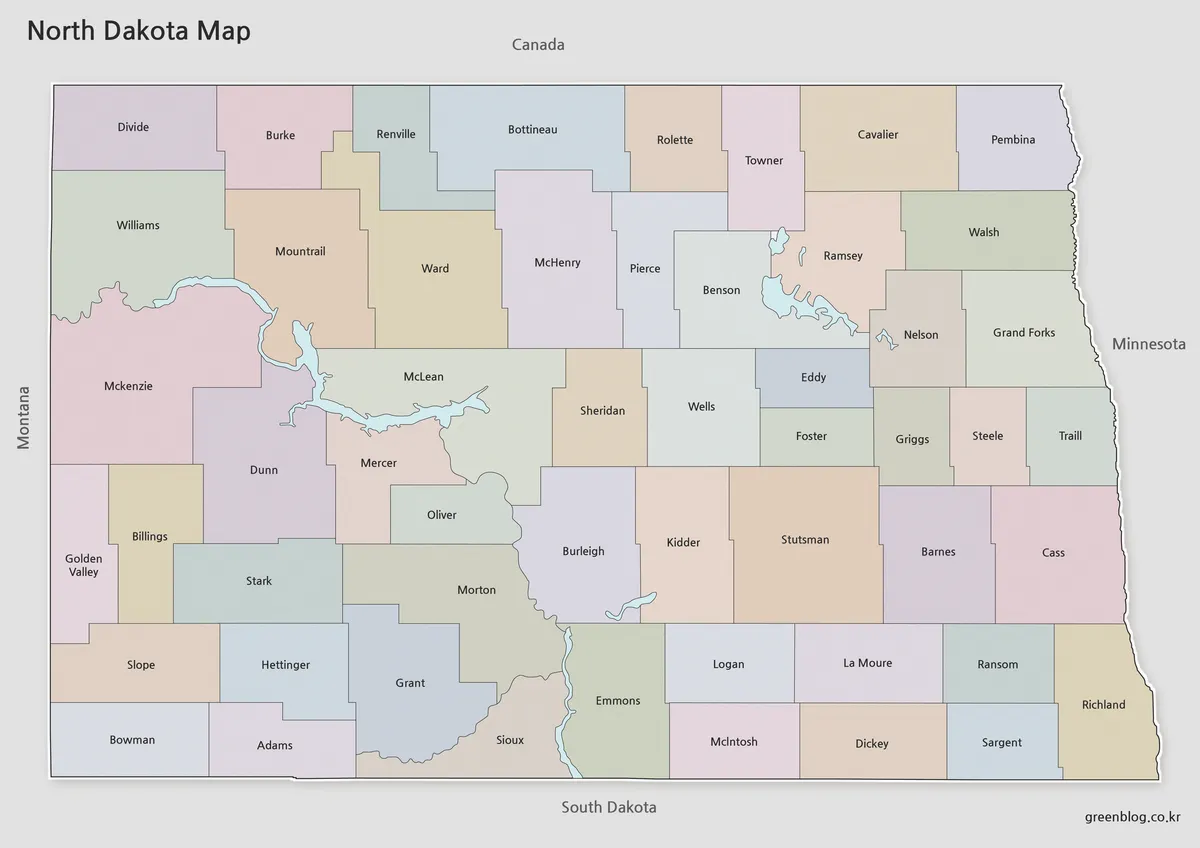
Color separation is most helpful where straight boundaries create rows of similarly shaped counties. The pastel palette keeps Burke, Renville, Bottineau, Rolette, Towner, Cavalier, and Pembina distinct along the Canadian border, while the central and southeastern blocks can be followed without losing their individual outlines. Pale-blue water adds a second visual cue without turning the image into a physical or hydrographic map.
This version suits an introductory slide, a county reference sheet, or an answer key beside the blank map. The colors are not a legend for population, agriculture, elections, geology, or land use; they simply separate neighboring units. Any overlaid dataset needs a clearly labeled scale or symbols that cannot be confused with the original fills.
Black and White North Dakota Map for Printing
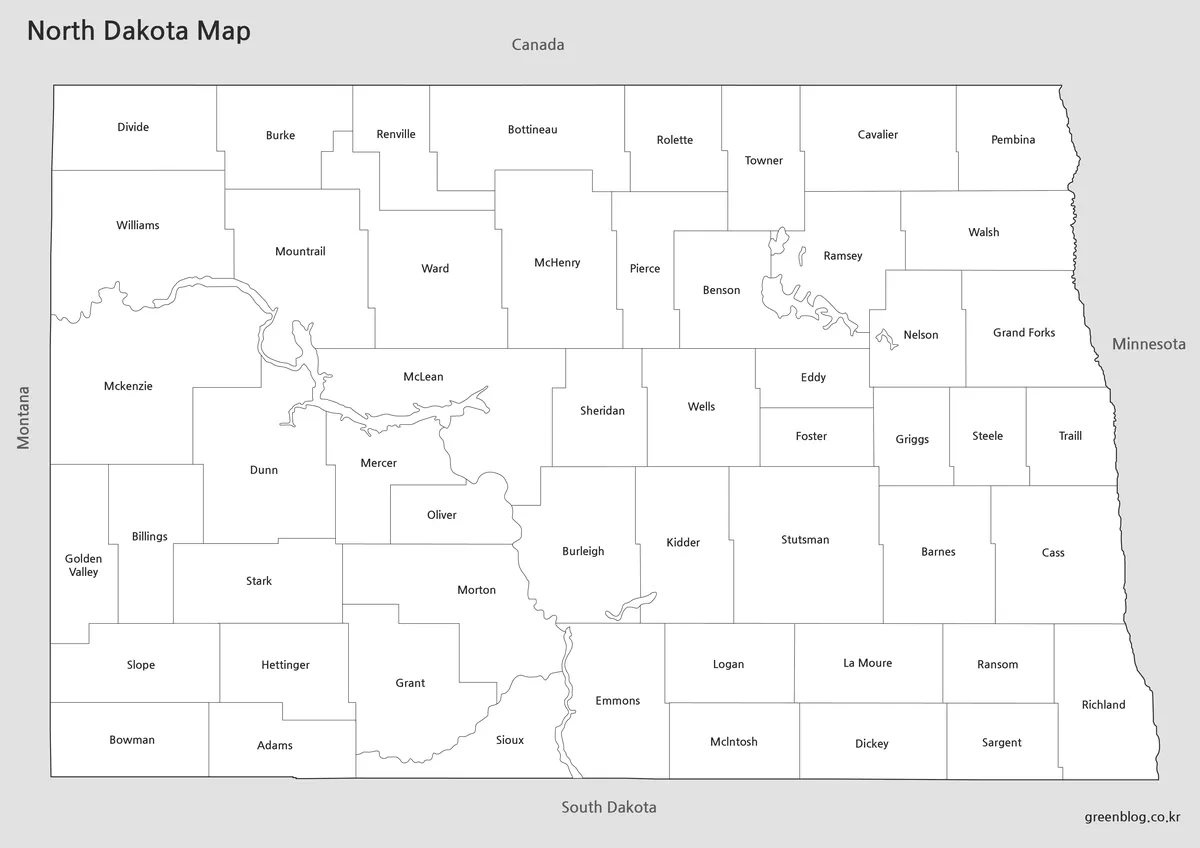
Removing the pastel fills places more attention on county names and boundary lines. The monochrome view is appropriate for office documents, photocopied worksheets, and study packets where the labels must remain readable without depending on color. Its white county interiors also accept pencil notes and highlighter marks more cleanly than the color version.
Small eastern labels such as Griggs, Steele, and Traill are useful print checkpoints, while Golden Valley’s two-line name tests legibility near the western edge. The 1,200 × 848 aspect ratio preserves the intended geometry, while a proof at the intended size gives the clearest indication of how well small labels survive reduction. Repeated compression can also soften the narrow water outlines and fine county lines.
Blank North Dakota Outline Map for Editing
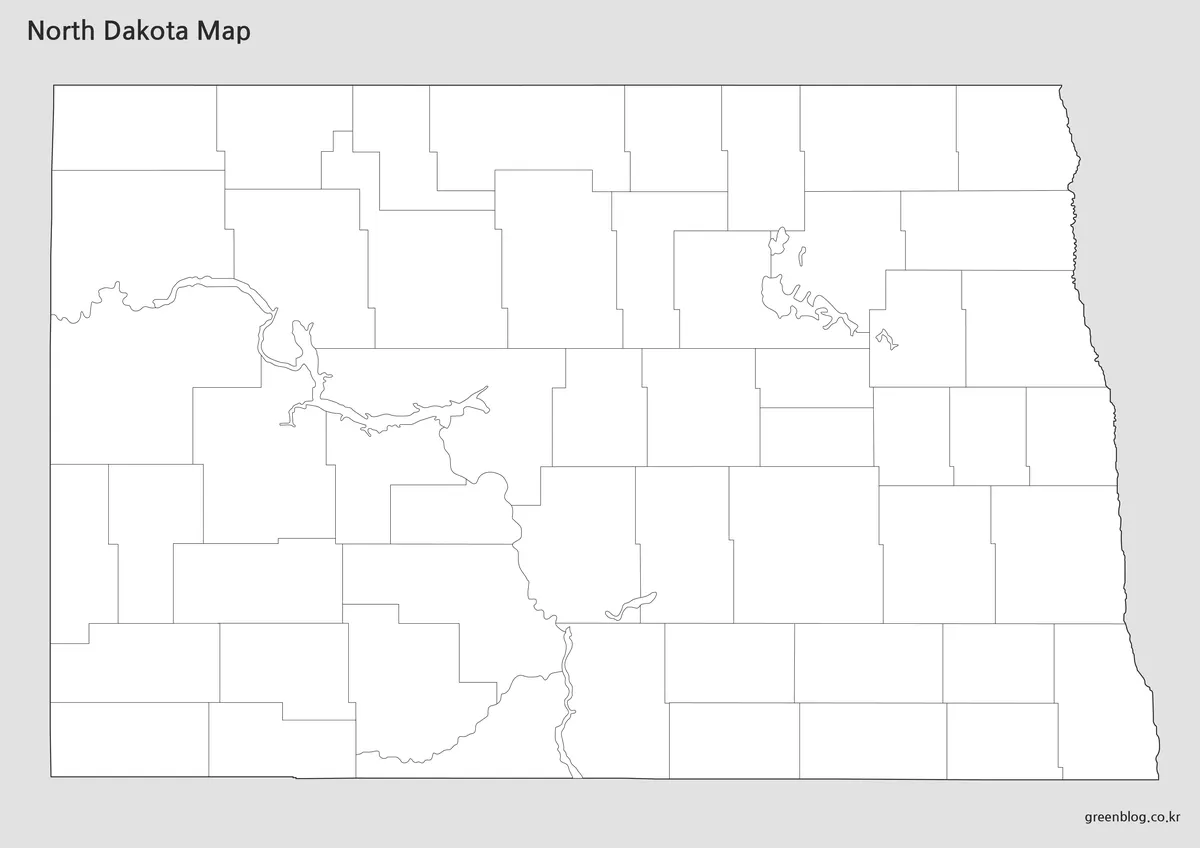
The blank North Dakota Map preserves all county divisions while removing the names and color cues. Students can label the 53 counties, identify the four bordering jurisdictions, or shade counties along the Canadian line. A data project can instead add county values, symbols, or grouped regions without first covering printed text.
This preview is a flat raster image rather than a confirmed vector or layered source file. Enlargement beyond the available pixel dimensions may soften the thin lines. Added information needs its own source date and legend. The irregular water shapes help readers orient McKenzie, McLean, Mercer, Dunn, Ramsey, Benson, and neighboring counties.
Practical Uses for a North Dakota Map
Each version suits a different reading task. Color gives the fastest county separation on a screen, monochrome keeps names visible in a restrained report, and the outline leaves the most room for recall or custom categories. A labeled view is the safer starting point when discussing the state’s west-to-east pattern, while the blank file is better when identification is part of the assignment.
- The color reference and outline form a useful pair for a 53-county labeling exercise.
- Border relationships are easy to compare when the counties touching Canada, Montana, Minnesota, or South Dakota are highlighted.
- The monochrome image works well beside a table, with short numbered callouts connecting selected counties.
- A separate United States locator map can provide national context for audiences unfamiliar with the state’s northern Great Plains position.
The maps can support classroom geography, county comparisons, presentation graphics, and carefully sourced thematic projects, but they are not route-planning documents. No highways, cities, travel times, or terrain categories are present. Current navigation or administrative decisions require an appropriate official source with boundaries and labels verified for the relevant date.
Frequently Asked Questions
Can I print the North Dakota Map in A3 size?
Yes. Every version was prepared in high resolution and reviewed for large-format printing, including A3 paper.
Which North Dakota Map is best for presentations?
The color version is recommended because county boundaries are easier to distinguish when displayed on presentation slides.
Is the outline North Dakota Map editable?
Yes. The outline version contains only county boundary lines, making it suitable for graphic editing, annotations, and custom infographic projects.
Which version works best for black and white printing?
The black and white map was specifically prepared for monochrome printing while keeping county names and boundaries easy to read.
Map File Information
The color, labeled monochrome, and blank county views cover reference, worksheet, presentation, and annotation tasks, with each version emphasizing different information.
- Included Versions: Color · Black and white · Outline
- File Type: Image files
- Intended Use: County reference, classroom activities, presentations, and annotation
Related Maps
Additional Resources
- North Dakota Visitor Maps and Guides — The state’s official tourism page provides visitor maps, regional guides, and transportation information.
Green Map creates custom-edited map images using open geographic data sources such as geoBoundaries, Natural Earth, OpenStreetMap, and government open data.
These maps are edited visual materials, not raw data files, and are provided for education, documents, presentations, and graphic reference.