A Mississippi Map has two immediately recognizable edges: the winding western boundary associated with the Mississippi River and the short Gulf Coast at the state’s southern end. Between them, 82 counties form a dense north-to-south pattern. The supplied collection presents that framework as a pastel color map, a labeled black-and-white map, and an unlabeled county outline.
The images concentrate on county geography rather than cities, roads, terrain, or statistical data. County names appear in the first two views, while the third leaves blank interiors for labels, colors, routes, or project data. Small offshore shapes are also retained below the Gulf Coast, helping the state silhouette remain more complete than a simplified rectangular outline.
Mississippi borders Tennessee to the north, Alabama to the east, Louisiana to the southwest, Arkansas to the northwest, and the Gulf of Mexico to the south. Those surrounding names are not printed in the artwork, so the Mississippi Map should be read primarily as an internal county reference. Its river bends, coastal edge, and county divisions supply the main orientation cues.
Table of Contents
One County Framework in Three Versions
All three published previews measure 1200 × 1434 pixels and use matching county geometry. The color and monochrome images label every county, including narrow western counties beside the irregular state edge and the compact group near the Gulf. The outline preserves the same boundaries but removes the words and fills, so users can move between reference and activity versions without relearning the layout.
The download is identified as a set of JPG files prepared for A3 printing and packaged in a ZIP archive. The website previews are WEBP images, which is separate from the confirmed download type. The supplied materials do not establish PNG, PDF, SVG, transparent-background, layered, or editable vector files, and the article does not promise those formats.
Reading 82 Counties on a Mississippi Map
The northern row begins with DeSoto and reaches east through Marshall, Benton, Tippah, Alcorn, and Tishomingo. Just below it, Tunica, Tate, Panola, Lafayette, Union, Pontotoc, Lee, and Itawamba illustrate how quickly the county pattern changes from the river side to the Alabama boundary. These labeled tiers are useful starting points for a top-to-bottom identification exercise.
On the western side, Coahoma, Bolivar, Washington, Issaquena, Warren, Claiborne, Jefferson, Adams, and Wilkinson follow sections of the state’s irregular edge. Their outlines contrast with the straighter eastern boundary counties such as Monroe, Lowndes, Noxubee, Kemper, Lauderdale, Clarke, Wayne, Greene, George, and Jackson. The difference helps readers recognize which side of the map they are viewing even before all names are learned.
Central Mississippi contains another useful anchor: Hinds County, with Madison and Rankin nearby. The supplied map does not mark Jackson or other cities, but these county positions help users prepare a separate city or transportation overlay. Farther south, Pearl River, Stone, George, Hancock, Harrison, and Jackson counties lead to the coast, where several narrow offshore shapes appear beneath the mainland.
Pastel Color Across the County Grid
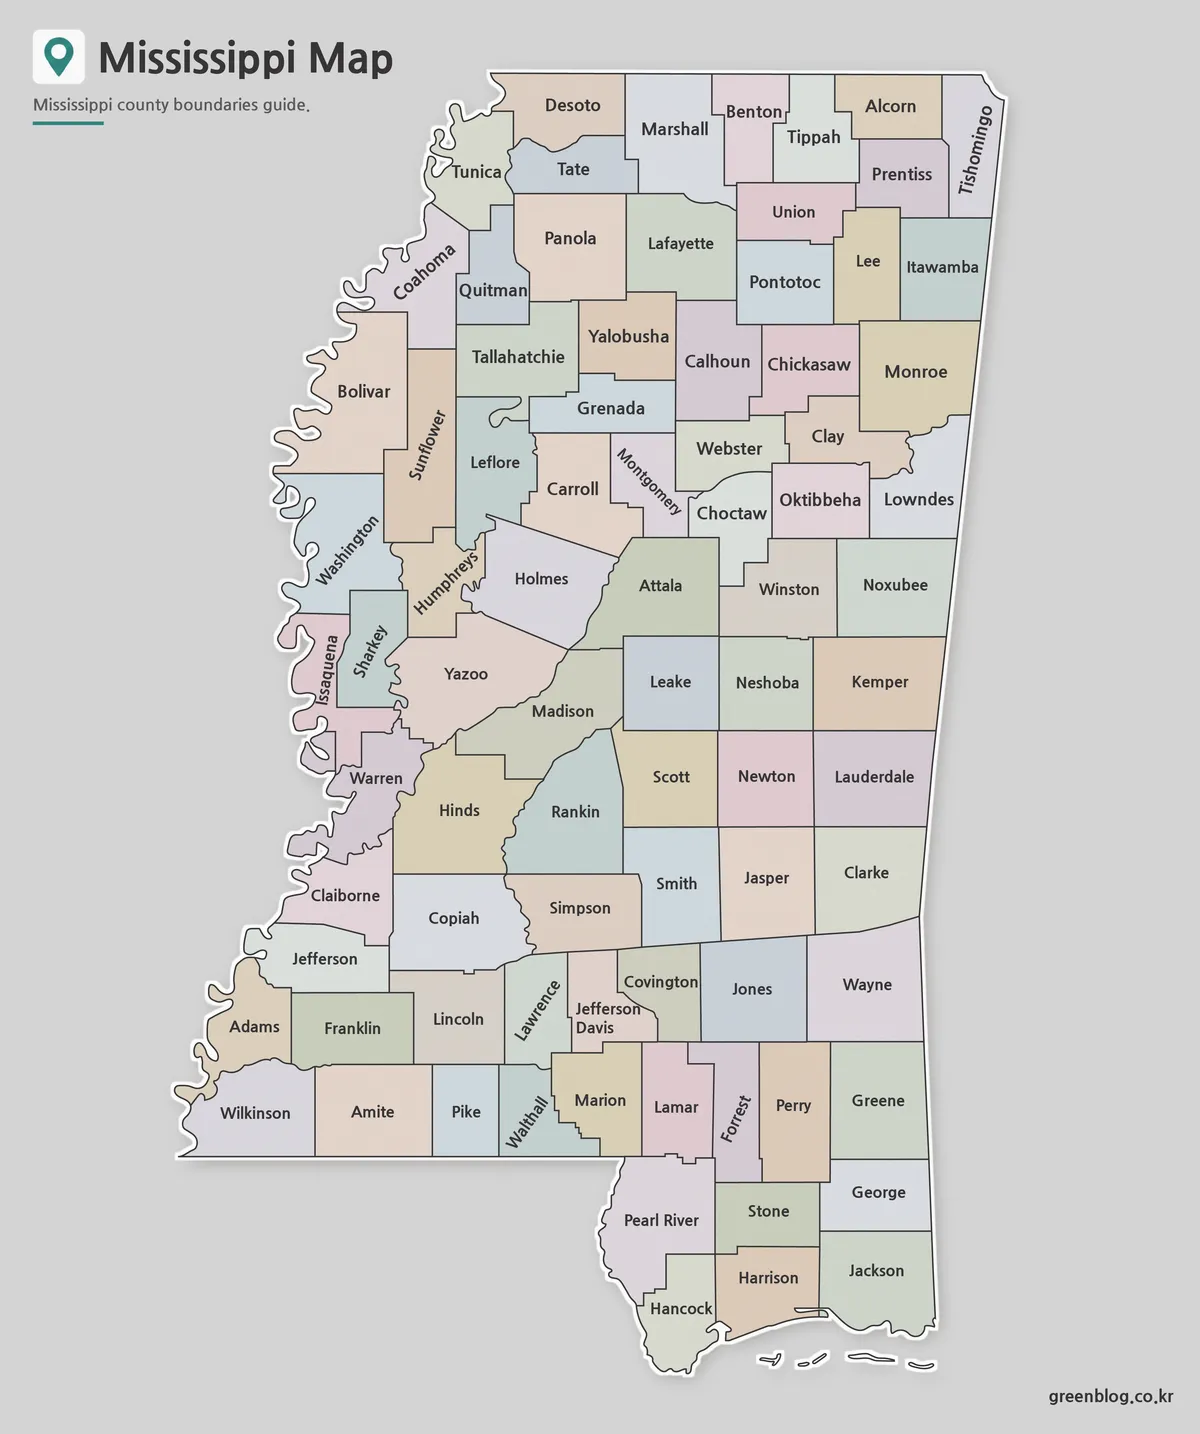
The color Mississippi Map uses pale contrasting fills to distinguish neighboring counties while keeping the names dark. The palette is decorative and does not encode population, elections, agriculture, industry, or any other dataset. This is important when the image is used in a presentation, because viewers should read the colors as boundary aids rather than a thematic legend.
Color separation is especially helpful where multiple small or angled boundaries meet, such as around Montgomery, Choctaw, Webster, Clay, and Oktibbeha or among the lower counties near Jefferson Davis, Covington, Jones, Marion, Lamar, Forrest, and Perry. A presenter can trace a regional group without losing the county edges, and students can compare shapes before attempting the blank version.
County Labels for Monochrome Documents
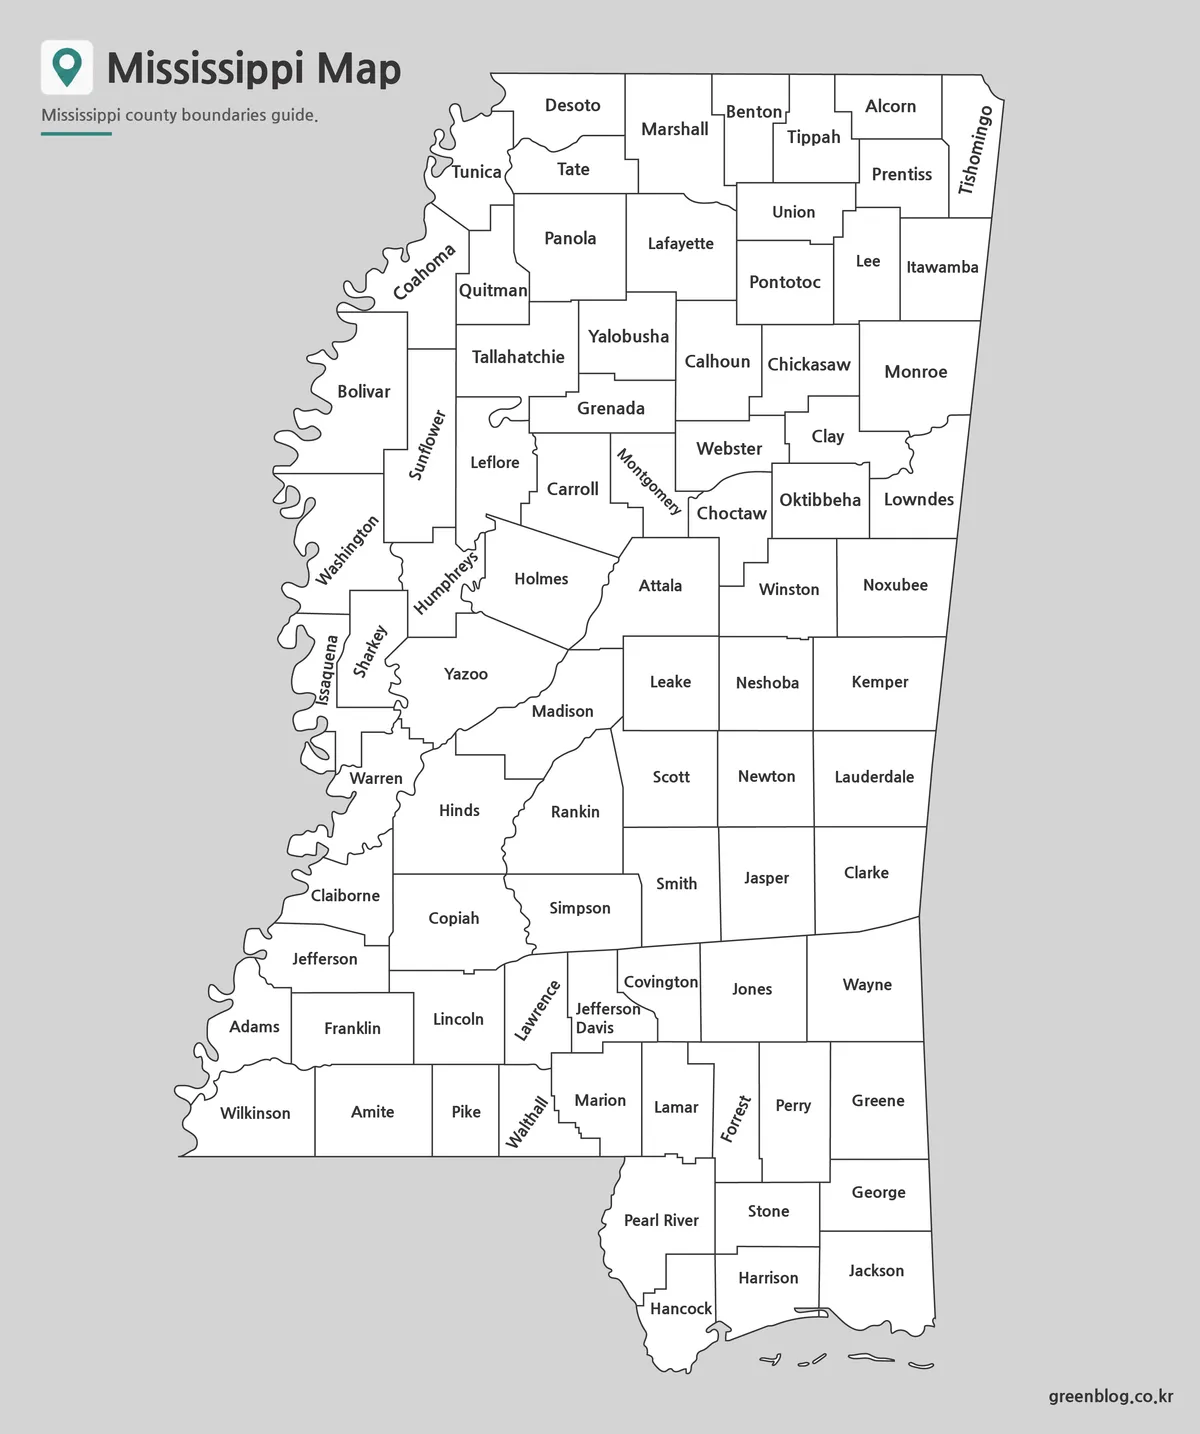
The black-and-white Mississippi Map retains every county name and line while replacing the pastel areas with white. It fits naturally inside reports, worksheets, and printed study packets where color would be unnecessary. The open interiors can also accommodate a few pencil marks or highlights, provided they do not cover narrow vertical labels along the western and southern portions of the map.
Several names require careful placement because of county shape, including Tishomingo, Coahoma, Sunflower, Montgomery, Humphreys, Issaquena, Sharkey, Lawrence, Walthall, Jefferson Davis, and Forrest. The prepared label positions spare users from typesetting all 82 names themselves. For a dense data exercise, however, the outline is the better base because it avoids competition between annotations and existing text.
A Blank Outline for Regional Tasks
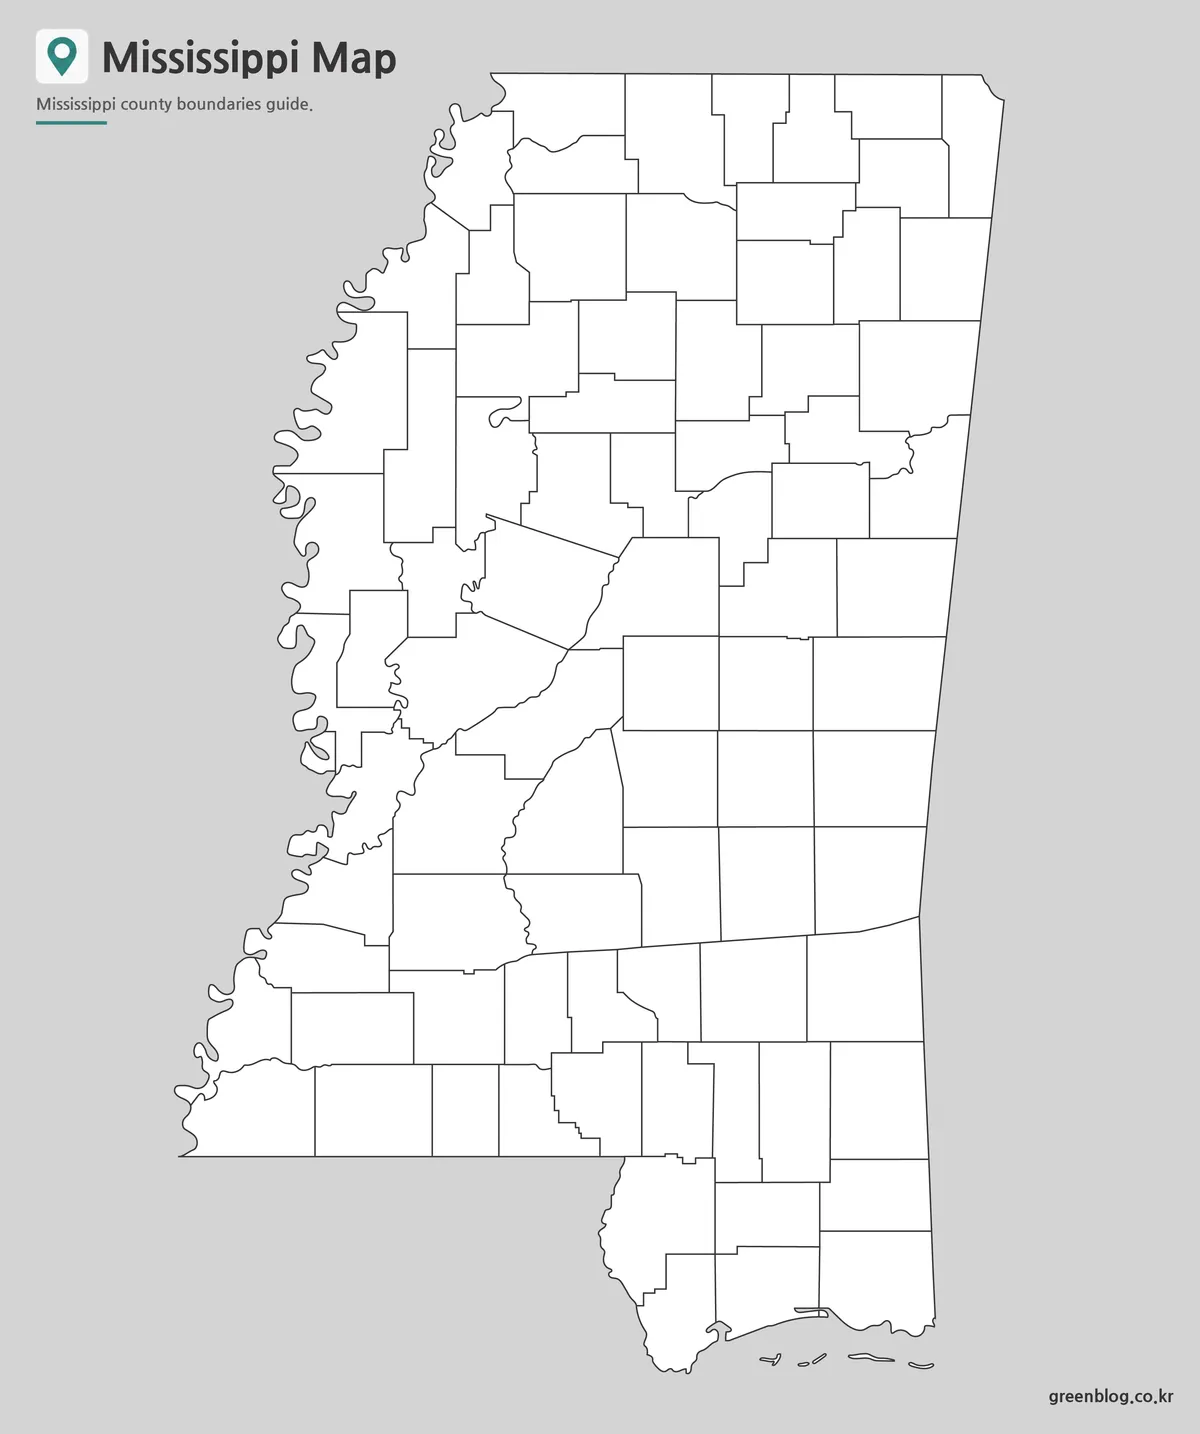
The outline Mississippi Map removes labels and color but keeps the complete county framework, the river-shaped western edge, the coastal boundary, and the offshore forms. Students can label selected counties, number them for a quiz, or color groups from north to south. Designers can add service areas, travel routes, category fills, or location markers without first erasing printed names.
A practical activity can begin with the three coastal counties of Hancock, Harrison, and Jackson, then move north through Pearl River, Stone, and George. Another can follow the western edge from Tunica toward Wilkinson and compare the river-influenced outline with the straighter Alabama side. Because the file is a raster JPG, digital annotations should be placed on a separate layer or overlaid in presentation software.
Choosing and Printing a Mississippi Map
Select the color image for projected slides and immediate boundary separation, the black-and-white image for a labeled document, and the outline when readers must provide names or data. Since the three versions share the same proportions, they can be placed on consecutive presentation slides or used as an answer sheet and student worksheet pair.
For A3 output, preserve the original aspect ratio and review the printer preview before producing a class set. A fit-to-page setting helps keep the western river bends, southern coast, and outer islands inside hardware margins. If consistent scale matters across several state maps, use the same print settings and confirm line clarity with a single test page first.
Why County Detail Matters Here
A simple state silhouette cannot show the difference between northern county tiers, the irregular western edge, central county relationships, and the compact Gulf Coast group. County detail gives educators and content creators a stable base for regional explanation. It also makes clear where an added city, road, demographic, or environmental layer would need to be positioned, even though those subjects are not included in this download.
Frequently Asked Questions
Can I print this Mississippi Map in A3 size?
Yes. The map files are prepared for A3 high-resolution printing.
Does the map include county boundaries?
Yes. The Mississippi county boundaries are included in the map collection.
Which version is best for classroom use?
The black and white version works well for handouts, while the outline map is useful for worksheets.
Can I use the outline map for editing?
Yes. The blank outline version is suitable for adding labels, colors, data, or custom graphics.
Is this Mississippi Map useful for presentations?
Yes. The color and black and white versions are both suitable for presentation slides and visual reference materials.
Map File Information
Download the three Mississippi county-map versions together for printing, reference, or annotation.
- Included Versions: Color labeled, black-and-white labeled, and blank outline maps
- Printable Size: A3
- File Type: JPG / ZIP
- Intended Use: Lessons, handouts, presentations, and custom county projects
Related Maps
Additional Resources
- U.S. Census Bureau Mississippi Geographic Guide — Review official explanations of Mississippi’s counties, county subdivisions, places, and other geographic areas.
Green Map creates custom-edited map images using open geographic data sources such as geoBoundaries, Natural Earth, OpenStreetMap, and government open data.
These maps are edited visual materials, not raw data files, and are provided for education, documents, presentations, and graphic reference.