Warren County is predominantly wooded in the supplied 2025 classification, yet the map becomes much more varied around its central settlement area and along the county’s narrow eastern extension. The Warren County Georgia Land Cover Map summary lists 58.88% forest, 14.24% agriculture, 7.38% grassland, 6.18% developed land, 5.53% wetlands, 5.22% shrubland, and 0.81% water. Forest sets the countywide pattern, while open land and developed surfaces break that green cover in several distinct places.
Four map views are provided for different questions: current land cover, forest and farmland, impervious surface, and a 1985–2025 endpoint comparison. The WebP images can be read directly in the article, and the four original 2480 × 1754 JPG maps are grouped in one ZIP download below. A reader can start with the broad county composition, then switch to the vegetation, hard-surface, or change view without forcing every category into one crowded image.
Table of Contents
The countywide pattern is wooded, but its middle is far more mixed than the outer forest blocks
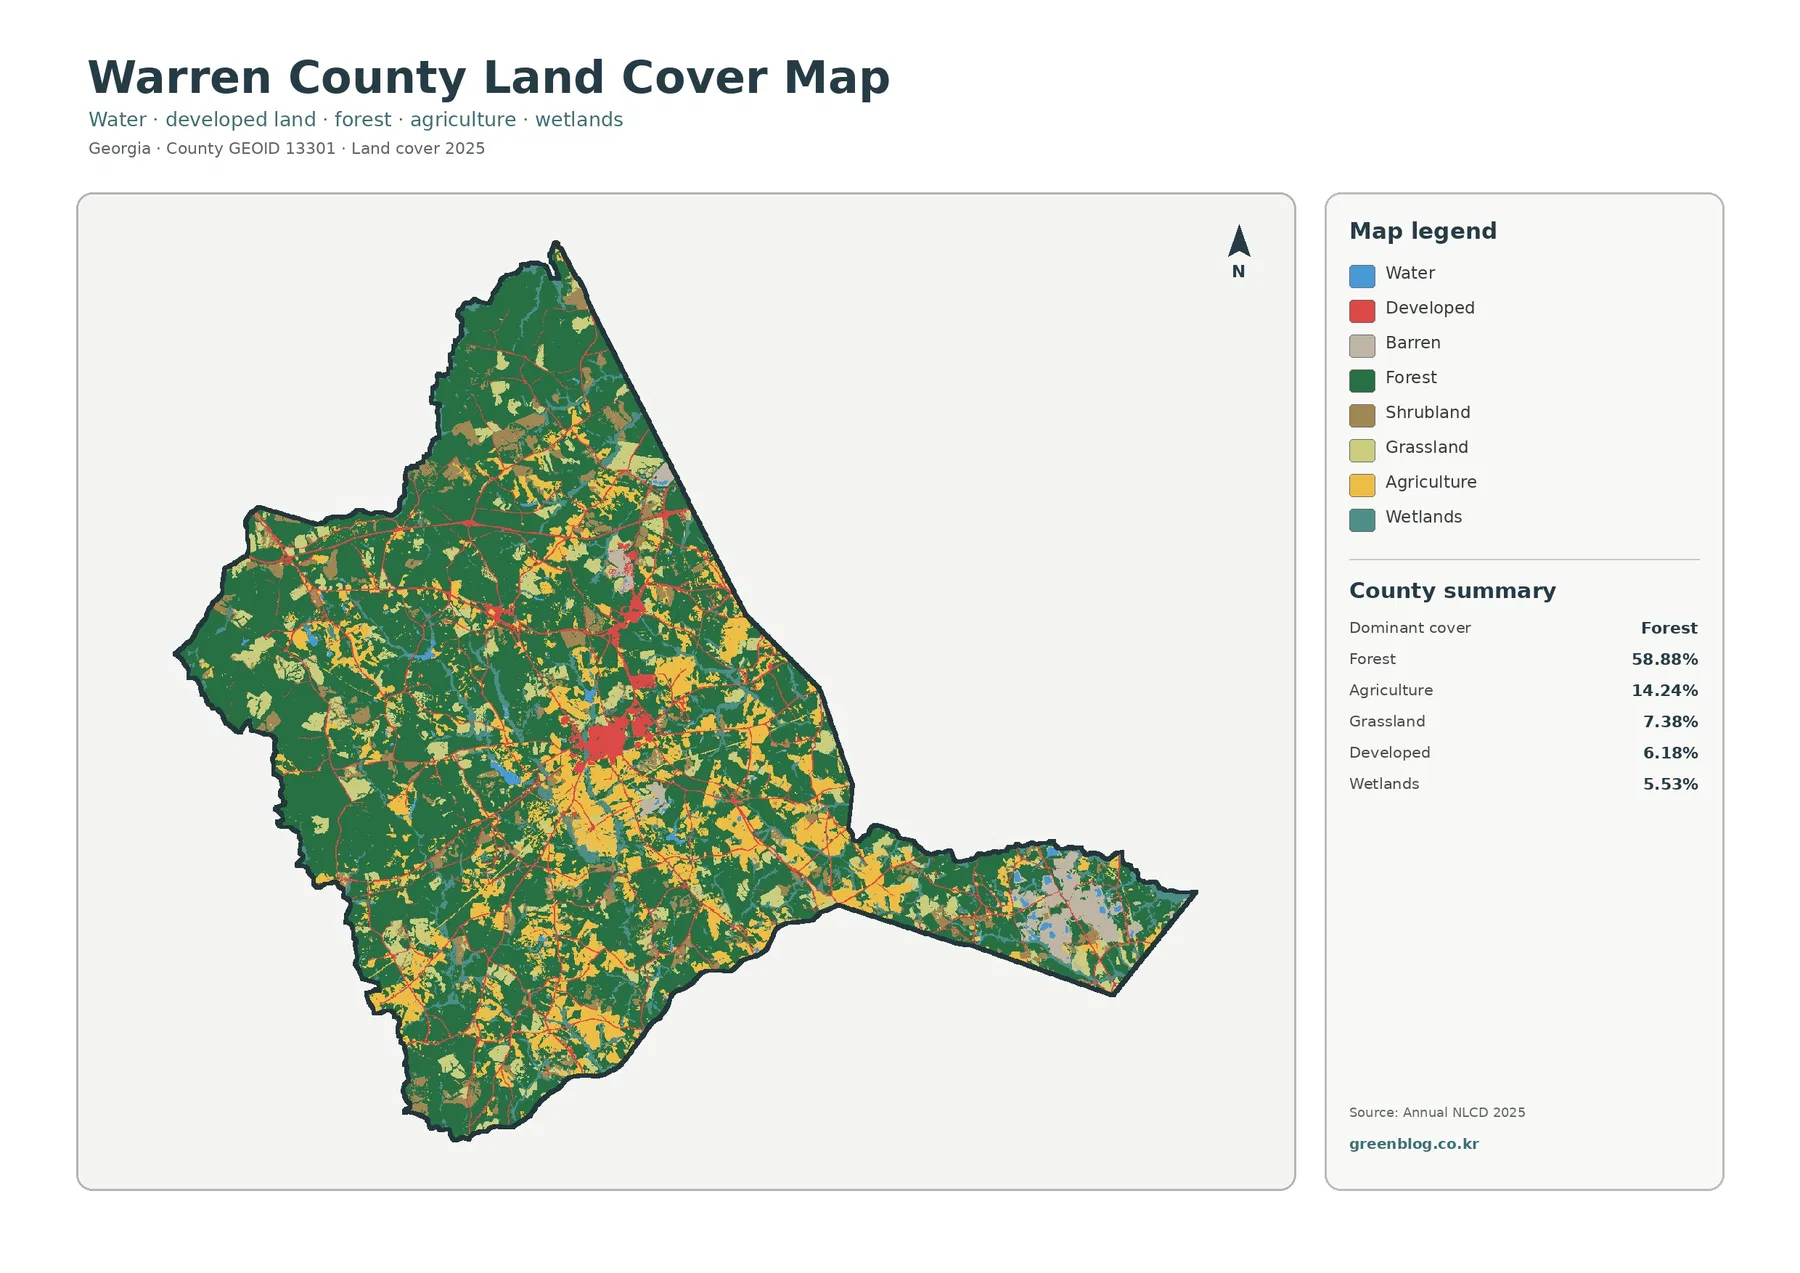
Dark green forest occupies most of the northern tip, large western areas, much of the south, and substantial parts of the eastern arm. The central portion is different. Red developed cover, yellow agriculture, light green grassland, and other open classes occur close together, producing the most complex part of the current-cover image. That contrast is important because a single countywide number can make Warren look more uniform than it is. The forest majority is real, but it surrounds a central zone where several surface types meet.
Forest at 58.88% is the dominant class by a wide margin, while agriculture at 14.24% is the largest nonforest class in the supplied summary. Grassland and shrubland add another 12.60% when their separate values are considered together. Those open covers are not arranged as one broad agricultural plain. Instead, they appear in irregular patches and strips within the wooded matrix, especially through the central and southern parts of the county. The repeated forest-to-open transitions give Warren a patchier appearance than a county dominated by large rectangular farm blocks.
The strongest red developed concentration sits near the center of the county. New Georgia Encyclopedia identifies Warrenton as the county seat and lists Camak and Norwood as the other incorporated towns. Municipal boundaries are not drawn on the land-cover image, so the red cluster should not be treated as an exact city outline. At county scale, however, it provides a clear picture of the more built-up Warrenton area standing out from the wooded and agricultural surfaces around it.
A smaller developed concentration appears farther north, and thin red traces connect several parts of the county. These features are useful for recognizing where settlement and transportation surfaces are more common, but the image does not label roads or towns. A narrow red line cannot be assigned a highway name from this map alone. Administrative and transportation layers are still needed when the task is to identify a specific street, municipal limit, or road corridor.
The long eastern projection deserves separate attention because it does not look exactly like the broad western body of the county. Forest remains present, but pale developed-or-other surfaces, small water features, and open land are more conspicuous there. Warren County background sources note kaolin mining as part of the local economy. The land-cover map does not mark mine boundaries or facility names, so the pale areas should not be labeled as mines. They are best described as a part of the county where nonforest surfaces are more visibly mixed with the surrounding woodland.
Cropland, pasture, and grass break the forest into many smaller transitions
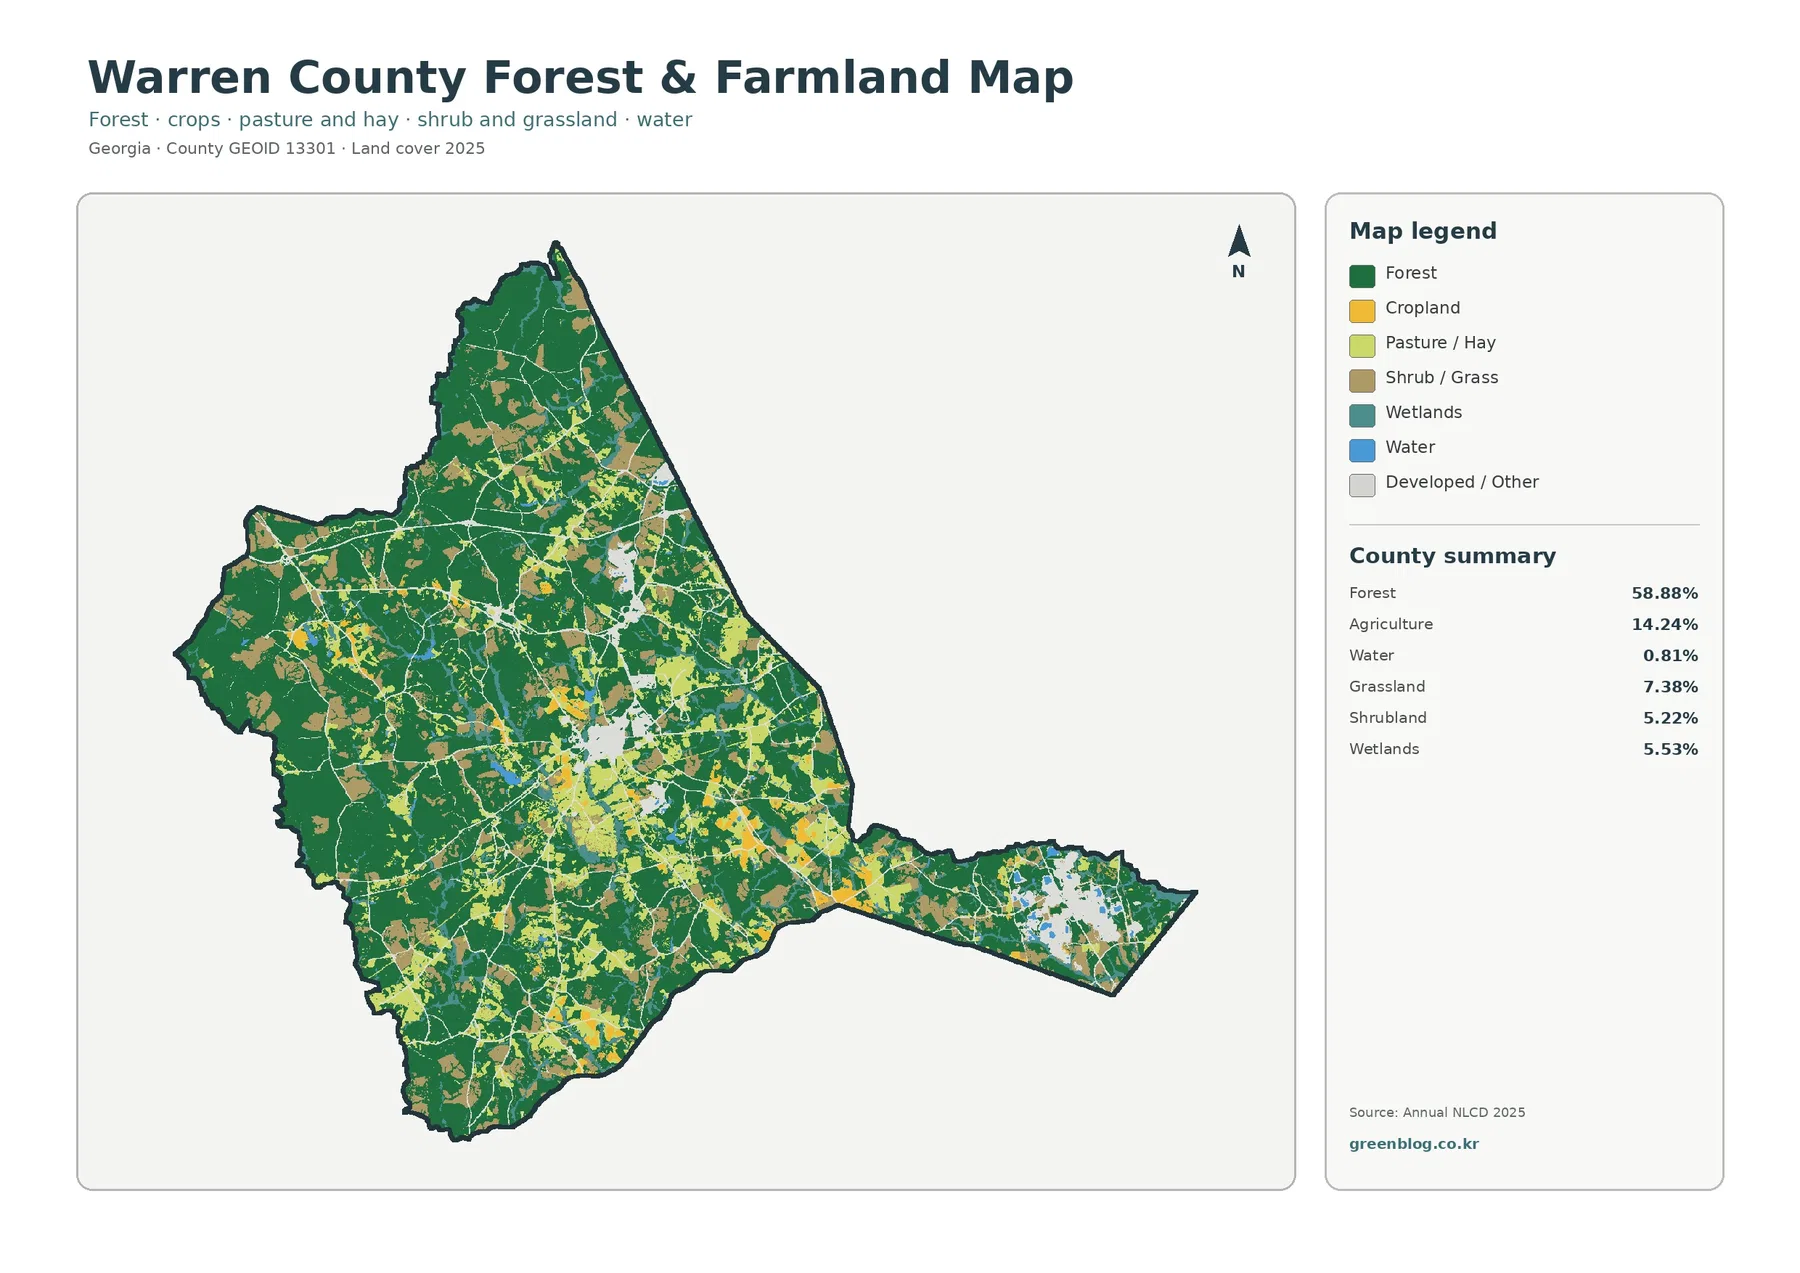
The forest-and-farmland image removes some of the developed-class detail and makes the relationship between wooded and open ground easier to follow. Large forest blocks remain most continuous in parts of the north, west, and south. Cropland and pasture or hay become more frequent through the middle and toward several southern openings. Around the central developed area, light open classes are interwoven with forest rather than forming a hard edge between town and countryside.
The 14.24% agriculture figure should not be read as though every yellow or pale green opening is the same kind of farm. The map separates cropland from pasture and hay, while grassland and shrubland are also distinct classes in the county summary. That distinction matters in Warren because several open-cover colors occur close together. A local profile that describes every nonforest patch simply as “farmland” would erase information that the supplied map already provides.
Grassland accounts for 7.38% and shrubland for 5.22%, giving Warren a notable amount of open or lower-vegetation cover beyond the mapped agricultural class. These categories describe what covers the surface, not ownership or legal use. A grass-colored cell might represent managed open ground, pasture-like vegetation, or another grassy surface, while shrubland can represent lower woody vegetation. Neither class automatically identifies a parcel as agricultural, vacant, or available for development.
Wetlands cover 5.53%, compared with only 0.81% open water. That difference helps explain why water-related environments cannot be judged from blue features alone. Wetland cells may contain vegetation and saturated ground rather than open water. New Georgia Encyclopedia notes that the Ogeechee River forms Warren County’s western boundary, but the supplied map does not label the river. The local geography provides useful context for western water and wetland patterns without turning each teal or blue cell into a named river segment.
A 1.26% mean impervious value still leaves a clear Warrenton-area signature
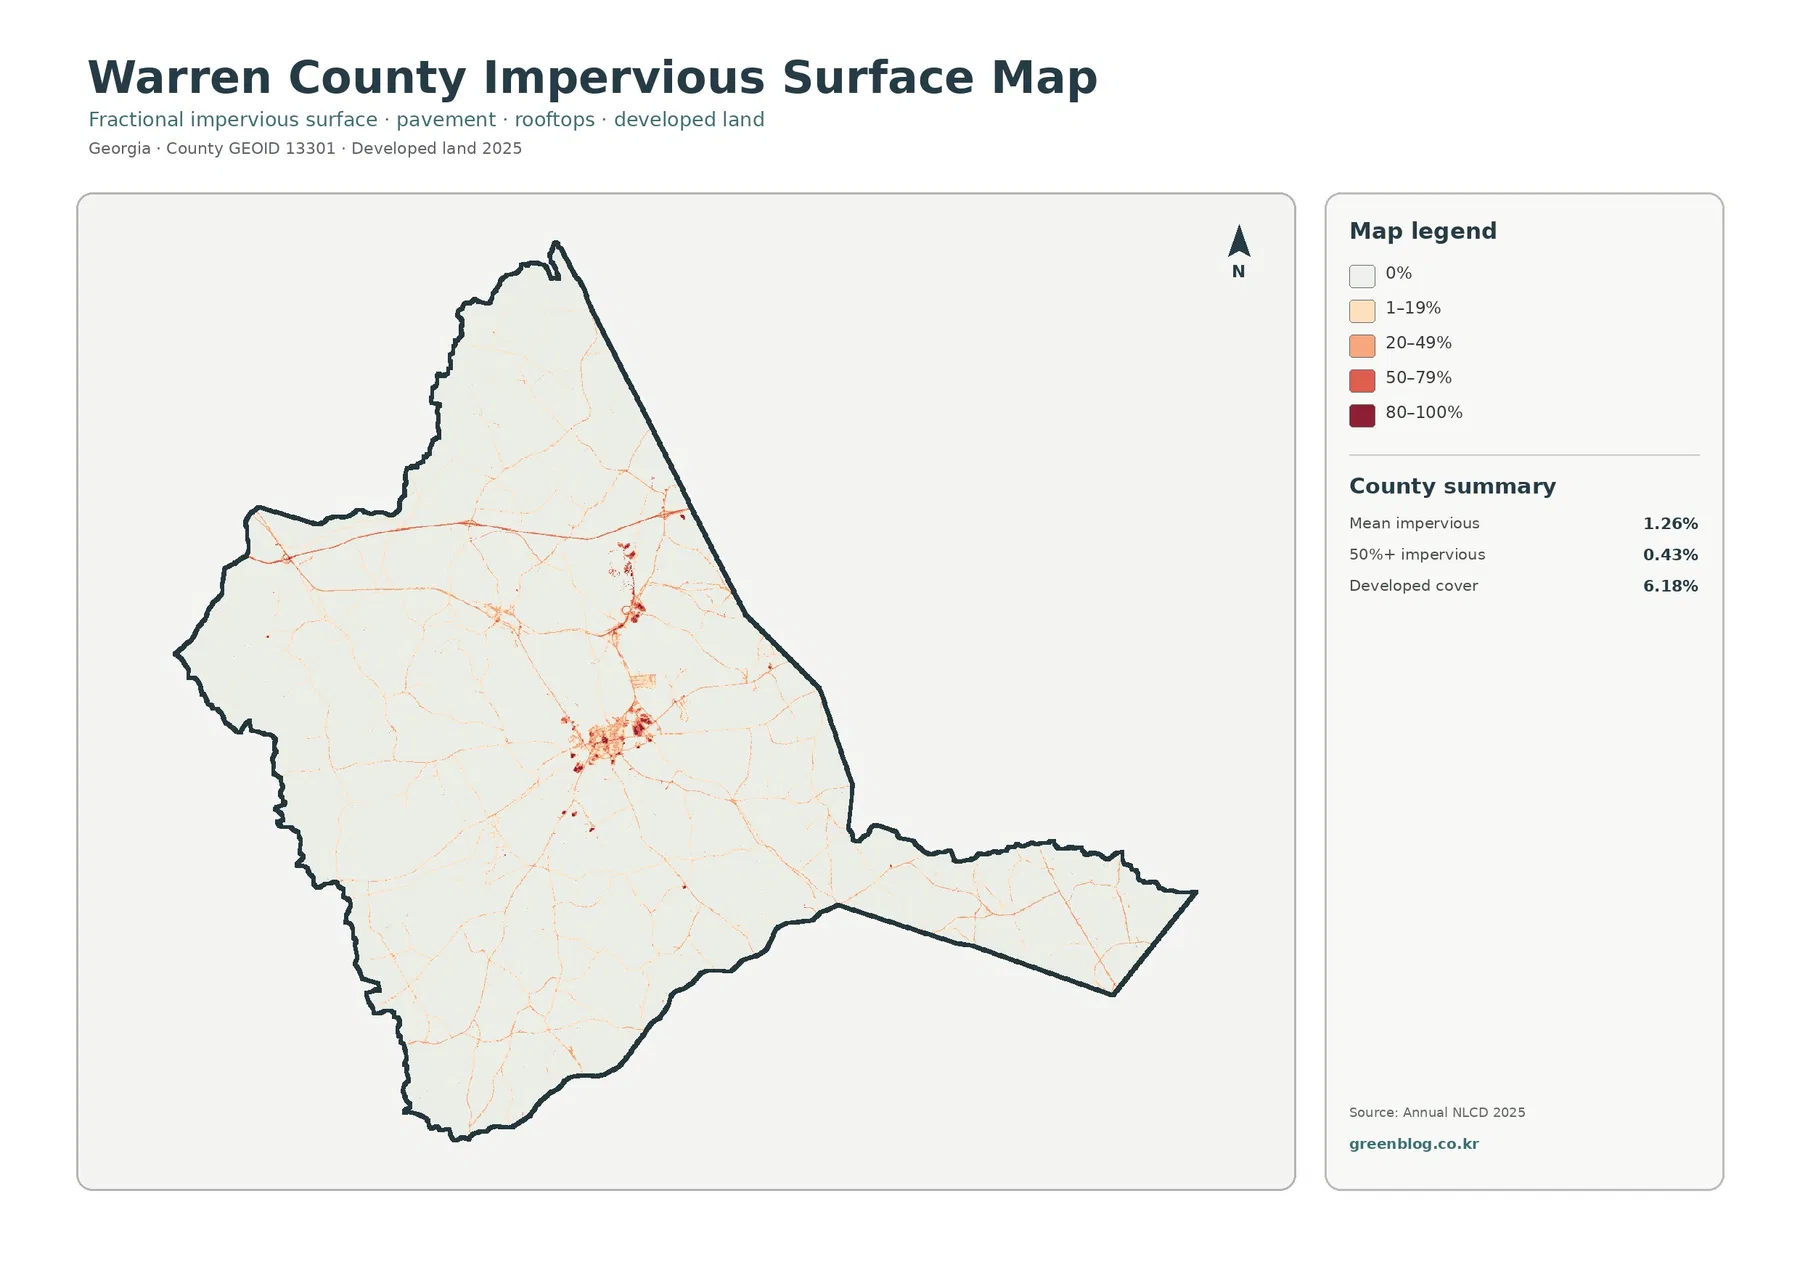
Impervious surface means ground covered by materials such as roofs and pavement that allow little water to soak into the soil. Warren County’s mean impervious value is 1.26%, and only 0.43% of the mapped area is listed at 50% impervious or greater. Those figures are much lower than the 6.18% developed-cover share because developed classes can also include lawns, trees, bare soil, and other permeable ground around buildings and roads.
The average is low, but the map is not featureless. Its darkest and most connected hard-surface cluster lies in the central area associated broadly with Warrenton. Narrower traces extend outward, while a smaller cluster appears to the north. Large western and southern forest areas remain mostly in the zero or low-impervious categories. For a presentation about settlement concentration, this map communicates the difference between the central built area and the wider rural county more clearly than the general land-cover image.
Warrenton is located at the intersection of U.S. Highway 278 and Georgia routes identified in local reference material, but the impervious image has no labeled road layer. That distinction is important. A viewer can say that hard surfaces follow narrow corridors out of the central cluster, yet should not name a particular line as U.S. 278 or another highway without checking transportation data. At 30-meter cell scale, pavement, roadside vegetation, driveways, and nearby structures can be represented together.
The eastern projection also contains light linear traces and small hard-surface concentrations, but they do not approach the intensity of the central cluster. This helps explain why a county can have a visible network of roads and settled places while still reporting only 1.26% mean impervious cover. Hard surfaces are concentrated rather than evenly spread, and most of Warren’s area remains forested, agricultural, grassy, shrubby, wetland, or otherwise permeable.
More than one-third of cells differ between 1985 and 2025, but development is only a small part of that total
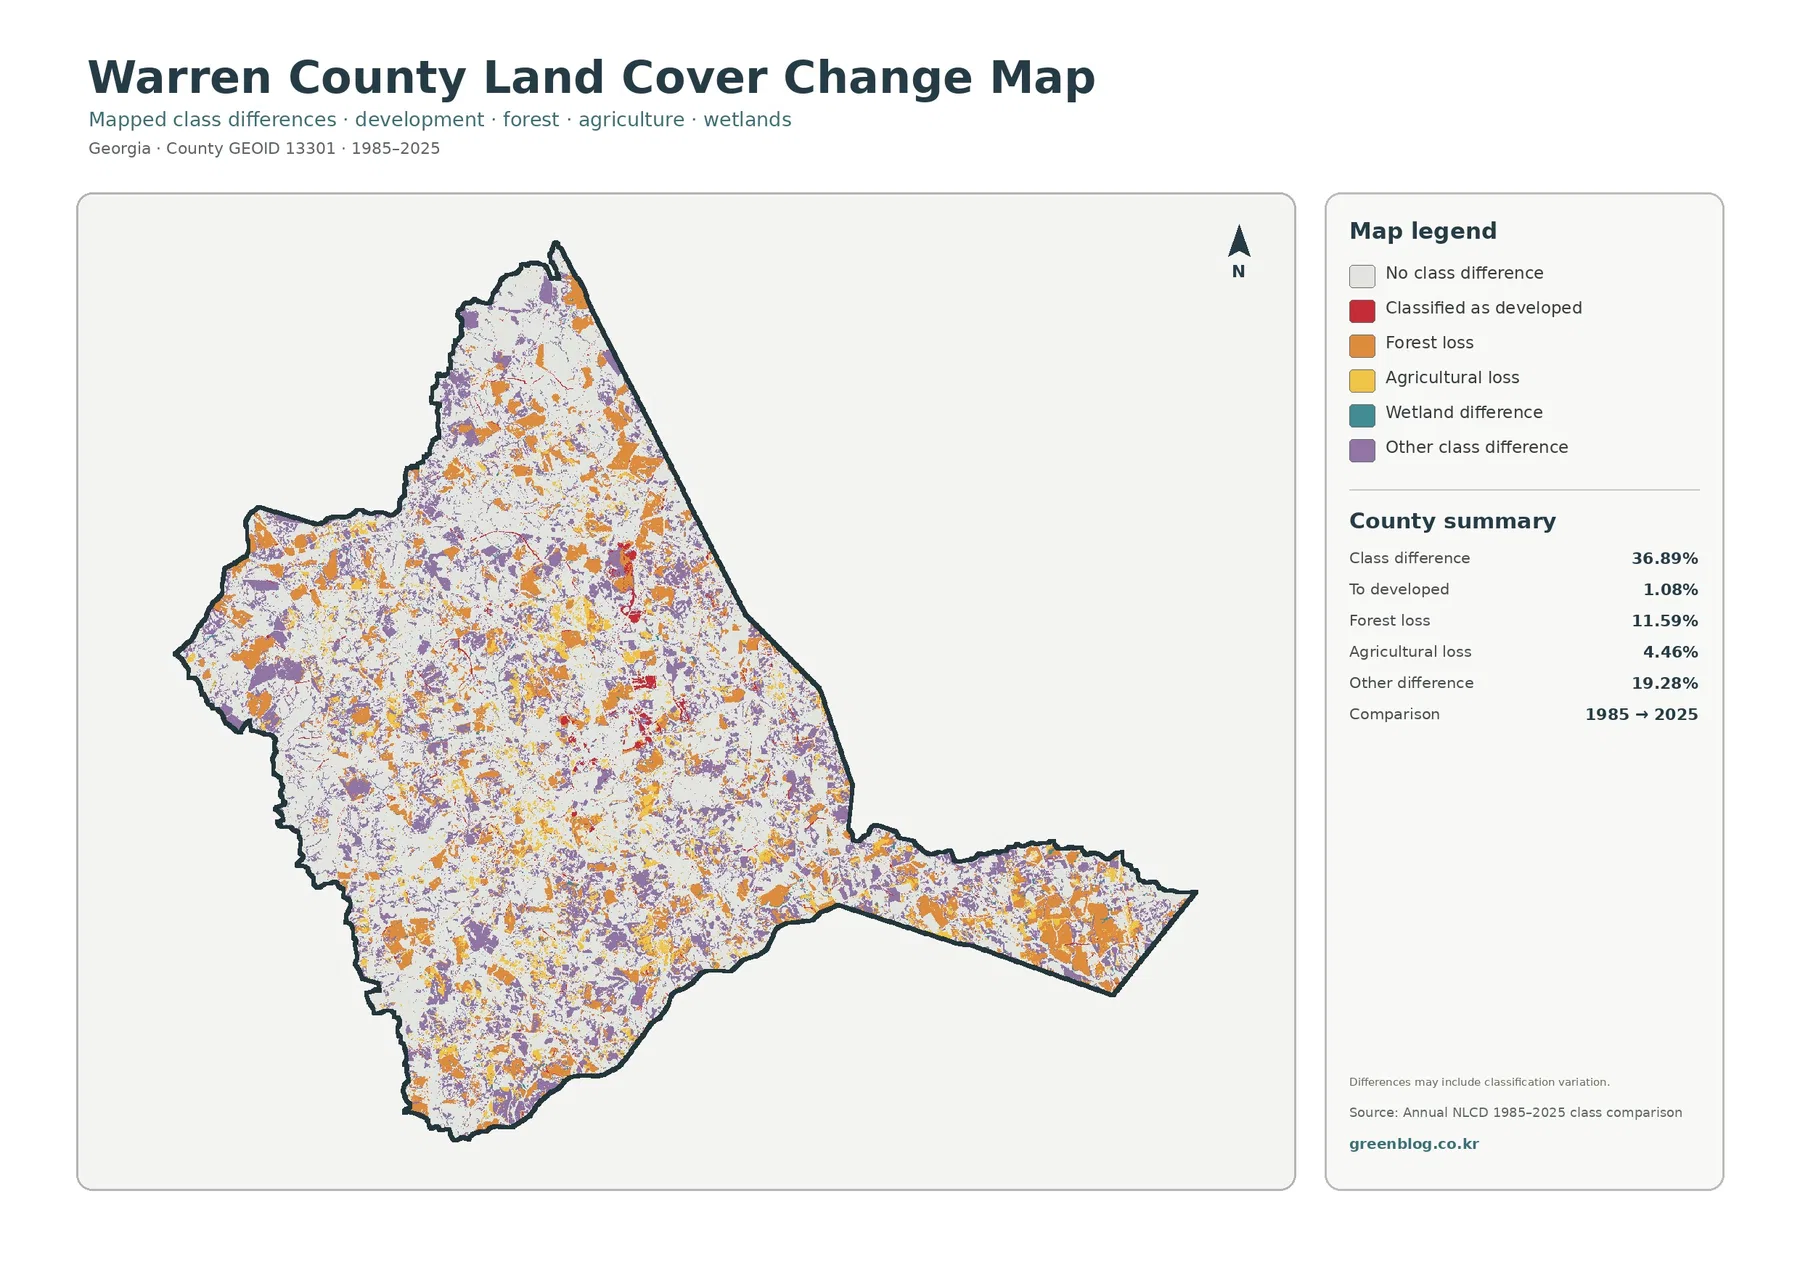
The change image is considerably busier than the current-cover maps. The supplied summary lists a 36.89% class difference between the 1985 and 2025 endpoints. It includes 11.59% forest loss, 1.08% classified to developed, 4.46% agricultural loss, and 19.28% other difference. Because the total exceeds one-third of the county, colored difference cells appear throughout Warren rather than being confined to one growth area.
Orange forest-loss cells are scattered across the north, west, south, and eastern arm. They frequently sit within areas that are still predominantly forested in the 2025 map. That combination is not contradictory. Warren can retain 58.88% forest in 2025 while many individual cells have a different forest classification than they did at the 1985 endpoint. The current map describes composition at one time; the change map compares the endpoints of a longer interval.
Red developed-class difference appears around parts of the central settlement area and in smaller scattered locations, yet its 1.08% share is far below the total class difference. The largest reported component is “other difference” at 19.28%. That is a strong reason not to describe the 36.89% total as urban expansion. The map is showing several kinds of class disagreement between two dates, and much of that difference falls outside the specifically listed development, forest-loss, and agricultural-loss categories.
The 11.59% forest-loss value also does not identify a cause. Timber harvest, regrowth, conversion to another vegetation class, agriculture, storms, observation timing, or classification variation can all affect endpoint comparisons. The map itself warns that differences may include classification variation. To establish when and why one location changed, a user would need intermediate-year imagery, land records, forestry information, or field evidence rather than the two-date image alone.
Agricultural loss is listed at 4.46%, but that does not mean every one of those cells became developed land. Some may have moved into forest, shrub, grass, wetland, or another classification by 2025. The endpoint map is most useful as a screening layer: it identifies where the 1985 and 2025 labels differ so that a researcher can decide which areas deserve a closer time-series review.
Land cover describes the surface, not zoning, ownership, or parcel boundaries
Land cover classifies what is physically covering the ground—forest, crops, grass, water, wetland, developed surface, and related categories. It is not a zoning map and does not say whether a parcel is residential, commercial, agricultural by law, publicly owned, privately owned, or available for construction. The central developed cluster therefore should not be used as a substitute for the Warrenton city limit, and the pale eastern surfaces should not be treated as mapped industrial or mining permits.
Annual NLCD generally represents the landscape with 30-meter raster cells. One cell can contain a small building, trees, grass, a road shoulder, and part of a driveway, yet the product assigns a representative class or impervious percentage to that area. Enlarging the JPG makes the existing pixels easier to see; it does not create parcel-scale detail that was absent from the source. Countywide patterns are the right scale for these maps.
The current maps correspond to the supplied 2025 observation year. Construction, timber activity, regrowth, agricultural changes, storm impacts, or water conditions after that observation may not appear. The 1985–2025 layer is also an endpoint comparison rather than a yearly history. A place can change several times during four decades and still finish in a class similar to its starting condition, so the map should not be read as a complete timeline.
Use the four JPGs as separate reference views instead of shrinking them into one crowded panel
The download contains the original JPG used for each of the four views: 2025 land cover, forest and farmland, impervious surface and developed land, and 1985–2025 land-cover change. Each image measures 2480 × 1754 pixels. The package manifest does not mark these dimensions as meeting an A3 high-resolution reference, so a proof print is advisable before using the maps for a large poster or display.
Choose the general map when the question is about overall composition or the contrast between the wooded county and its central developed area. Use the vegetation map when forest, crops, pasture, grass, shrub, and wetlands need to be separated more clearly. The impervious map is the strongest choice for discussing where roofs and pavement concentrate, while the change map should be reserved for explaining endpoint class differences so its colors are not confused with present-day land-cover classes.
For teaching or presentations, one large image followed by a second supporting map is usually easier to read than four small panels. A lesson might begin with the 58.88% forest share, then use the forest-and-farmland map to locate agricultural openings. A county profile focused on Warrenton could begin with the impervious map and then return to the general map to show how small the developed footprint is relative to the surrounding forest. A change discussion should first establish the 2025 condition before introducing the 36.89% endpoint difference.
Frequently Asked Questions
What is the largest land-cover class in Warren County?
Forest is the largest 2025 class at 58.88%. Agriculture follows at 14.24%, then grassland at 7.38%, developed land at 6.18%, wetlands at 5.53%, shrubland at 5.22%, and water at 0.81%. The map shows the largest forest blocks outside the more mixed central settlement area.
Why is developed cover 6.18% when mean impervious cover is only 1.26%?
They measure different things. A developed land-cover class can include lawns, trees, soil, and other permeable ground around buildings and roads. Impervious percentage focuses on hard surfaces such as rooftops and pavement, so the countywide average can be much lower than the total area assigned to developed classes.
Does the 36.89% class difference mean that 36.89% of Warren County was developed?
No. Only 1.08% is listed in the comparison as classified to developed. The 36.89% total also includes 11.59% forest loss, 4.46% agricultural loss, 19.28% other difference, and wetland-related or classification differences represented on the map. The endpoint comparison identifies changed classifications; it does not provide one cause for every cell.
Sources and Reference Data
- MRLC Annual NLCD Data – official access point for the annual land-cover and comparison products used for the mapped classes.
- USGS Annual NLCD Land Cover Classification – definitions and background for forest, agriculture, developed land, wetlands, and other Annual NLCD classes.
- New Georgia Encyclopedia – Warren County – local context for Warrenton, Camak, Norwood, the Ogeechee River boundary, forestry, and county economic activities.
- U.S. Census Bureau TIGER/Line Shapefiles – official geographic boundary reference for U.S. counties and related features.
Map File Information
The ZIP contains the four original Warren County JPG maps used to compare 2025 land cover, forest and farmland, hard surfaces, and 1985–2025 class differences.
- Included Files: Original high-resolution map files shown in this article
- File Type: JPG images packaged in a ZIP archive
- Intended Use: Printing, education, presentations, and map-based projects
Related Maps
- Appling County Georgia Land Cover Map
- Atkinson County Georgia Land Cover Map
- Bacon County Georgia Land Cover Map
Green Map creates custom-edited map images using open geographic data sources such as geoBoundaries, Natural Earth, OpenStreetMap, and government open data. These maps are edited visual materials, not raw data files, and are provided for education, documents, presentations, and graphic reference.