Wetlands dominate the 2025 land-cover picture of Ware County in southeast Georgia. They account for 55.08% of the supplied county summary, while forest covers 25.06%. The northern half contains a much more varied mix of forest, agriculture, developed land, grassland, and shrubland, but the long southern section is overwhelmingly wetland. This page compares that current pattern with forest and farmland, impervious surface, and a 1985–2025 class-difference view.
The four WebP maps can be viewed in the article, and the four original JPG files are available together in one ZIP. They are useful for county profiles, classroom graphics, environmental comparisons, and presentations where readers need to see how a heavily wetland landscape differs from its more developed northern communities. These are land-cover maps, not parcel, zoning, ownership, or building-permit maps.
Table of Contents
A county where wetland cover exceeds every other class combined
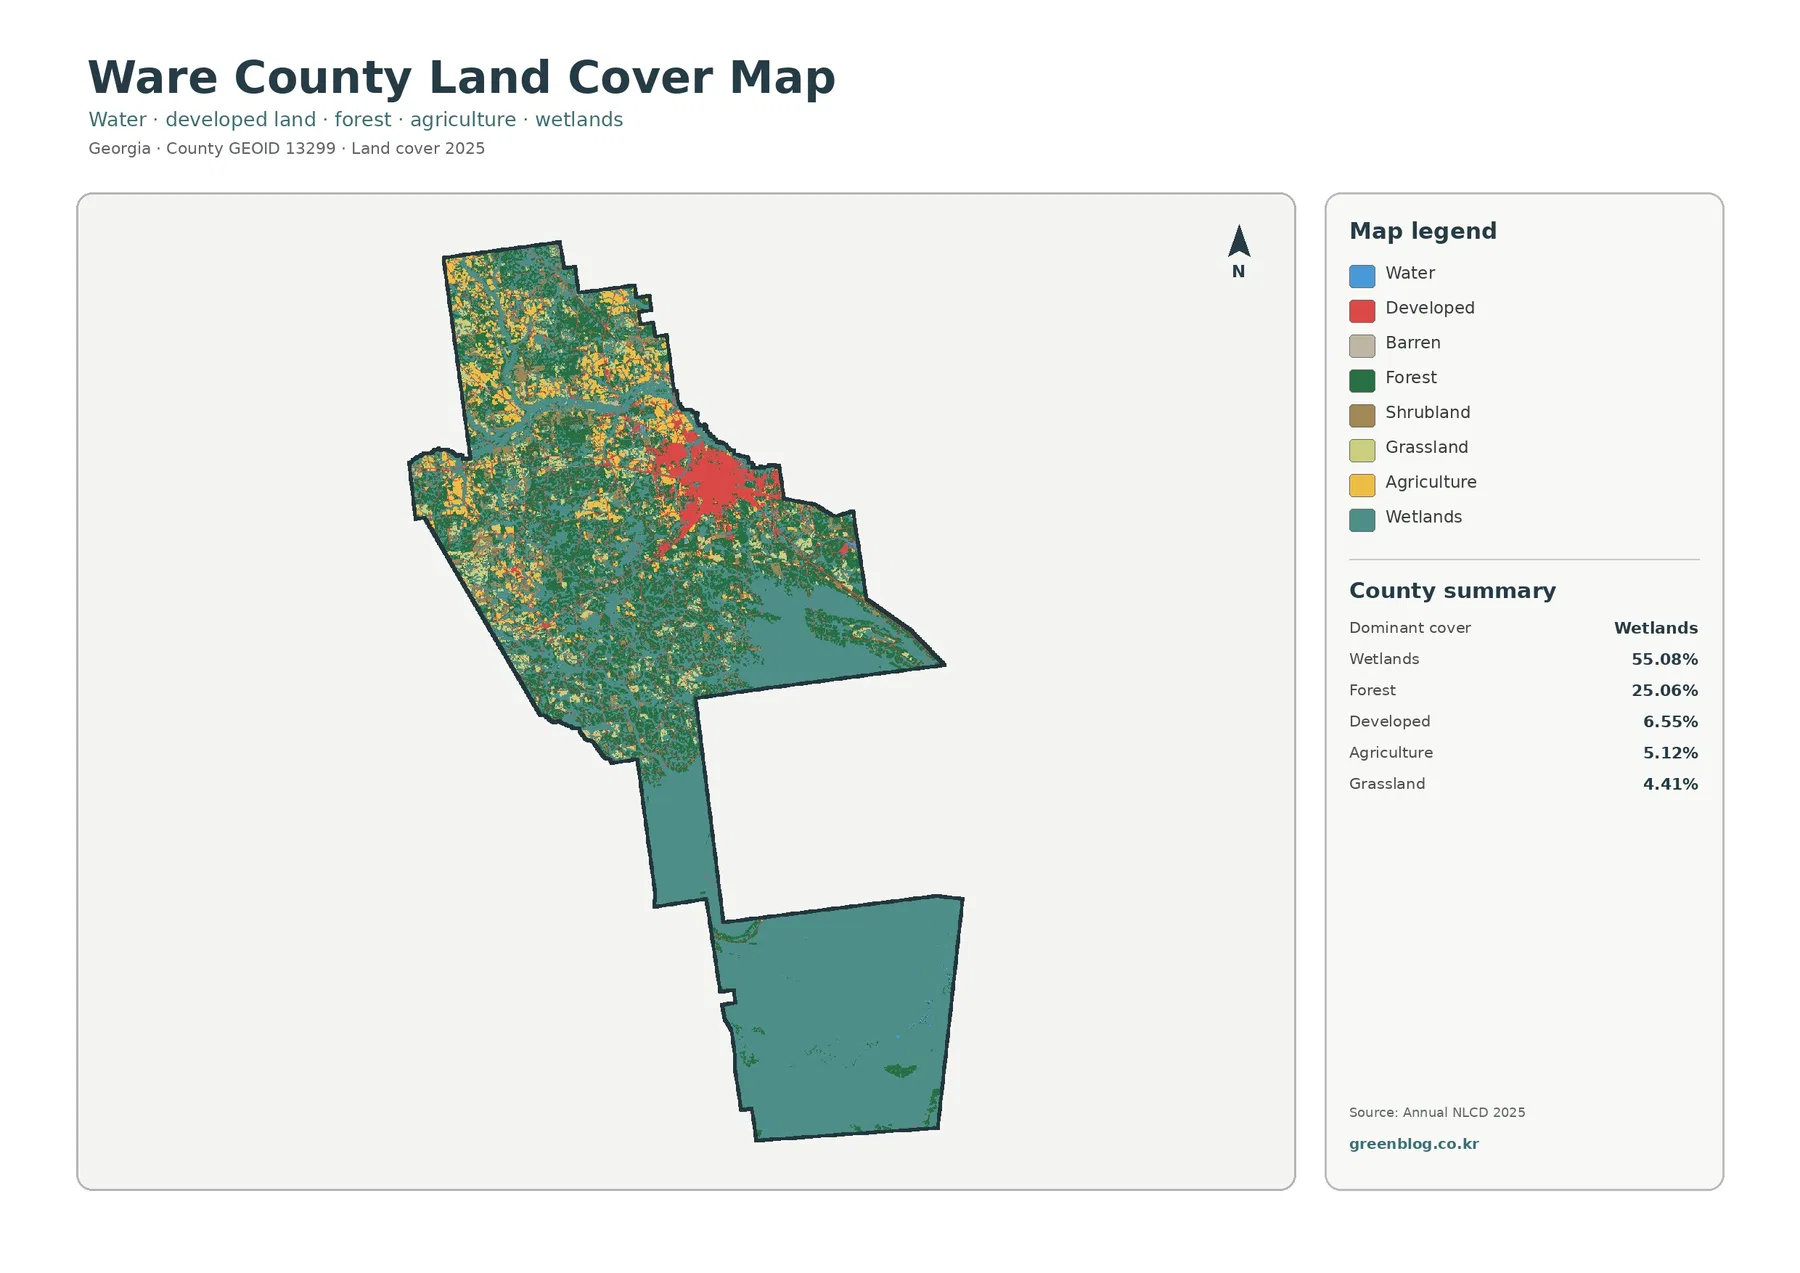
The county summary lists wetlands at 55.08%, forest at 25.06%, developed land at 6.55%, agriculture at 5.12%, grassland at 4.41%, shrubland at 3.41%, and open water at 0.25%. The strongest message is not simply that one class ranks first. More than half of the mapped county is wetland, and the map places much of that cover in large connected areas rather than in a few narrow strips.
Northern Ware County looks different. Small agricultural blocks, forest patches, grass and shrub areas, and developed surfaces are interwoven across the upper part of the county. A concentrated developed patch appears in the north-central to northeastern area, while the southern extension loses most of that visual mixture and becomes almost uniformly wetland. This north-south contrast is the clearest way to introduce the county before focusing on individual classes.
Regional background helps explain why the southern pattern is so distinctive. The New Georgia Encyclopedia notes that the lower portion of Ware County forms a major part of the Okefenokee Swamp, while the U.S. Fish and Wildlife Service describes the Okefenokee refuge as one of the largest intact freshwater ecosystems in the region. The map does not draw refuge boundaries, so the wetland color should not be treated as a refuge-ownership layer. It does, however, match the broader wetland setting documented for southern Ware County.
Hard surfaces form one strong center and thin outward corridors
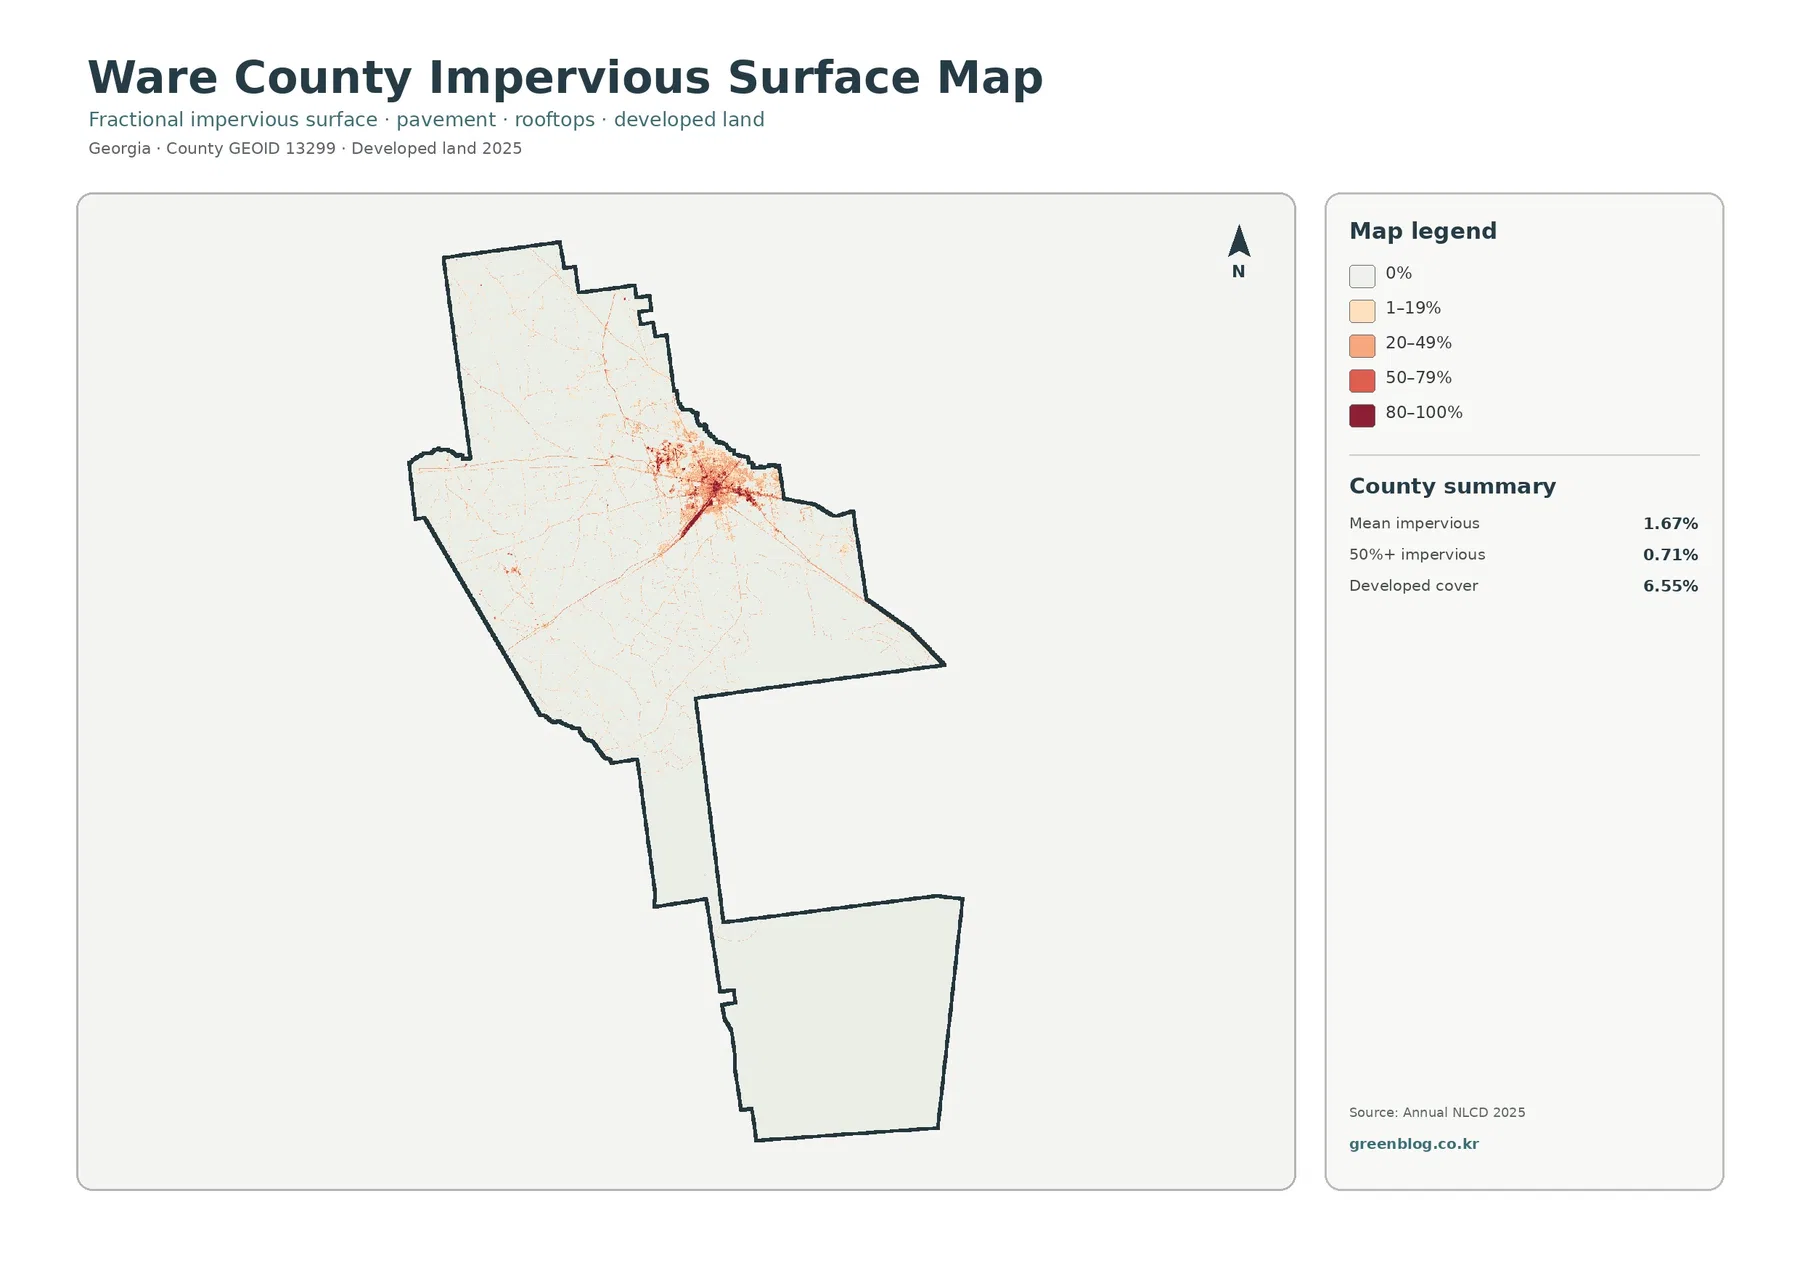
Developed land covers 6.55% of Ware County, but the mean impervious value is only 1.67%. Impervious surface means roofs, pavement, parking areas, and other hard materials that do not readily absorb rainfall. The darkest values are concentrated in one north-central cluster, with narrow lighter lines extending outward. Outside that area, most of the county has little or no mapped impervious cover.
Georgia agency pages identify Waycross as the principal service center within Ware County, and regional references identify it as the county seat. The large developed cluster on the map broadly aligns with the Waycross area. Because municipal boundaries and street labels are absent, however, the colored cluster should not be read as the exact city limit. It is more accurate to describe it as the county’s main developed and impervious concentration around Waycross.
Only 0.71% of the county is listed as having more than 50% impervious cover. That small share is not inconsistent with the 6.55% developed-land figure. Developed classes can include lawns, trees, bare ground, landscaped areas, and other permeable surfaces along with buildings and pavement. Impervious percentage isolates the hard portion of that developed landscape, which is why the countywide mean remains low.
The thin lines radiating from the main cluster are useful for visualizing where harder surfaces follow transportation or settlement corridors, but they are not a substitute for a road map. A 30-meter raster can merge pavement, vegetation, shoulders, drainage ditches, and buildings into generalized cells. The image is best used to compare concentration and extent rather than to measure an individual street or parking lot.
Why 55.08% wetland does not mean 55.08% open water
Open water represents only 0.25% of the 2025 summary, far below the 55.08% wetland share. The distinction matters in Ware County because wetlands can contain saturated soils, wetland vegetation, forested swamp, marsh-like areas, and other surfaces where water is not always visible as an open blue surface. Treating wetland and open water as the same class would badly misread the county.
The U.S. Fish and Wildlife Service describes the Okefenokee as a mosaic of wetland habitats and identifies it as the headwaters of the Suwannee and St. Marys rivers. That broader ecological description helps explain why a land-cover map can show a huge wetland footprint with very little open-water percentage. The map is classifying the surface condition, not simply counting lakes and ponds.
For teaching or public communication, this is one of the most useful comparisons on the page. Readers often associate the word swamp with uninterrupted visible water, yet the land-cover data show that the dominant category is wetland rather than open water. Pairing the general land-cover map with the vegetation-focused version makes that distinction easier to explain without relying on technical terminology.
Forest and working land are concentrated in the more varied north
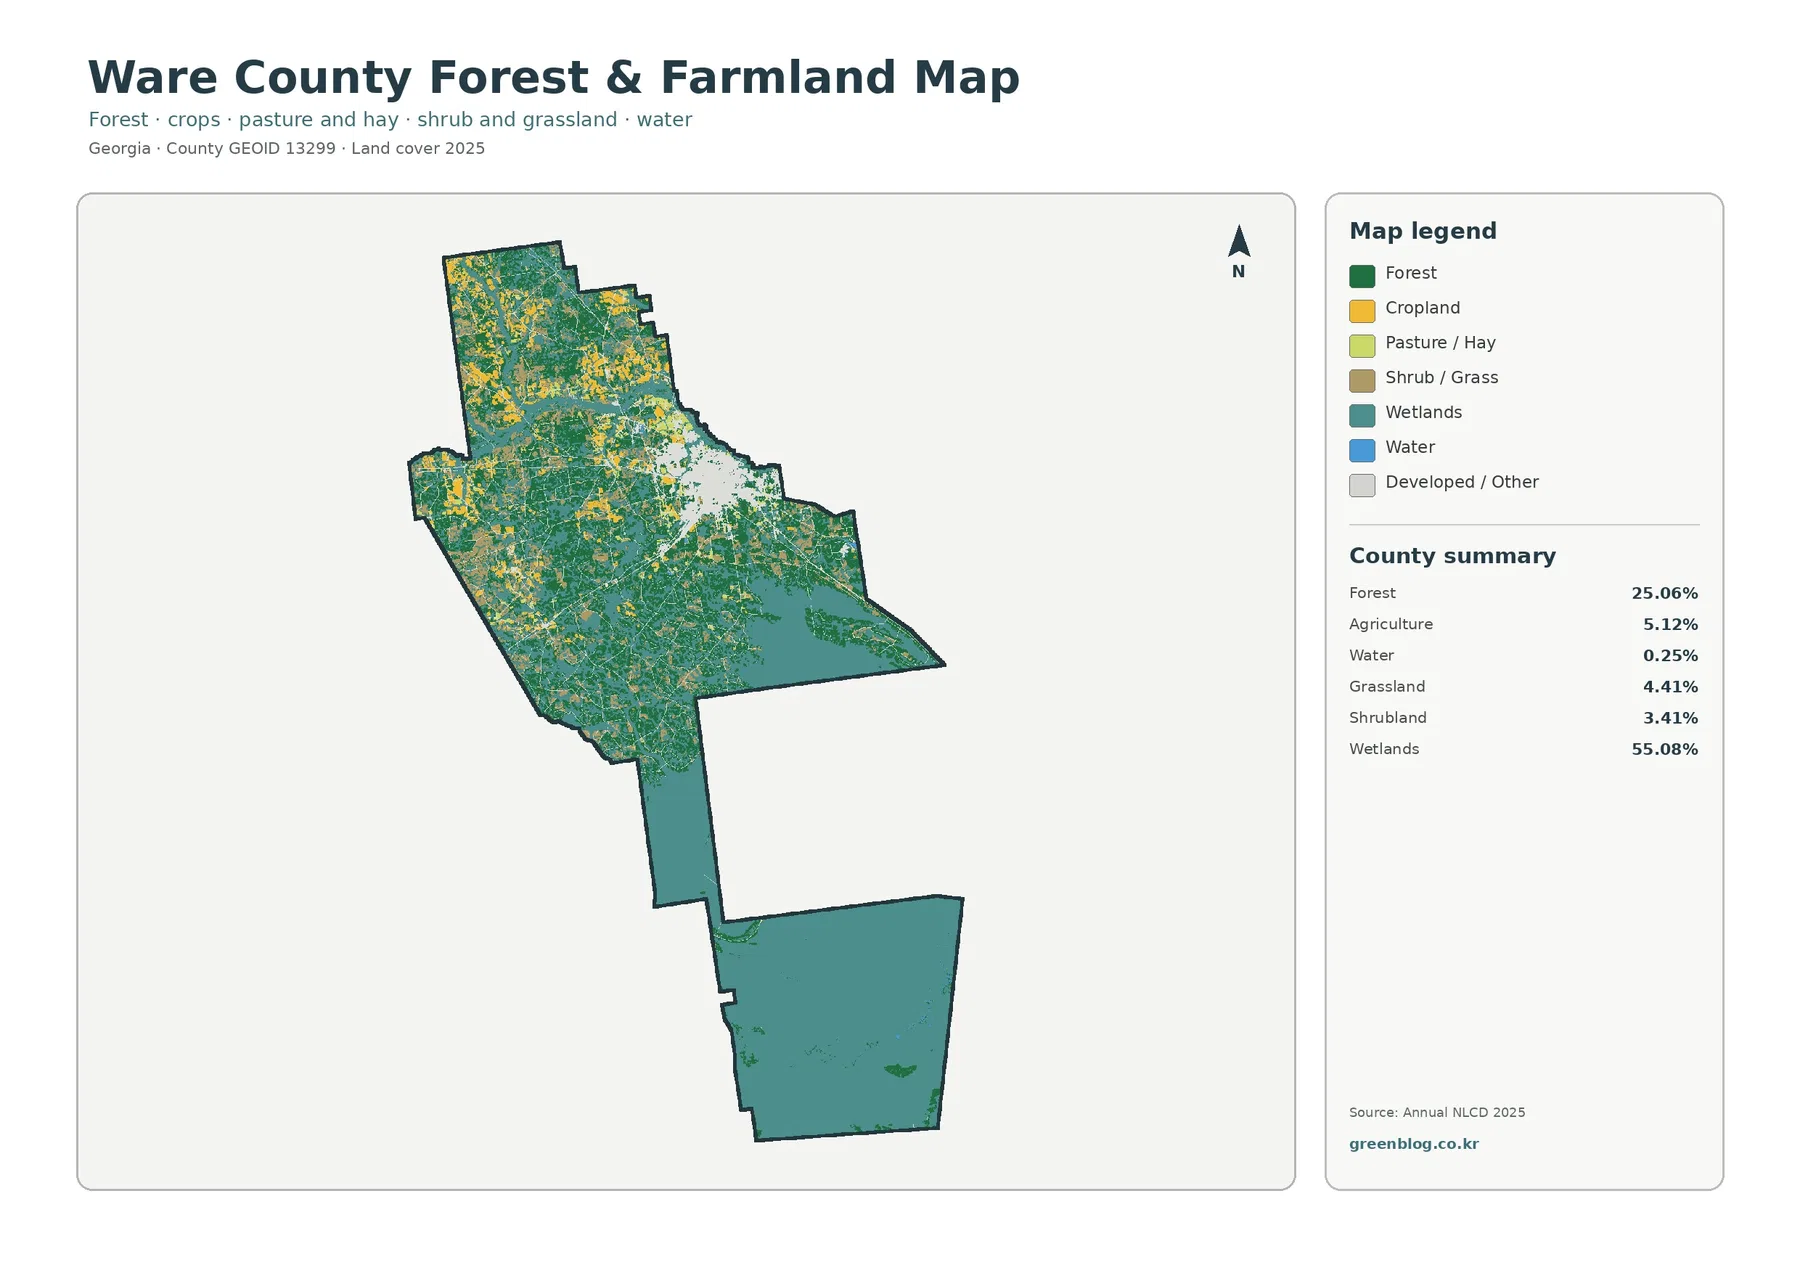
Forest is the second-largest countywide class at 25.06%, but its distribution is much less uniform than the wetland total. Green forest patches extend through the northern and central portions of Ware County and form broad areas between farmland and developed surfaces. Farther south, the wetland category takes over most of the map, leaving only limited forest islands and edges within the larger wet landscape.
Agriculture accounts for 5.12% of the supplied summary. Cropland and pasture or hay appear mostly as scattered blocks in the northern part of the county instead of a continuous agricultural belt. Their patchy arrangement is important because it prevents the 5.12% figure from being misunderstood as one large farm district. A reader using the map for a county profile can show that farming is present, but it shares the northern landscape with extensive forest, settlements, and other cover types.
Grassland at 4.41% and shrubland at 3.41% add another layer of variation. Those classes may occur around fields, disturbed areas, forest openings, or other non-forest surfaces, but the map does not identify legal land use or management. A yellow or light-green cell is a land-cover classification, not proof that a specific parcel is actively farmed, grazed, or available for development.
This version works well when the main question concerns vegetation rather than settlement. In the general map, the large wetland share can visually overshadow the smaller categories. Here, forest and agricultural surfaces are easier to separate, making it more useful for lessons about habitat edges, working land, or the transition from the mixed northern county to the wetland-dominated south.
The 1985–2025 comparison is busiest in the mixed northern landscape
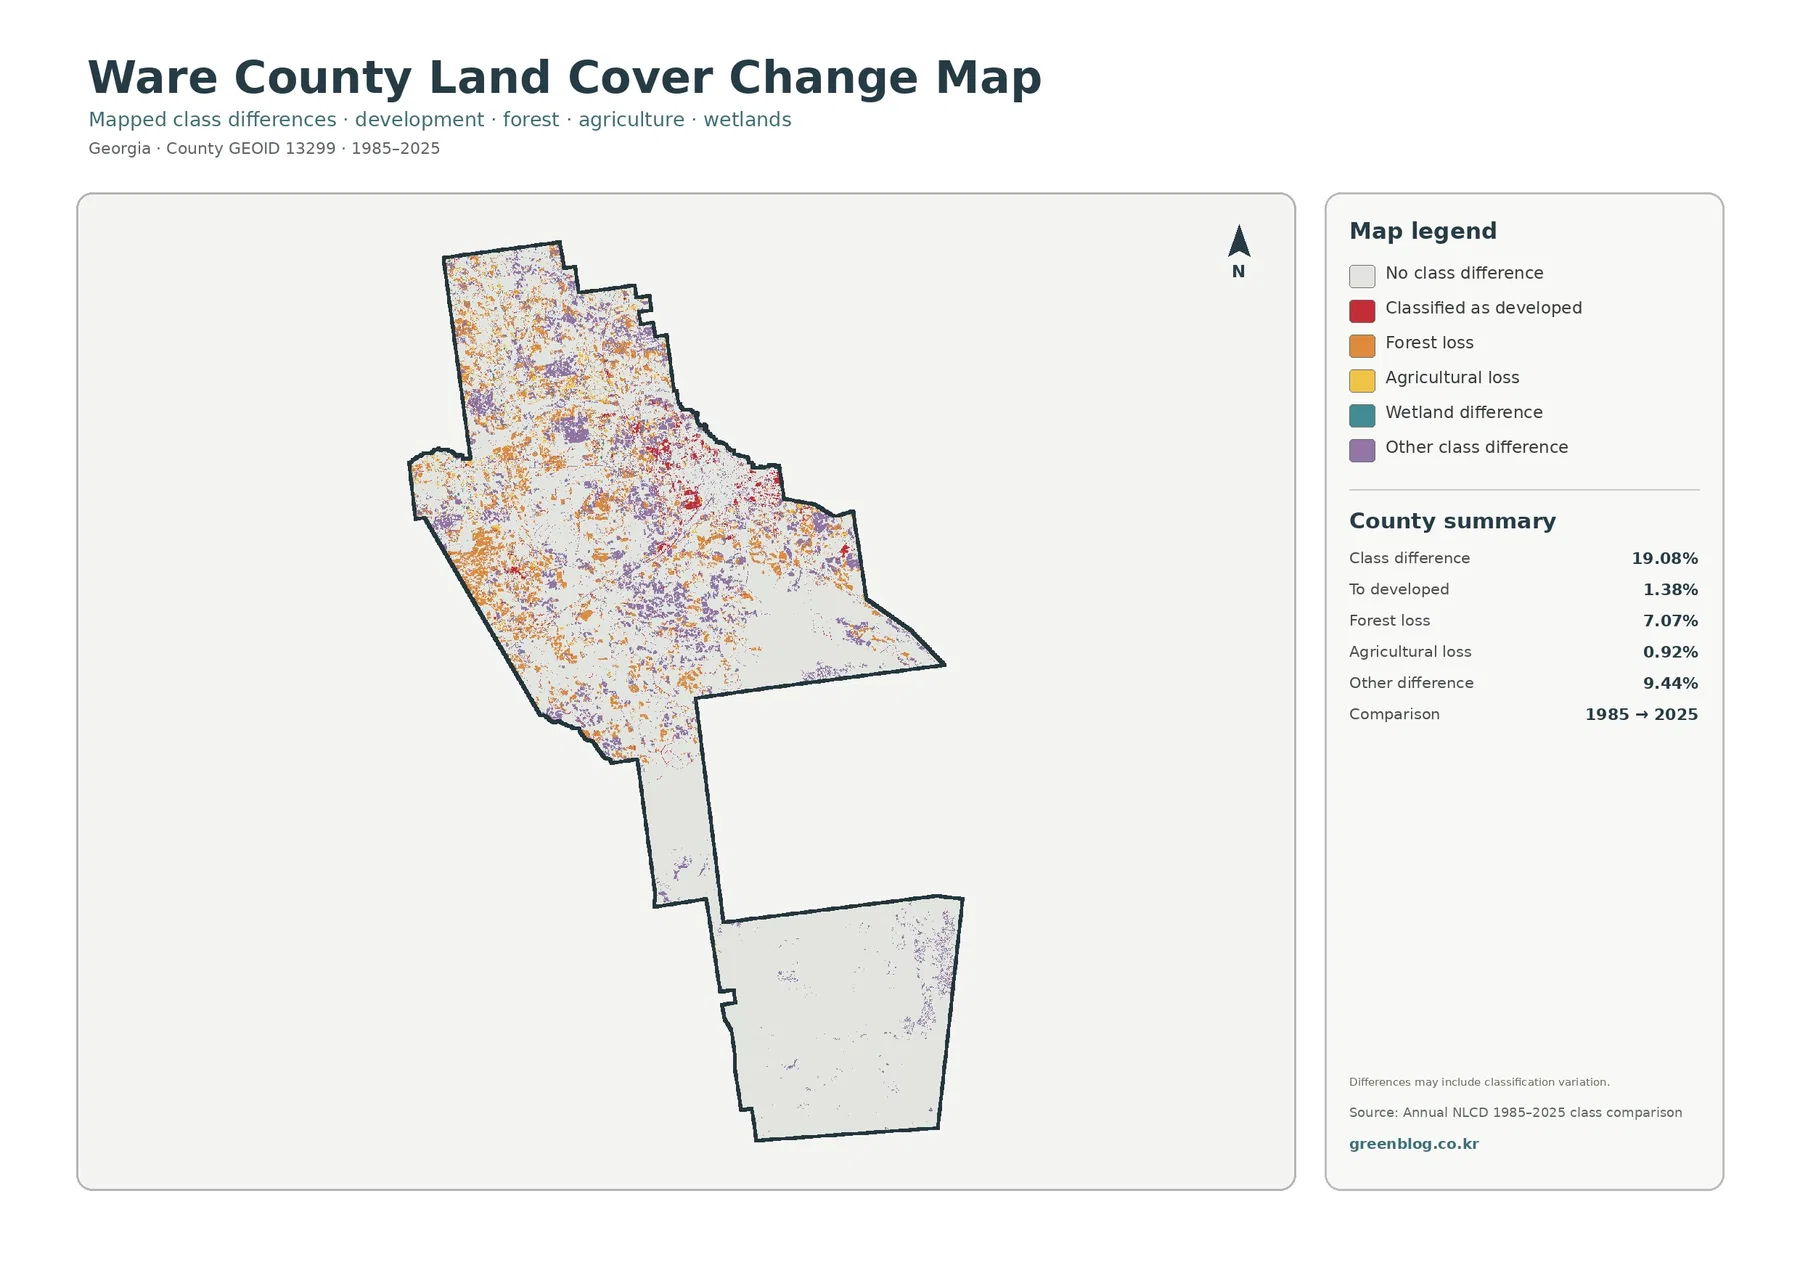
The supplied change summary reports a 19.08% class difference between 1985 and 2025. Forest loss accounts for 7.07%, areas classified as developed at the later endpoint account for 1.38%, and agricultural loss is 0.92%. Another 9.44% falls into the other-difference category. Most of the visible colored cells are scattered through the northern and central portions of the county, where the present-day land-cover map is also most varied.
The map should be read as an endpoint comparison rather than as a 40-year movie. A cell colored for change had a different classification at the 1985 and 2025 endpoints, but that does not reveal exactly when the change occurred. A site could have changed more than once during the interval, and some differences may reflect classification variation rather than a single physical event on the ground.
Forest loss is the largest named change category at 7.07%, yet the image alone cannot establish a cause. Timber harvest, conversion to another cover type, storm effects, vegetation recovery cycles, or classification differences could all contribute in different places. Intermediate-year aerial photography, forest records, and local development information would be needed before assigning a specific explanation to an individual patch.
The southern wetland area contains large stretches with no mapped class difference, although some scattered changes remain. That contrast can be useful in presentations because it shows that the countywide 19.08% figure is not evenly distributed. A single percentage describes the whole county, while the map reveals where the endpoint differences are concentrated and where they are relatively sparse.
What the 30-meter land-cover data can and cannot resolve
Annual NLCD is designed for consistent regional land-cover comparison, not parcel surveying. The data use 30-meter raster cells, meaning each square cell is assigned a predominant class even when several surfaces are present inside it. A cell near Waycross, for example, could contain a building, lawn, road edge, and trees but still be represented by one main classification.
That generalization matters along narrow roads, wetland edges, small ponds, and mixed forest-field boundaries. Enlarging the JPG makes the pixels easier to inspect, but it cannot create parcel-scale detail that is absent from the source data. Property boundaries, wetland jurisdiction, zoning, flood insurance questions, and construction decisions require more specialized and current sources.
The current maps represent the supplied 2025 observation year. Construction, logging, vegetation recovery, storm impacts, flooding, or drought effects after that date may not appear. The change map also compares only the 1985 and 2025 endpoints rather than every year in between. These limits do not reduce the value of the maps; they define the scale at which they should be used.
Choosing the right Ware County map for a report or presentation
Use the 2025 overview when the goal is to summarize the county in one image. It quickly communicates the dominance of wetlands, the secondary role of forest, and the small but concentrated developed area. The forest-and-farmland version is better when the topic is vegetation, working land, or the northern patchwork of fields and woods.
The impervious map is the clearest choice for discussing the Waycross-area concentration of roofs and pavement. It removes much of the color complexity from the general map and makes the main built center and its thinner outward corridors much easier to see. When the subject is long-term difference, use the 1985–2025 map only after establishing the current cover so the change colors are not mistaken for current land-cover classes.
For slides, avoid shrinking all four maps into a single crowded panel unless the audience only needs a quick thumbnail comparison. One large map followed by a second supporting map usually makes the legend and county pattern easier to read. A useful sequence for Ware County is the 2025 overview first, then the impervious map for development or the change map for a historical comparison.
Files included in the Ware County JPG download
The ZIP contains one original JPG for each view discussed above: 2025 land cover, forest and farmland, impervious surface and developed land, and 1985–2025 land-cover change. Each file measures 2480 × 1754 pixels. The package does not identify them as meeting an A3 high-resolution reference, so a proof print is recommended before producing a large poster.
Frequently Asked Questions
What is the largest land-cover class in Ware County?
Wetlands are the largest class at 55.08% in the supplied 2025 summary. Forest follows at 25.06%, with developed land at 6.55%, agriculture at 5.12%, grassland at 4.41%, shrubland at 3.41%, and open water at 0.25%. The extensive wetland area in the southern part of the county drives the countywide total.
Why is developed cover 6.55% while mean impervious cover is only 1.67%?
Developed classes can contain lawns, trees, soil, and other permeable surfaces in addition to roads and buildings. Impervious percentage focuses on hard surfaces such as rooftops, pavement, and parking areas. Because the two measures describe different parts of the built environment, the countywide impervious average can be much lower.
Does the 19.08% class difference mean 19.08% of Ware County was developed?
No. Only 1.38% is listed as classified to developed at the 2025 endpoint. The 19.08% total also includes 7.07% forest loss, 0.92% agricultural loss, 9.44% other difference, and classification variation that may be present. Determining the timing and cause of a specific change requires intermediate imagery and local records.
Sources and Reference Data
- MRLC Annual NLCD Data – official access point for annual land-cover and comparison products
- USGS Annual NLCD Land Cover Classification – definitions for forest, wetlands, developed land, agriculture, and other mapped classes
- U.S. Fish & Wildlife Service – Okefenokee National Wildlife Refuge – official background on the Okefenokee wetland ecosystem
- New Georgia Encyclopedia – Ware County – regional background on Ware County, Waycross, and the Okefenokee Swamp
Map File Information
The ZIP contains four original JPG maps for comparing Ware County's dominant wetlands, northern forest and farmland, Waycross-area hard surfaces, and 1985–2025 class differences.
- Included Files: Four original JPG land-cover maps used in this article
- File Type: JPG images packaged in a ZIP archive
- Intended Use: Printing, education, presentations, and map-based projects
Related Maps
- Appling County Georgia Land Cover Map
- Atkinson County Georgia Land Cover Map
- Bacon County Georgia Land Cover Map
Green Map creates custom-edited map images using open geographic data sources such as geoBoundaries, Natural Earth, OpenStreetMap, and government open data. These maps are edited visual materials, not raw data files, and are provided for education, documents, presentations, and graphic reference.