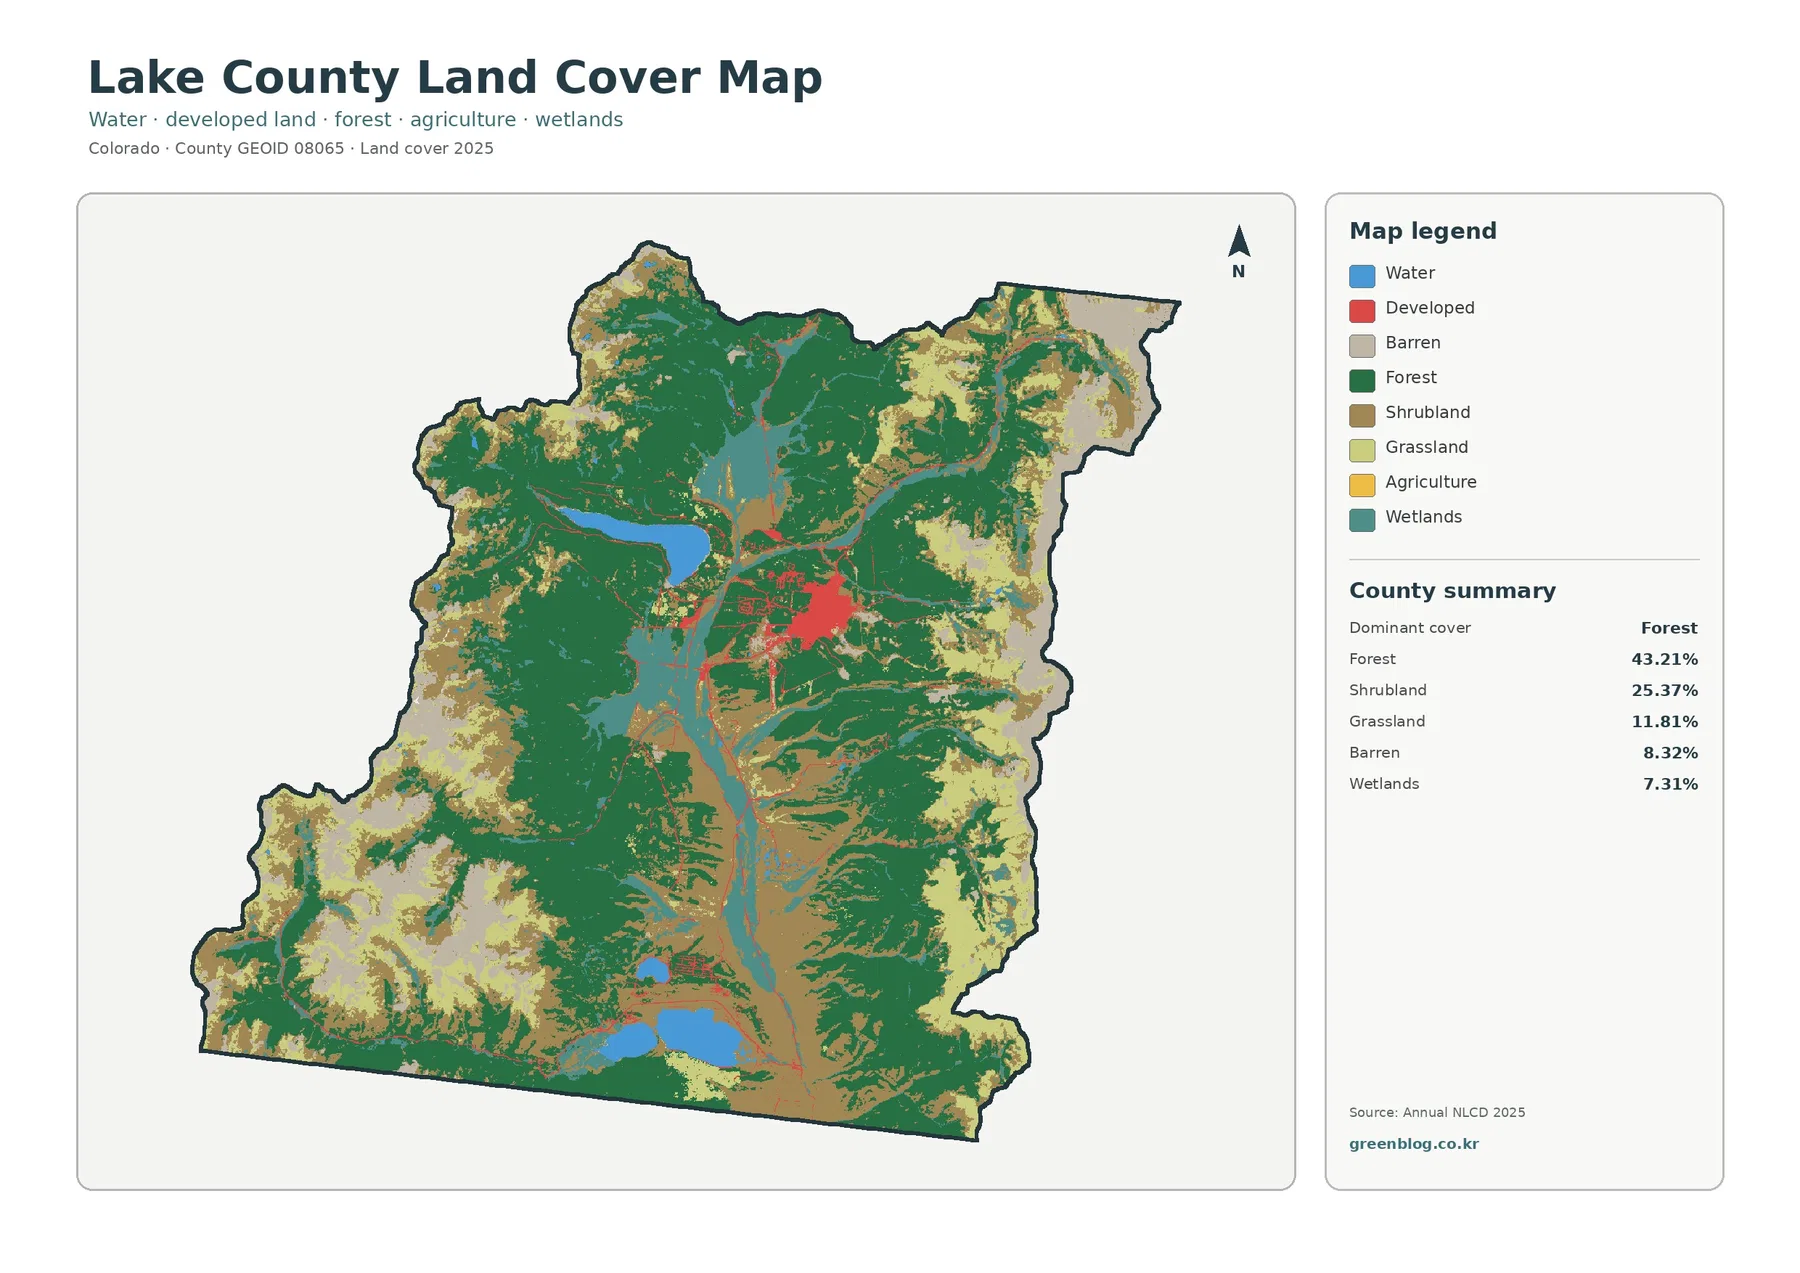
Lake County is a compact high-country county where forest, shrubland, grass, barren alpine ground, wetlands, and large lakes all appear within a relatively small outline. The 2025 summary is led by forest at 43.21%, followed by shrubland at 25.37%, grassland at 11.81%, barren cover at 8.32%, and wetlands at 7.31%. Four maps on this page separate the current surface pattern from forest-and-farmland classes, impervious surfaces, and mapped differences between 1985 and 2025.
The four original JPG maps are also available together in one ZIP download. They help compare the compact developed area around Leadville with the much larger mountain landscape and locate major water or wetland features near Turquoise Lake and Twin Lakes. The change layer then shows where the 1985 and 2025 classifications differ.
Table of Contents
A high-country mosaic rather than one continuous forest
Forest is the largest single class, but the general land-cover map is not simply a field of dark green. Broad forested areas occupy much of the central, western, and northern terrain, while shrubland fills large openings and mountain flanks. Grassland and barren classes become prominent where the forest breaks apart, especially around higher and more exposed terrain. That mixture gives Lake County a patchwork appearance that is very different from a farm-dominated plains county or a heavily urbanized metropolitan county.
The percentages help explain what the eye sees. Forest at 43.21% and shrubland at 25.37% together account for more than two-thirds of the mapped county. Grassland adds 11.81% and barren cover another 8.32%. Those open classes are not a minor edge detail; they form large areas between forest blocks and around the county’s higher mountain zones. Wetlands, at 7.31%, add another substantial surface type that often follows lower, wetter ground.
Water covers 1.81% and developed land 2.15%. Both are small by area, yet each is visually important for a different reason. Large blue water bodies provide clear reference points inside the mountain landscape, while red developed cover is concentrated enough around the center of the county to stand out sharply against forest and shrubland. Area share and visual prominence are therefore not the same thing in Lake County.
These classes describe surface cover, not legal land use. A forest pixel does not tell you who owns the land or whether it is protected, and a developed pixel is not a city limit or zoning boundary. The map is designed to summarize what type of surface was classified in the source data. Parcel ownership, building rights, zoning, and management designations require separate county or agency records.
Leadville is a small but unmistakable developed center
The developed class covers only 2.15% of Lake County, but most of it is concentrated near the middle of the county. The strongest red cluster corresponds to the Leadville area, with narrow developed traces extending away from the center along settled and transportation corridors. Once you move outside that cluster, the map returns quickly to forest, shrubland, grass, wetland, or barren mountain cover.
This concentration matters because a countywide percentage can hide local intensity. A 2.15% developed share sounds tiny, and it is tiny at the county scale, yet the central cluster is large enough to define the visual pattern around Leadville. Smaller linear features appear elsewhere, but there is no broad urban blanket. The contrast between one concentrated built area and a large natural landscape is one of the clearest county-specific features in the map set.
The county’s official comprehensive plan connects Leadville with Twin Lakes, Turquoise Lake, the Arkansas Headwaters Recreation Area, and other local assets. That local context helps orient the unlabeled land-cover image. It does not, however, prove that roads or recreational access caused the development pattern. The map only establishes that developed surfaces and transportation corridors occupy some of the same locations.
Readers should also avoid treating red pixels as municipal jurisdiction. Developed land can occur outside an incorporated boundary, and a town can contain vegetation, bare ground, water, and other classes. For a planning or permitting question, use the county’s official land-use and parcel resources. Here, the red class is most useful for seeing where the built surface is concentrated relative to the surrounding high-country cover.
The impervious map separates hard surfaces from the broader developed class
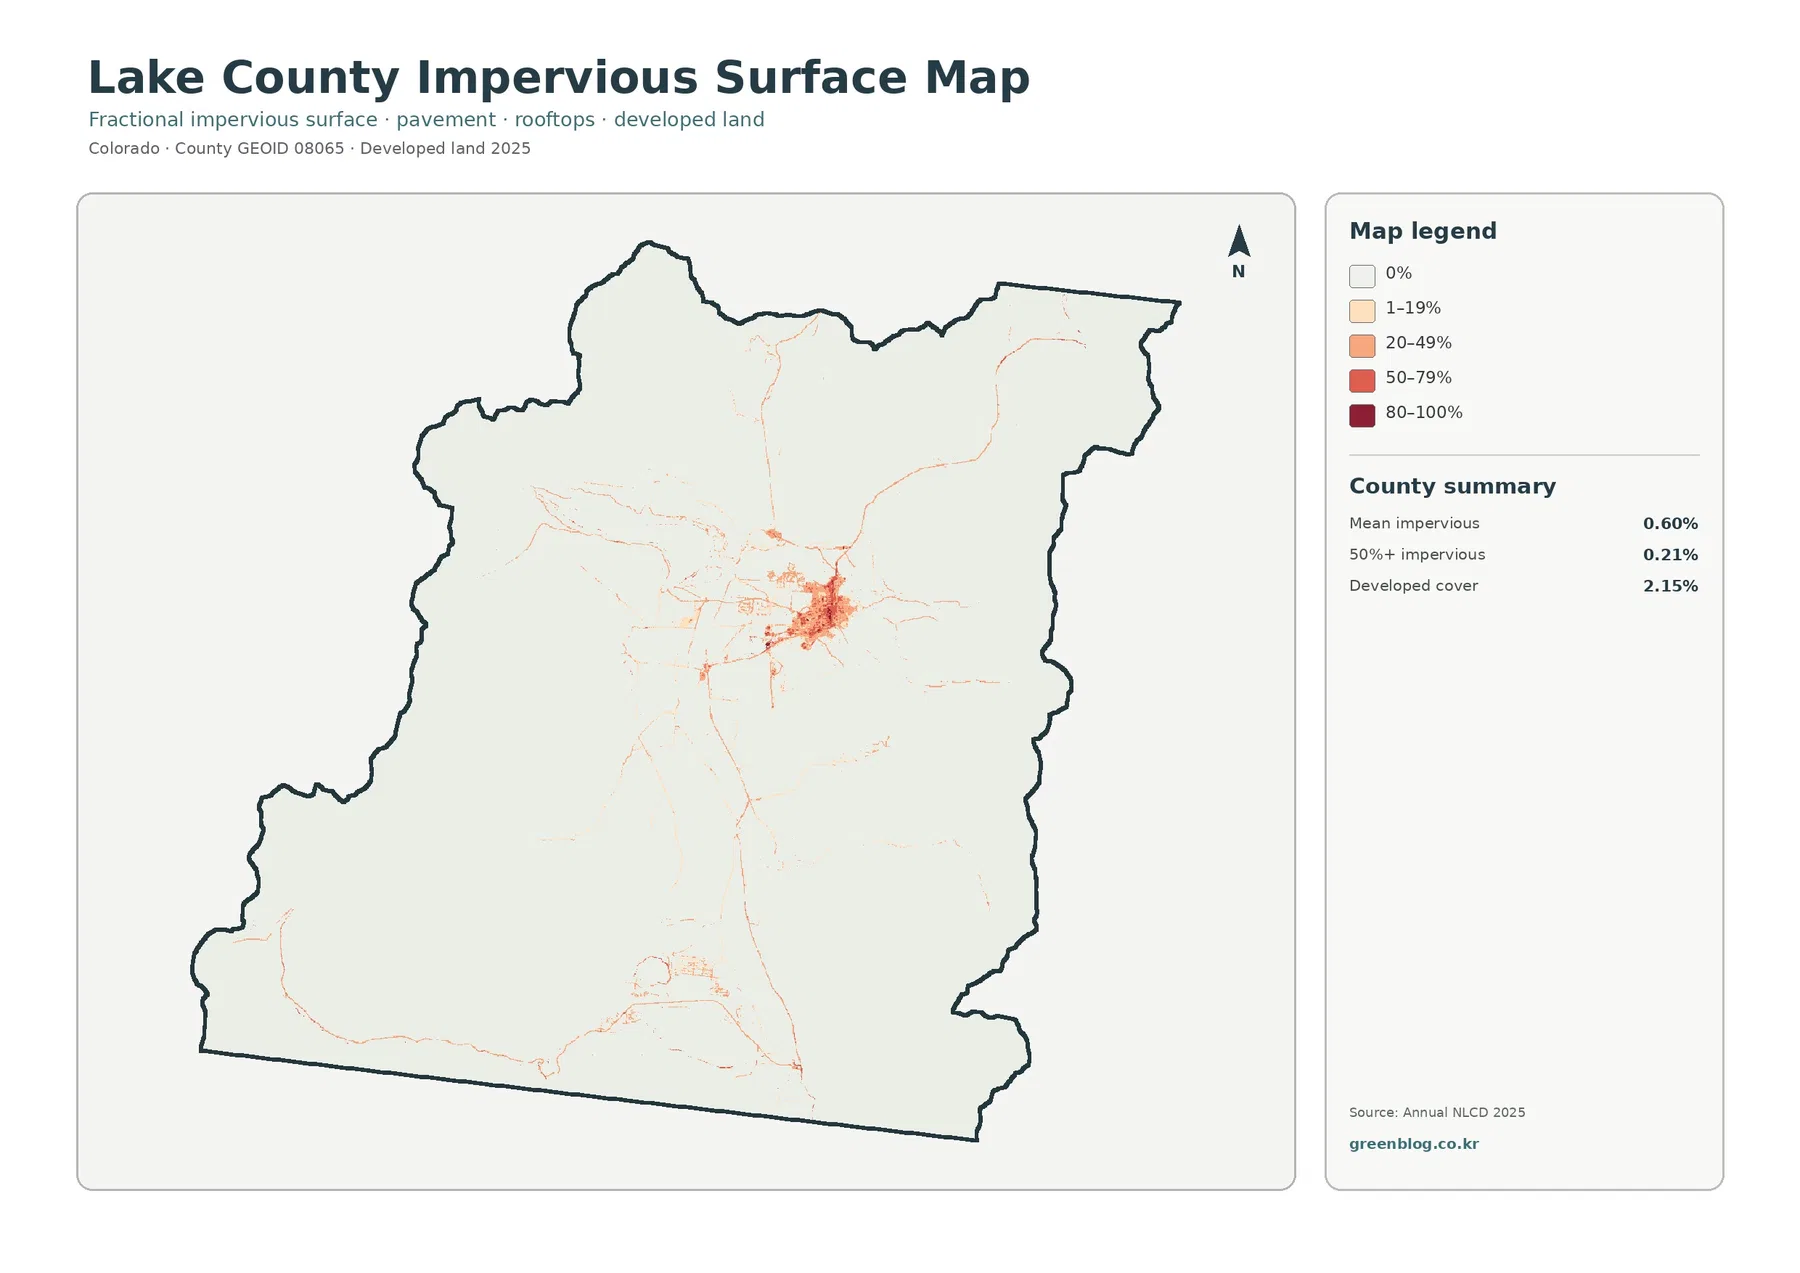
Impervious surface means pavement, rooftops, and other surfaces that water does not readily soak through. Across Lake County, the mean impervious value is only 0.60%, while land at 50% or greater imperviousness accounts for 0.21%. Those figures are much smaller than the 2.15% developed-cover share. The difference is important because a developed land-cover class can still include yards, trees, soil, and other surfaces that are not highly impervious.
The highest values form a compact core around Leadville. Fine lines and lighter values extend outward from the center, while most of the western, northeastern, and southeastern mountain areas remain nearly blank. This view removes much of the color complexity of the general map and makes one question much easier to answer: where are the county’s hard surfaces most concentrated?
That makes the layer helpful for comparing settled areas with nearby wetlands or natural cover, but it is not a runoff or flood-risk map. Water movement also depends on slope, soils, drainage systems, snowmelt, rainfall, and stream conditions. A concentrated impervious area can suggest where a closer hydrologic review may be useful, but it cannot calculate site-level runoff or establish a hazard boundary by itself.
For visual interpretation, compare the impervious map directly with the general land-cover map. The first identifies the intensity of hard surfaces, while the second shows the surrounding forest, shrubland, wetlands, water, and barren terrain. That pairing prevents a common mistake: assuming that every developed pixel has the same amount of pavement or building coverage.
Major lakes and a 7.31% wetland share give water an outsized role
Water is only 1.81% of the county summary, but several large blue shapes are easy to identify at the county scale. The prominent water body west of the central developed area corresponds to Turquoise Lake, while large southern water bodies align with the Twin Lakes area. Useful geographic context comes from the county comprehensive plan, which names Leadville, Twin Lakes, Turquoise Lake, and the Arkansas Headwaters Recreation Area among important destinations and assets.
Wetlands cover a much larger 7.31%. On the maps they often appear as elongated or patchy features in valleys and around water rather than as one large block. That distribution is important because a wetland percentage alone does not tell you how the surface is arranged. Narrow wet corridors can cross or border forest, shrubland, grassland, and developed areas even when they are less obvious in a small thumbnail.
USGS describes the Leadville North area as the northern end of the Upper Arkansas Valley and notes that the Continental Divide at Tennessee Pass separates Colorado and Arkansas River drainage. That high-mountain setting helps explain why lakes, wet valley surfaces, steep forested terrain, and open alpine cover occur so close together. The land-cover layer does not show named streams, discharge, floodplains, or water quality, so dedicated hydrology data are still necessary for detailed water questions.
A forest-and-farmland view where agriculture is essentially absent
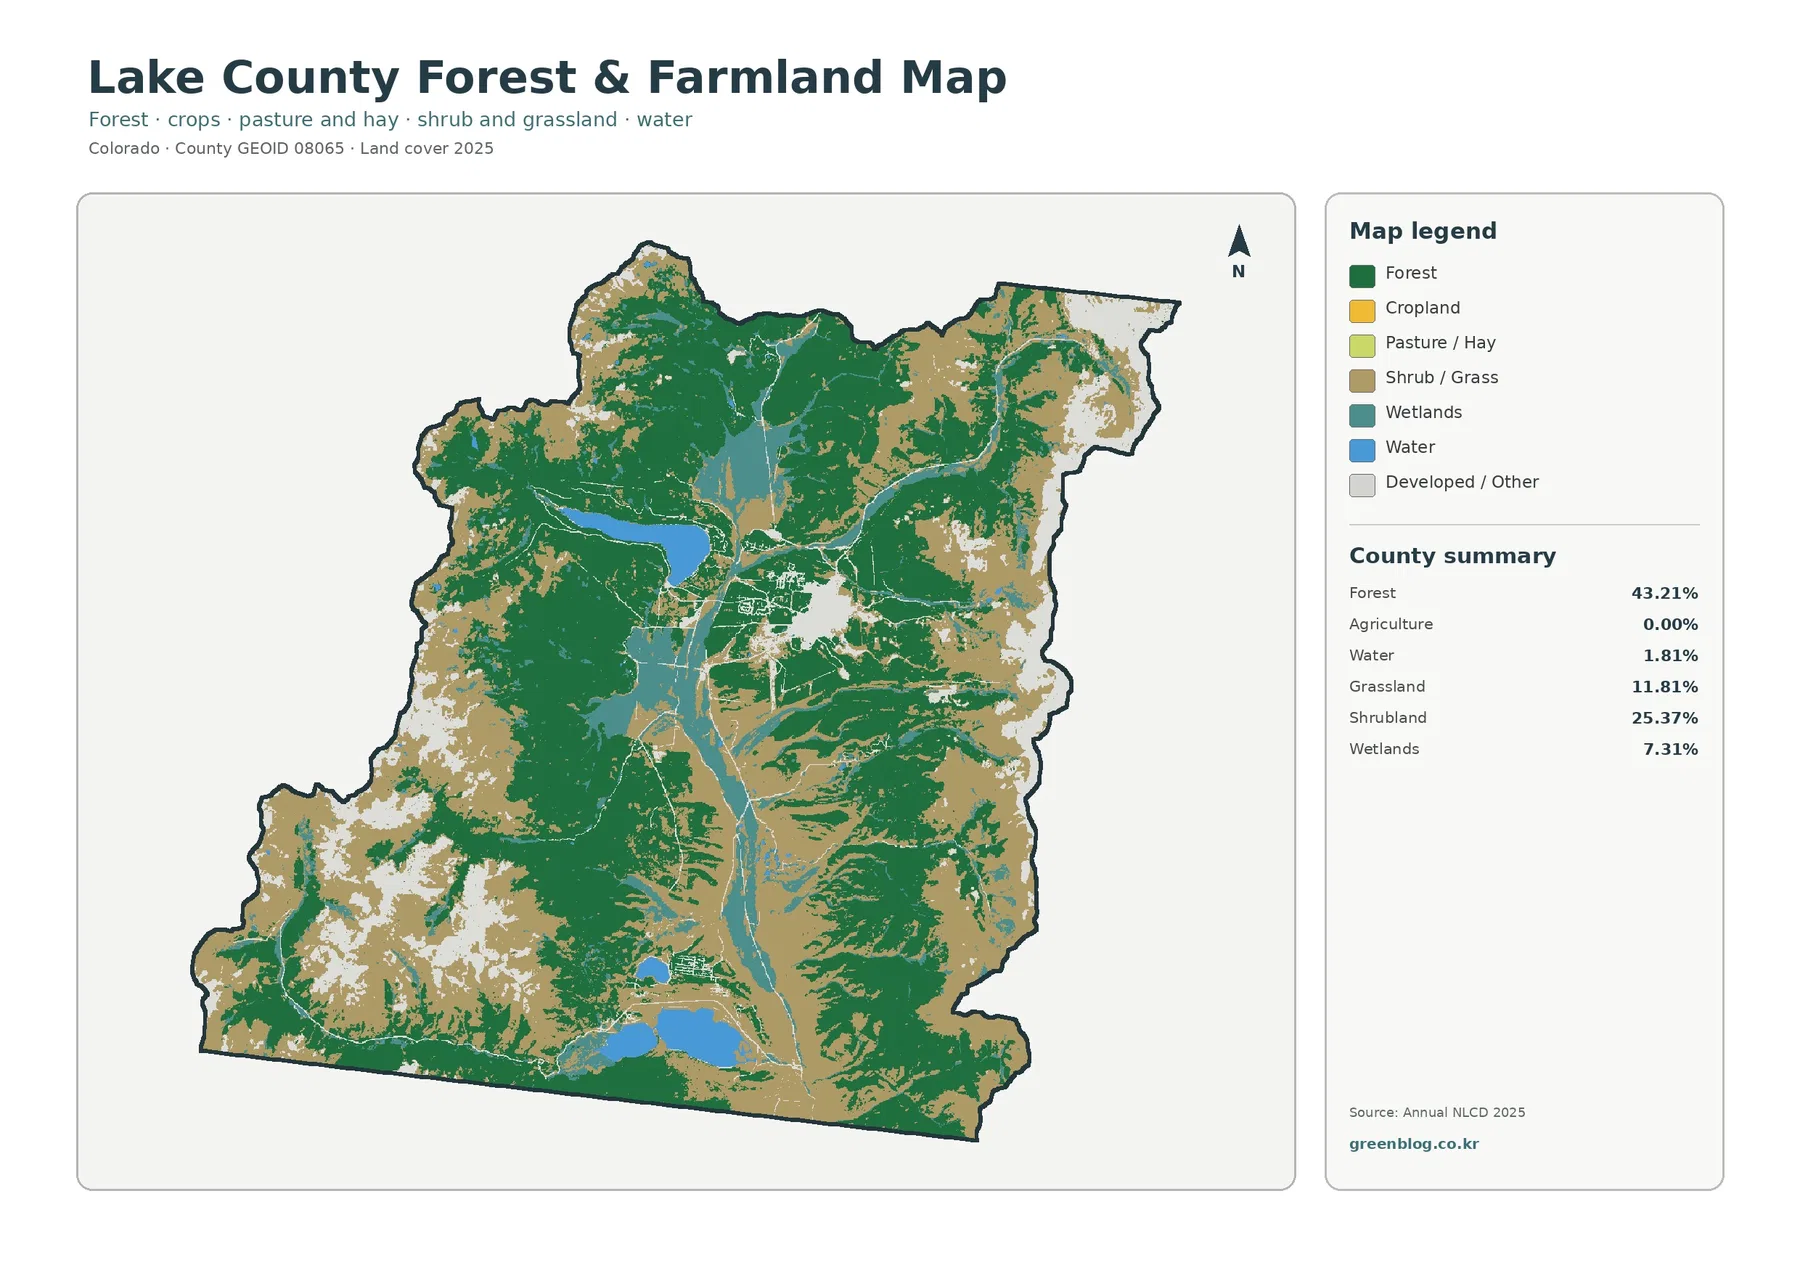
The forest-and-farmland map is especially revealing because the agriculture summary is 0.00%. That does not mean every open area is forest. Instead, shrubland, grassland, barren ground, wetlands, and water account for much of the nonforested surface. Compared with counties where fields dominate valleys and plains, Lake County’s open terrain is overwhelmingly mapped as natural or semi-natural cover rather than agricultural cover.
Forest remains at 43.21%, while shrubland at 25.37% and grassland at 11.81% fill broad spaces between wooded zones. Large water bodies stand out against those earthy and green classes, and wetlands remain visible along lower ground. The simplified legend makes it easier to follow the transition from wooded slopes to open mountain terrain without the full set of developed and barren classes competing for attention.
The 0.00% agricultural value should be read cautiously. It is a rounded county summary from a land-cover classification, not a farm census and not a statement that no small-scale agricultural activity exists. Very small areas can disappear in rounding, and grazing or open land can fall into grassland or shrub-related classes rather than an agriculture class. The safest conclusion is that mapped agricultural cover is extremely limited at this scale and in this summary.
This map is therefore best for comparing forest with the open mountain and wetland surface rather than for searching for farm districts. Around the southern lakes and the central valley, wetlands and open classes become particularly useful reference features. In the western and northern mountains, the more important contrast is between forested terrain and areas classified as shrub, grass, or other open cover.
The 1985–2025 layer is mostly stable, with scattered class differences
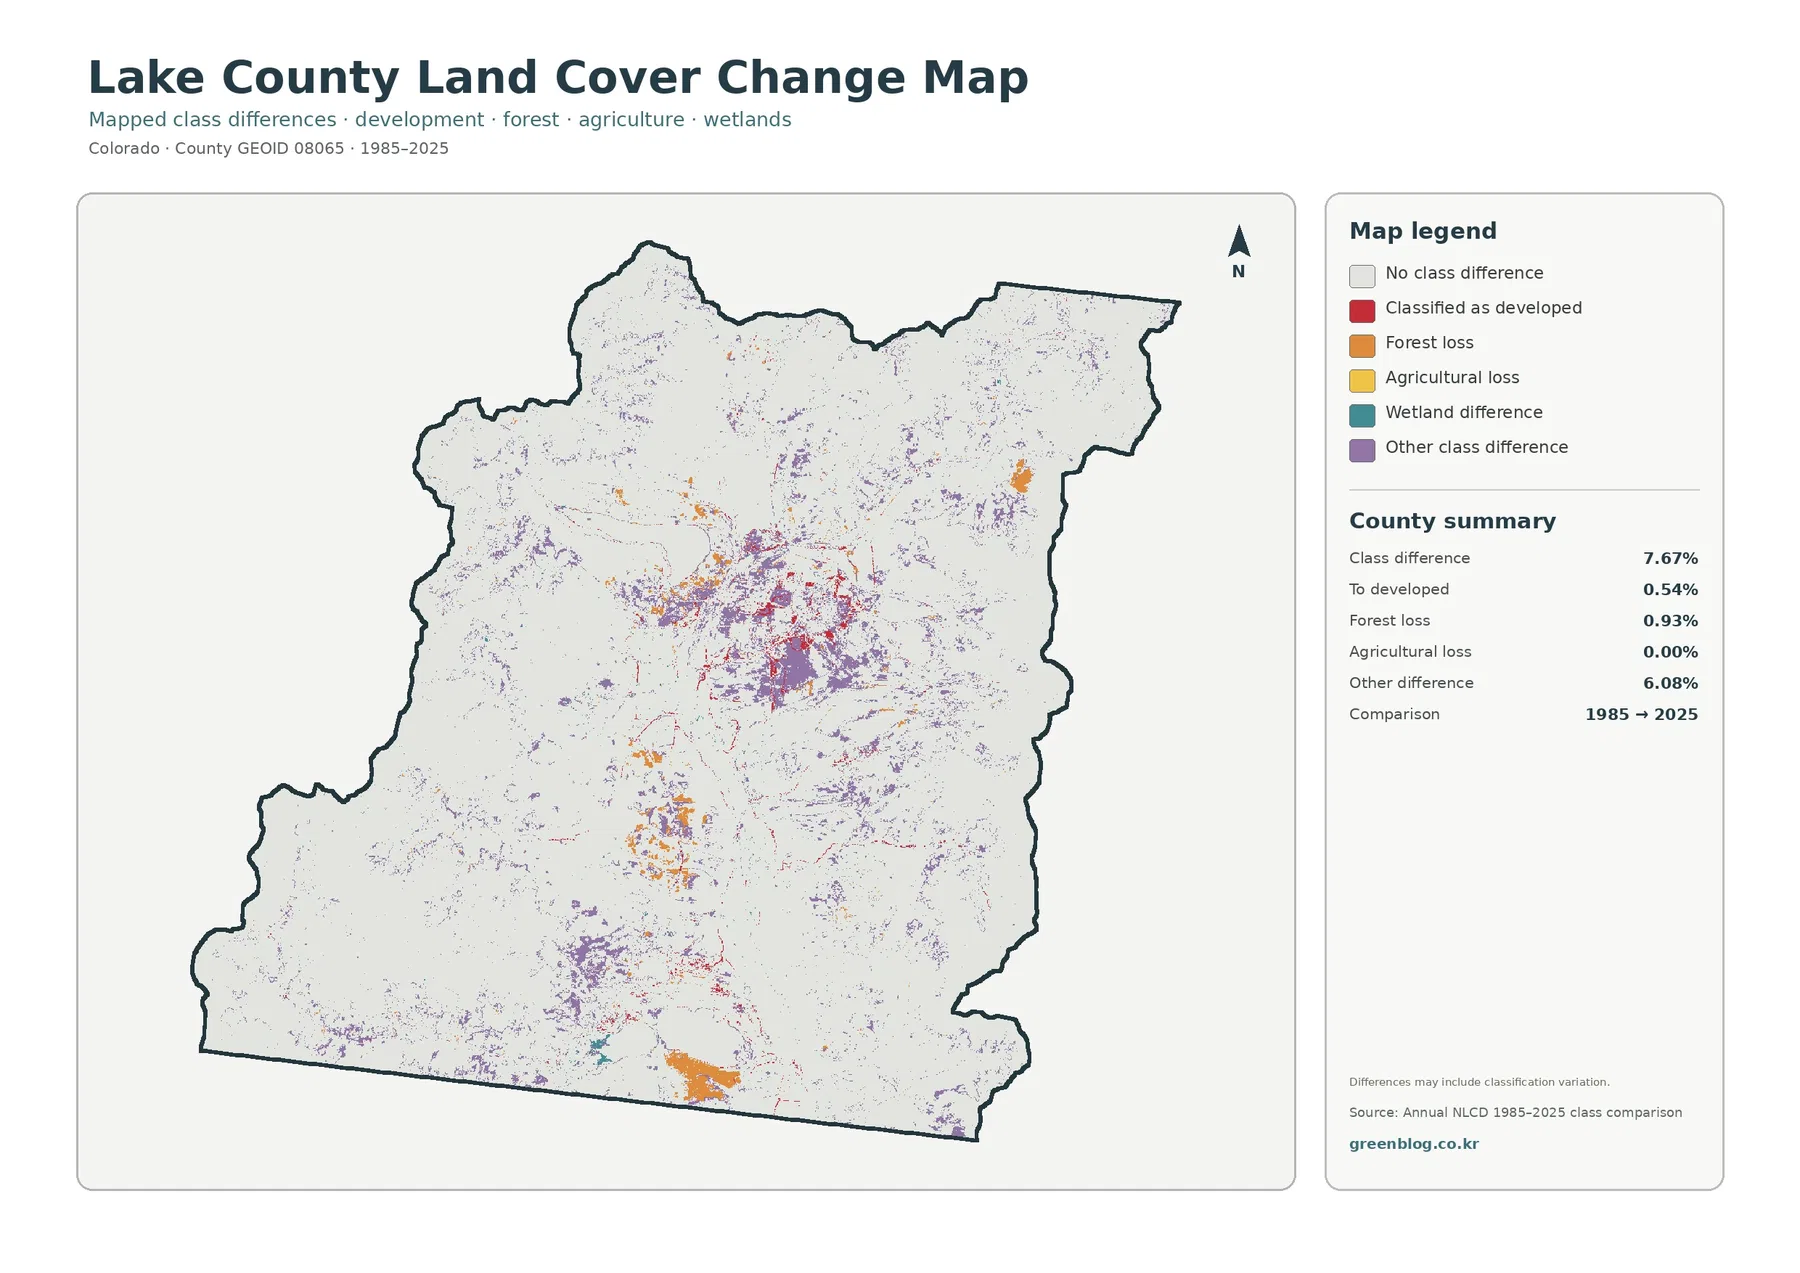
The change map compares the 1985 and 2025 classifications. A total of 7.67% of the county is marked as a class difference, leaving most of the outline in the no-difference category. Other class differences account for 6.08%, forest-loss classification for 0.93%, and change to developed for 0.54%. Agricultural loss is 0.00%, which is consistent with the extremely small agricultural presence in the current summary.
Differences are scattered rather than forming one continuous band. The central Leadville area contains a dense mix of change colors, and smaller patches occur in mountain areas to the north, south, and east. Orange forest-loss cells appear in several separate clusters rather than one massive clearing. Red change-to-developed cells are visible around the central settled area and along limited corridors, but they remain a small fraction of the county.
The forest-loss label requires careful wording. A 0.93% forest-loss classification does not prove that exactly 0.93% of Lake County was physically deforested by logging, wildfire, or development. It means that cells classified as forest in one comparison year fall into another class in the other year. Real vegetation change can contribute, but classification variation, mixed pixels, and changing surface conditions can also affect the result.
Use this map as a screening layer rather than a final explanation. If a cluster matters for a project, compare additional years from the same Annual NLCD product family, then check aerial imagery or relevant forest, fire, or planning records. Its strongest value is showing where a closer follow-up check may be worthwhile. It is not designed to tell you why every pixel changed.
How to combine the four maps without mixing their meanings
Begin with the general land-cover map when your question is simply, “What covers this part of Lake County now?” It keeps forest, shrubland, grassland, barren land, wetlands, water, and development in one view. If the location is near Leadville, switch next to the impervious map to see whether the developed area is also a concentration of pavement and rooftops. The two maps describe related but different properties of the surface.
For Turquoise Lake, Twin Lakes, or other water-focused areas, the forest-and-farmland view can be easier to read because the surrounding natural classes are simplified. It shows how blue water and wetland colors sit beside forest, shrub, and grass cover. The general map can then add back barren and developed classes when you need a fuller picture of the same location.
Finish the comparison with the change map after identifying the current class. First establish the current class, then see whether the same location is marked as a 1985–2025 difference. This order prevents a colored change pixel from being mistaken for the current surface type. A forest-loss difference, for example, does not mean the location is necessarily barren today; the current map should be checked to see what class is actually shown in 2025.
Different questions may reverse the order. A classroom exercise about urban surfaces can begin with imperviousness, while a habitat comparison may begin with forest, wetlands, and water. What matters is keeping the measurements separate: current classification, simplified forest/open-land view, fractional hard surface, and two-date class difference are four distinct layers.
Printing, teaching, and local-reference uses
For a one-page printed overview, the general land-cover map carries the most information. It is the best single choice when you need to explain why the county can be 43.21% forest yet still contain large shrub, grass, barren, wetland, and water areas. The forest-and-farmland map is a better second sheet when the goal is to simplify the natural-cover pattern and show just how limited the agricultural class is.
In a classroom, Lake County offers several useful comparisons. Water is only 1.81%, but the large lakes are easy to find. Developed cover is only 2.15%, yet Leadville is visually prominent because the red class is concentrated. Wetlands account for 7.31%, but many wetland features are narrow and can be less obvious at thumbnail scale. These contrasts help demonstrate why percentages and geographic arrangement answer different questions.
For environmental or watershed study, pair the impervious layer with wetlands and water. For mountain vegetation questions, compare forest and shrubland with the change layer. For a presentation about the county’s settled footprint, use the Leadville-centered developed cluster beside the much larger natural-cover area. Each use is stronger when the map is treated as a broad reference rather than a parcel-accurate survey.
The county comprehensive plan and USGS regional material can add names and landscape context that the land-cover graphics intentionally leave out. Leadville, Twin Lakes, Turquoise Lake, the Upper Arkansas Valley, and the Continental Divide are useful geographic anchors. They help a reader connect the colored classes to real places without turning the land-cover layer into a substitute for a road, parcel, or topographic map.
30-meter cells, mixed pixels, and the 2025 observation date
Annual NLCD is raster based at 30-meter resolution. In practical terms, the landscape is divided into grid cells and each cell is assigned a representative value or class. A cell can contain more than one real feature, such as a road beside forest or a wet shoreline beside grass. Those mixed pixels are one reason that a colored map edge should not be treated as a surveyed property line or an exact ecological boundary.
The current land-cover and impervious products on these maps represent 2025. Construction, vegetation recovery, wildfire effects, water-level changes, or other changes after the observation year may not be present. High-elevation landscapes can also look different across seasons, so very small patches deserve more caution than the broad countywide pattern.
A separate limitation comes from the two-endpoint comparison between 1985 and 2025. It does not show every transition in the four decades between them. A cell may have changed more than once before ending in its 2025 class. If timing matters, use annual data or imagery for the years in question rather than inferring a continuous history from the two-date summary.
Within those limits, the four maps give a consistent portrait of Lake County: forest and shrubland dominate, grass and barren alpine surfaces are substantial, wetlands and large lakes are important geographic features, and concentrated development is mostly associated with the Leadville area. The 1985–2025 layer marks relatively limited and scattered differences compared with counties where broad agricultural or urban conversion dominates the map.
Map File Information
The download ZIP contains all four original JPG maps described on this page. Use the files for printing, classroom display, presentation graphics, or personal reference when you need a larger image than the web preview.
- Included maps: land cover, forest & farmland, impervious/developed land, and land cover change
- Format: one ZIP containing four JPG files
- Coverage: Lake County, Colorado
Frequently Asked Questions
What is the dominant land cover in Lake County, Colorado?
Forest is the largest 2025 class at 43.21%, followed by shrubland at 25.37%. Grassland, barren cover, and wetlands also occupy substantial shares of the county.
Which map is best for seeing the built footprint around Leadville?
Use the general land-cover map to compare developed areas with surrounding natural cover, then use the impervious-surface map to see where pavement and rooftops are most concentrated.
Does 0.93% forest loss mean that exact share was definitely cleared?
No. The 0.93% figure is a mapped classification difference between 1985 and 2025, so a specific cause such as wildfire, logging, or development requires additional evidence. Map File Information Download the map files associated with this page for reference, printing, and compatible visual projects.
Map File Information
Download the map files associated with this page for reference, printing, and compatible visual projects.
- Included Files: Use only the versions confirmed in the article and supplied images
- File Type: Use the confirmed download contents
- Intended Use: Printing, education, presentations, and map-based projects
Related Maps
- Adams County Colorado Land Cover Map
- Alamosa County Colorado Land Cover Map
- Arapahoe County Colorado Land Cover Map
Sources and References
- MRLC Annual NLCD Data – access to Annual NLCD land-cover and impervious-surface products
- USGS Annual NLCD Collection 1.2 Land Cover – 2025 coverage and 30-meter product information
- USGS Annual NLCD Spatial Resolution – explanation of the 30-meter raster resolution
- Lake County Comprehensive Plan – official county context for Leadville, Twin Lakes, Turquoise Lake, and regional assets
- USGS Leadville North Quadrangle – Upper Arkansas Valley and Continental Divide context
Green Map creates custom-edited map images using open geographic data sources such as geoBoundaries, Natural Earth, OpenStreetMap, and government open data.
These maps are edited visual materials, not raw data files, and are provided for education, documents, presentations, and graphic reference.