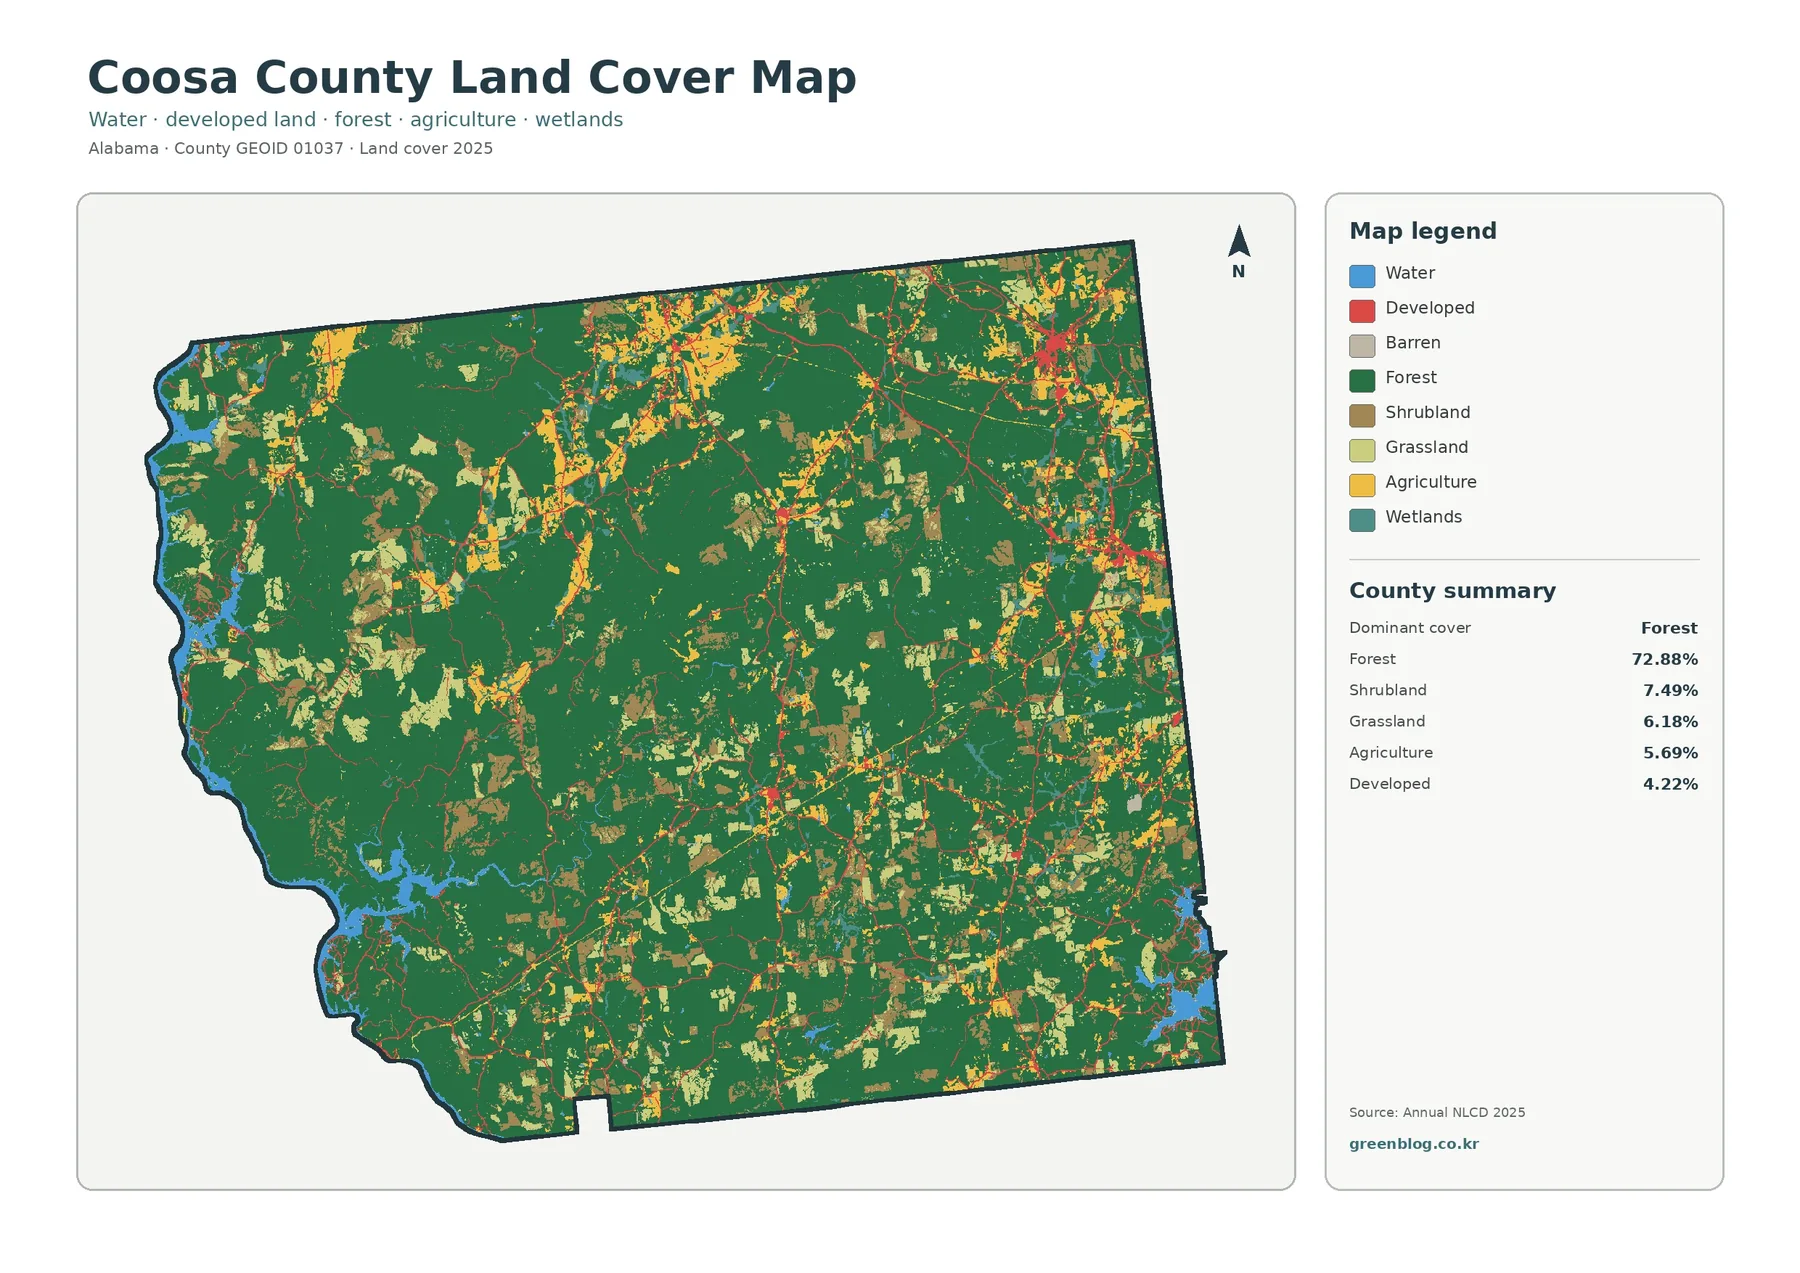
Coosa County’s 2025 land-cover summary is dominated by forest at 72.88%, a much larger share than any other mapped class. Shrubland accounts for 7.49%, grassland 6.18%, agriculture 5.69%, developed land 4.22%, water 2.19%, and wetlands 1.24%. On the map, that imbalance is immediately visible: dark green covers most of the county while farms, open vegetation, towns, and water appear as smaller interruptions within a broad wooded interior.
This page provides four views of the same county: current land cover, a forest-and-farmland view, impervious surface and developed land, and a 1985–2025 class-difference map. The article uses WebP previews for quick viewing, while the four original JPG maps are available together in one download. Comparing the views is useful for seeing how reservoir shorelines, wooded areas, open land, and small settlement footprints relate to one another without treating any single map as a parcel or zoning map.
Table of Contents
Reservoir shorelines make a useful frame for a heavily wooded county
Coosa County is in east-central Alabama, and trusted regional references identify the Coosa River as its major waterway. The county is associated with Lay Lake and Mitchell Lake along the Coosa River, while part of Lake Martin lies in the southeastern corner. Those water bodies help orient the land-cover map. Blue water is visible along portions of the western side and in the southeast, making it easier to locate the surrounding forest and the smaller open-land patches inside the county.
The water share is only 2.19%, so the county is not a water-dominated landscape by area. Its importance is spatial rather than numerical. Reservoir edges create recognizable boundaries and coves, while the interior remains mostly forested. The shoreline context is especially useful when comparing the general map with the forest-and-farmland map because the same blue reference points stay visible while other classes are simplified.
Mitchell Lake provides a good example of why local geography matters when reading these colors. Outdoor Alabama describes it as a 5,850-acre impoundment on the Coosa River with 147 miles of shoreline, and the lake spans the Coosa–Chilton area. Those figures are not part of the county land-cover percentages; they are background information that explains why water and forest edges are meaningful reference features on the western side of the map.
Wetlands account for 1.24% of the 2025 summary and appear in smaller teal areas near water and low-lying drainage settings. Annual NLCD wetland classes are remotely mapped land-cover categories, not legal wetland determinations. A property-level wetland review would require more detailed wetland data and, when necessary, field work. The county map is best used to locate broad patterns before moving to site-specific sources.
Open land appears as scattered breaks rather than one continuous farm belt
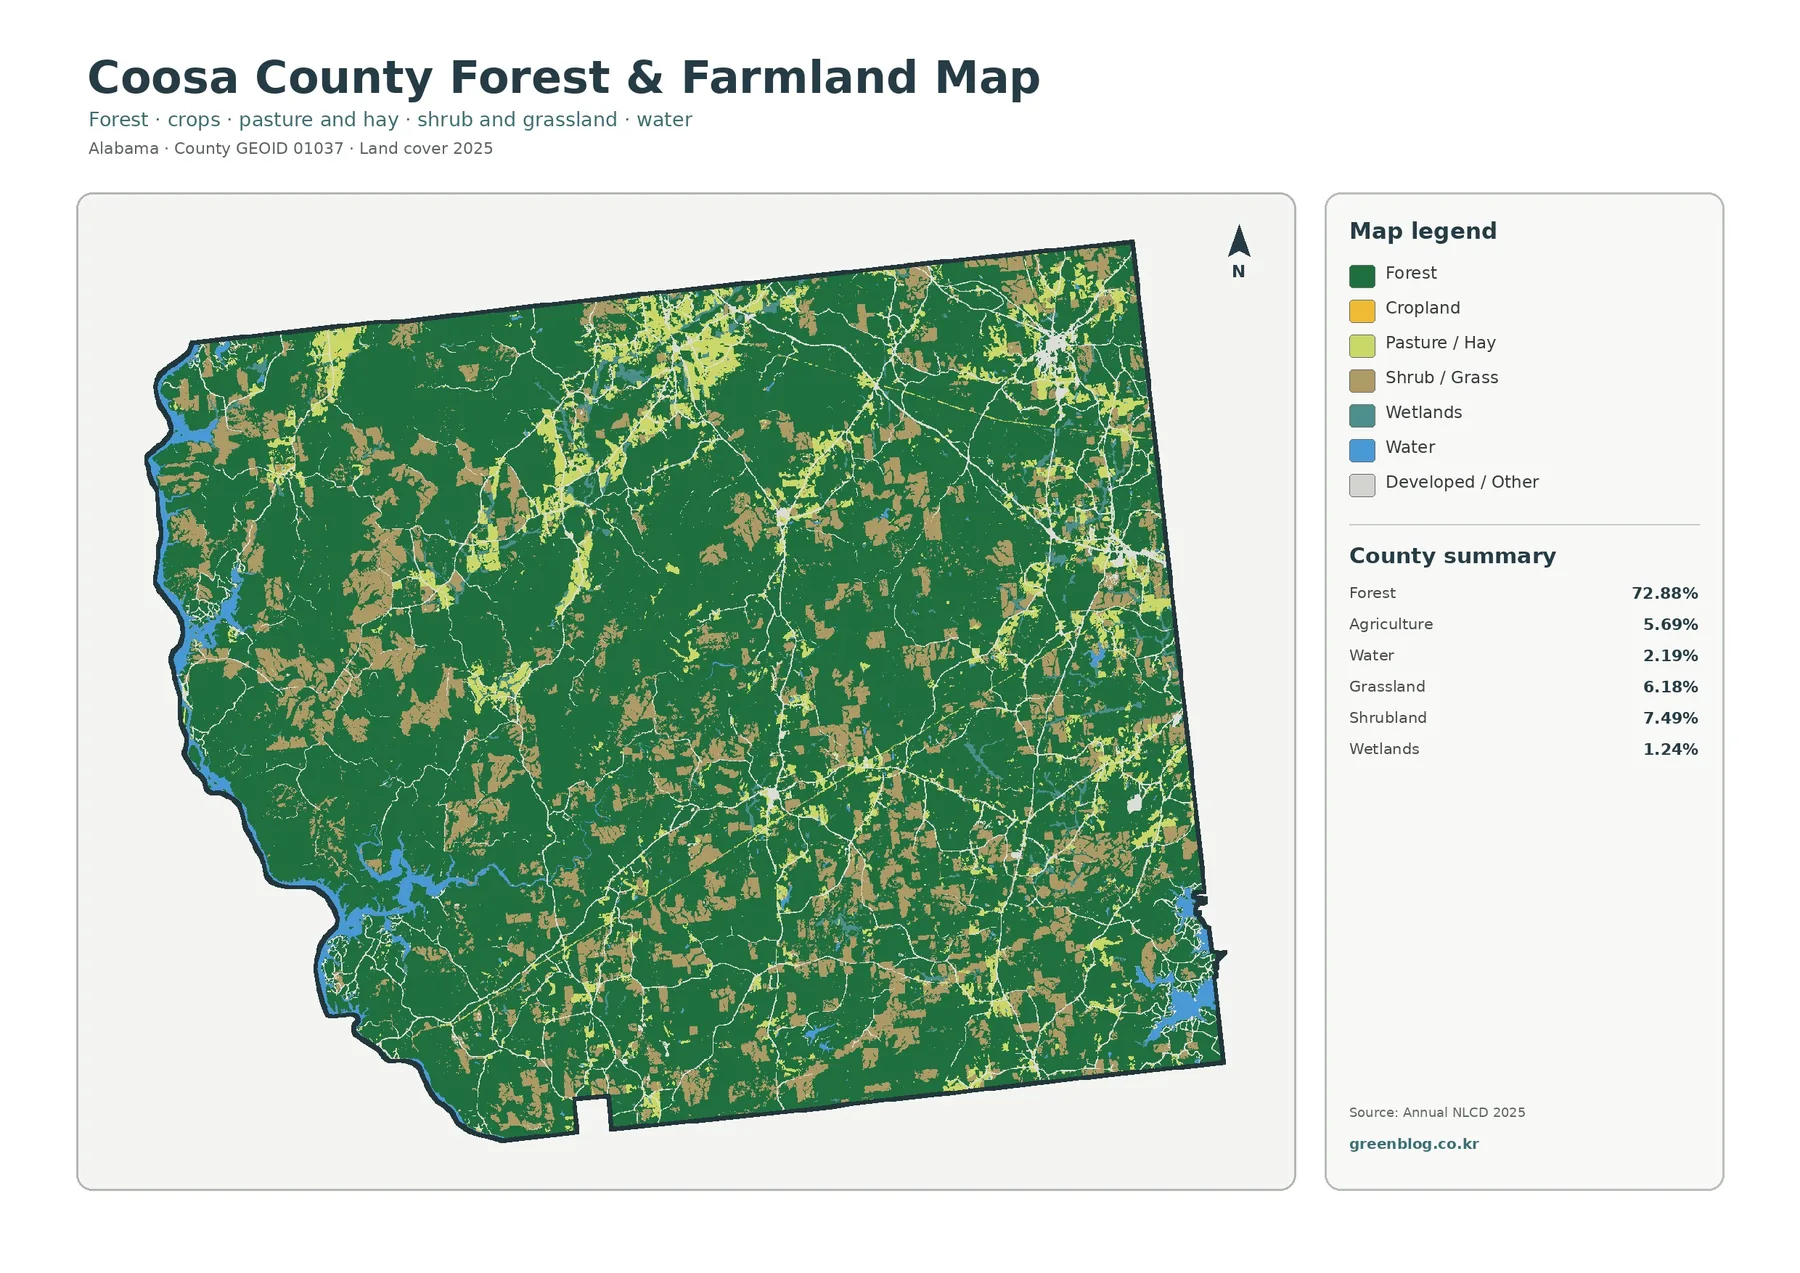
The forest-and-farmland map makes the county’s smaller open classes easier to see. Forest remains the dominant background at 72.88%, but cropland, pasture or hay, and shrub or grass areas interrupt it in many places. Some of the brighter patches are more frequent toward the north and east, with additional open areas in the south and central parts of the county. The result is a patchwork of open ground within a wooded county rather than a single large agricultural plain.
Agriculture is 5.69% of the current summary, while grassland is 6.18% and shrubland is 7.49%. Looking at those classes together changes the interpretation. Agriculture by itself is a relatively small share, but the combined presence of crops, pasture or hay, and other open vegetation creates many forest edges. This is why a countywide percentage and a map answer different questions: the percentage describes total share, while the image shows where that share is broken into many separate pieces.
Land cover should not be confused with legal land use. An NLCD agriculture class indicates the surface was classified as an agricultural cover type from remotely sensed information. It does not establish ownership, agricultural tax status, zoning, or a property boundary. Forest cover likewise describes tree-covered ground rather than public ownership, timber rights, or conservation status. Those questions require county property records, planning information, or other specialized sources.
For practical orientation, Rockford is the county seat and Goodwater is identified by regional references as the county’s largest incorporated community. The Alabama Cooperative Extension office for Coosa County is in Rockford, and its directions reference both U.S. 231 and U.S. 280. These places and routes provide useful real-world context when comparing open-land patches with settlement areas, although the land-cover image itself does not label roads or municipal boundaries.
Hard surfaces are sparse countywide but visible around compact activity centers
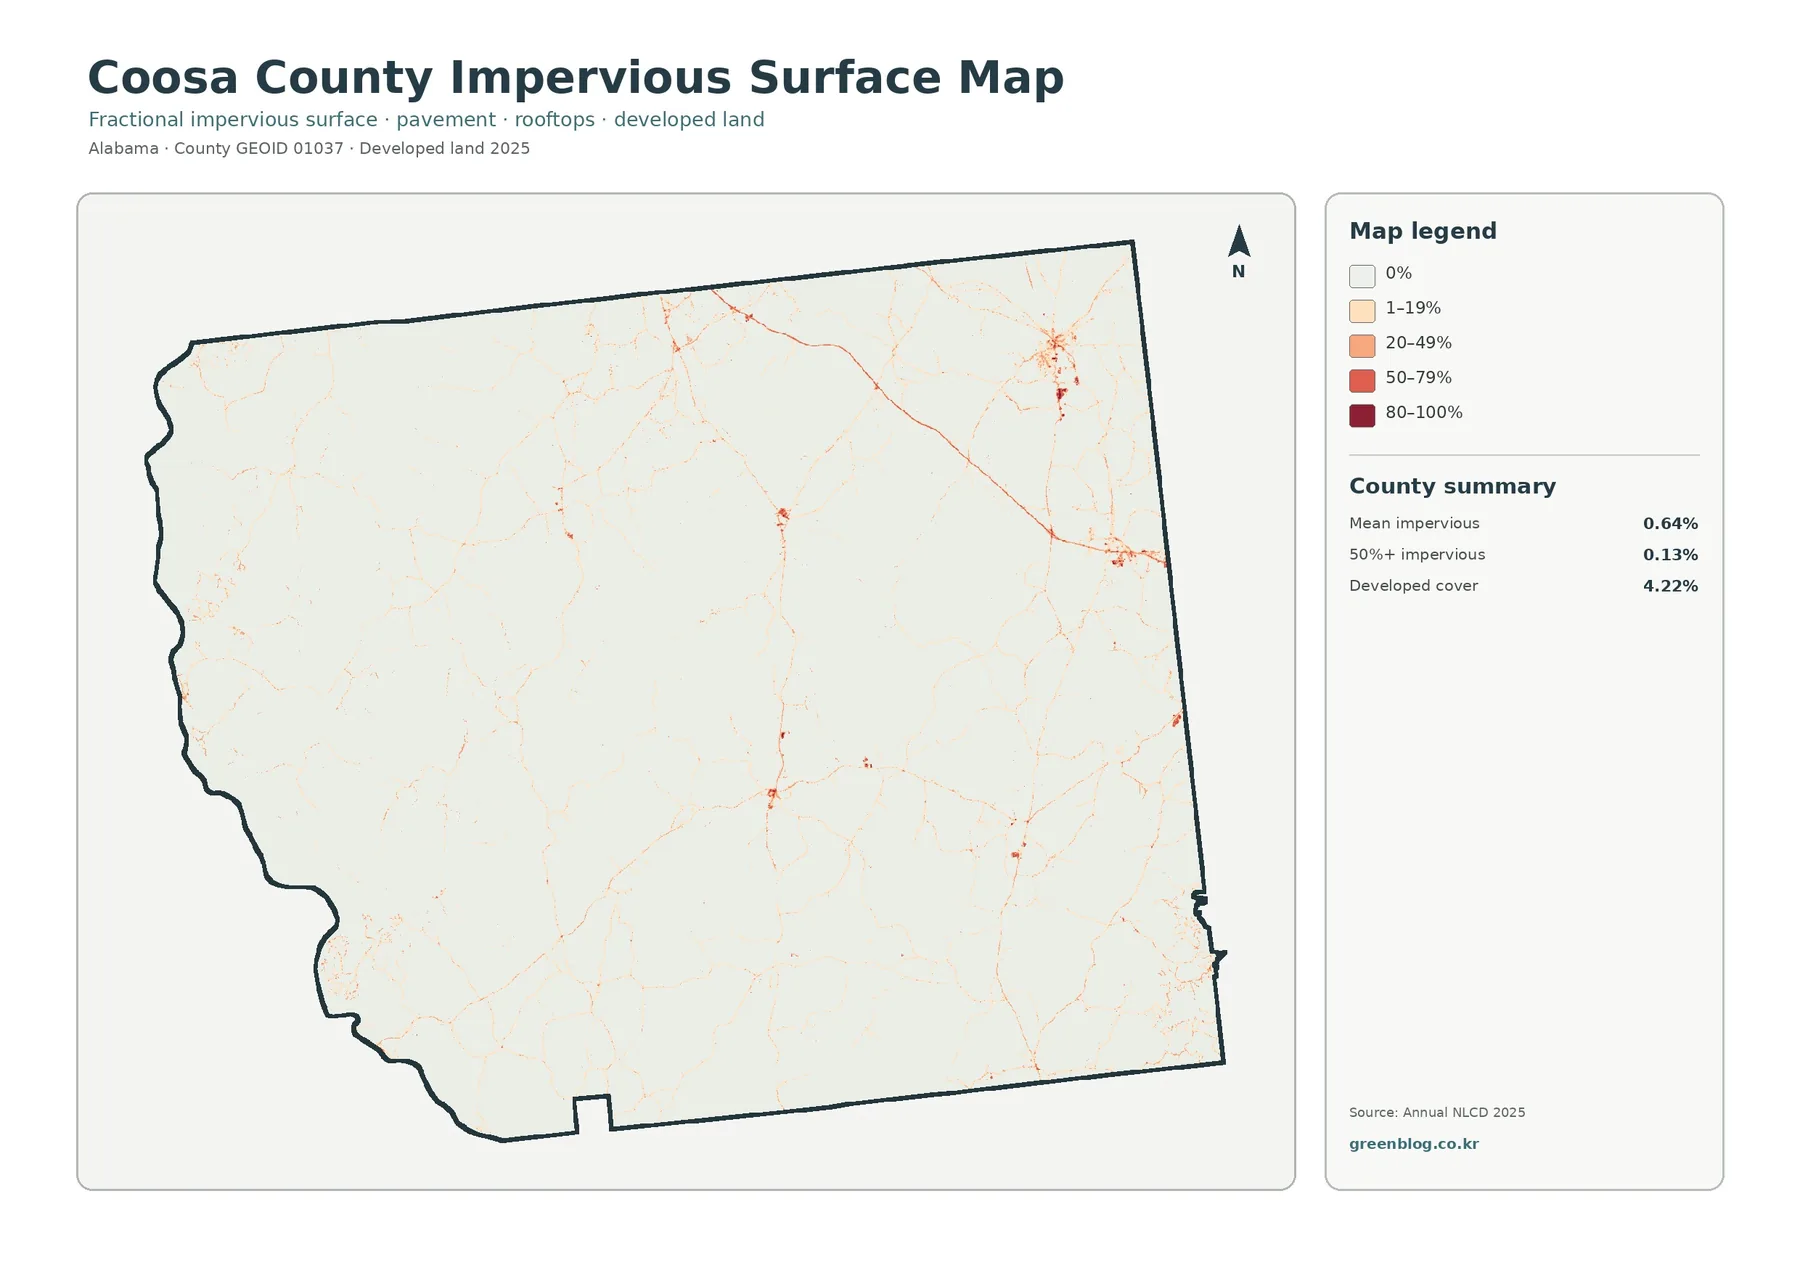
Impervious surface means rooftops, pavement, parking areas, and other hard surfaces that do not readily absorb rainfall. Coosa County’s mean impervious value is 0.64%, and only 0.13% of the county is mapped at 50% impervious or higher. Developed land covers 4.22%, which is a different measure. A developed land-cover class can contain lawns, trees, bare soil, and other permeable surfaces along with buildings and roads, so it is expected to be larger than the countywide impervious average.
Most of the impervious map is nearly white, matching the county’s large forest share. Small orange and red clusters stand out in the northeast, around the central and eastern portions, and in a few southern locations. Thin lines also connect some of these clusters. The pattern is consistent with a rural county where roads and small communities create localized hard surfaces instead of one continuous urbanized area.
Rockford and Goodwater are useful reference points for understanding that pattern, but the raster does not draw city limits. It would be a mistake to treat every colored cell near a town as a specific neighborhood or parcel. A 30-meter grid cell can contain a mix of road, roof, lawn, trees, and soil. The impervious percentage summarizes the hard-surface fraction within the mapped data, not a surveyed property boundary.
This map can support a broad discussion of runoff because hard surfaces tend to shed water rather than absorb it, but it is not a flood-hazard map. Flood risk also depends on elevation, rainfall, soils, drainage systems, river or reservoir levels, and other conditions. Use the impervious layer to identify where hard surfaces are concentrated, then consult elevation, floodplain, drainage, and current local data for any site-level decision.
The 40.18% class-difference figure is not a 40-year development rate
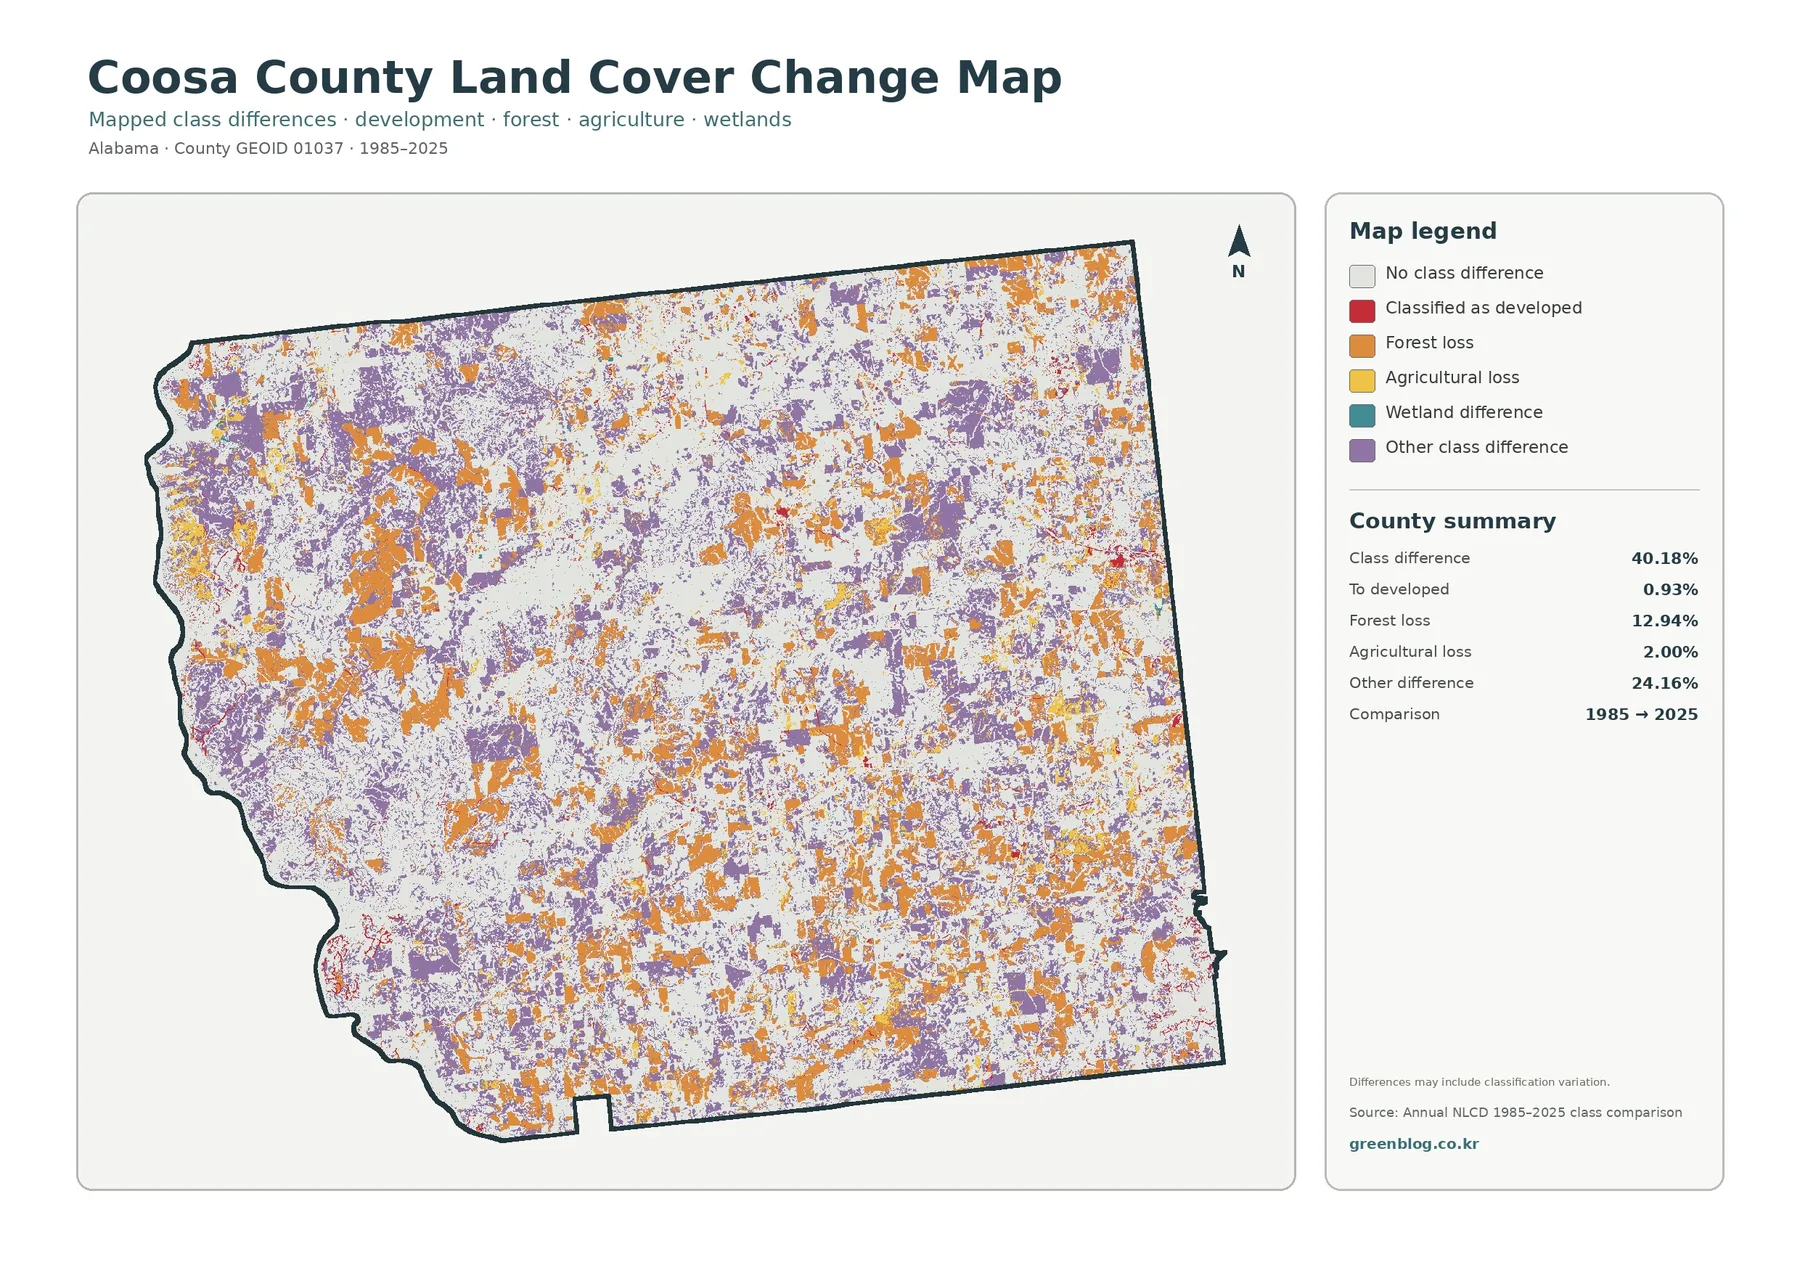
The change map compares land-cover classifications at two endpoints, 1985 and 2025. It reports that 40.18% of Coosa County was assigned a different class at those two dates. The summary also lists 0.93% classified to developed, 12.94% forest loss, 2.00% agricultural loss, and 24.16% other class difference. Wetland difference is shown in the legend as its own mapped category, but the summary does not provide a separate percentage, so no additional value should be inferred.
Orange forest-loss areas and purple other-difference areas are scattered widely across the county, while agricultural-loss patches are smaller and less extensive. Red areas classified to developed are visible near some activity centers, yet the 0.93% value shows they account for only a small portion of the overall difference. Calling the full 40.18% “development” would therefore misrepresent what the map measures.
Forest loss also needs careful wording. The 12.94% figure means cells mapped as forest in 1985 were mapped as another class in 2025. It does not identify a single cause or describe everything that happened between those years. Timber harvest and regrowth, conversion to open land, development, natural vegetation changes, and classification differences can all require separate evidence. A two-date comparison cannot reveal the exact sequence of changes within the intervening four decades.
The map itself notes that class differences may include classification variation. This matters along mixed edges where forest, shrubland, grassland, agriculture, water, and wetland cover can occur within or near the same 30-meter cells. Use the change map to locate areas worth a closer look, not to assign a cause automatically. Annual NLCD time-series data, aerial imagery, and field or local records are more appropriate when timing and cause are important.
A simple way to compare the four maps without mixing their meanings
Begin with the general 2025 map and identify the dominant forest and the blue reservoir or river edges. Those features create a stable frame for the county. Next, look for the brighter agriculture, grassland, and shrubland patches inside the forest. This first pass answers the basic question of what covers the county now and where the main contrasts are located.
Move next to the forest-and-farmland view if the open-land pattern matters. Because the legend is simplified, crop and pasture areas are easier to compare with the surrounding forest. Then switch to the impervious map at the same locations. A place can be classified as developed yet still have a relatively small hard-surface fraction because vegetation and other permeable ground are included within the developed class.
Save the change map for last. It answers a different question: whether the endpoint classes match. A dark-green forest area on the 2025 map may or may not have been forest in 1985, and a colored difference cell does not necessarily mean urban growth. Keeping “current condition” separate from “endpoint difference” prevents one of the most common mistakes when reading the four images together.
For comparisons with another county, match the year and statistic. Compare Coosa County’s 72.88% forest share with another county’s 2025 forest share, its 0.64% mean impervious value with the same 2025 metric, and its 40.18% class difference with another 1985–2025 endpoint comparison. Mixing years or data products can make methodological differences look like geographic differences.
Download the four original JPG maps for reference, classwork, or presentations
The download archive contains four original JPG files: the 2025 land-cover overview, the forest-and-farmland map, the impervious/developed-land map, and the 1985–2025 class-difference map. Each JPG is 2480×1754 pixels. The WebP previews displayed in the article are 1800×1273 pixels, so the downloadable JPGs provide the larger supplied image size for documents and slides.
The asset manifest does not mark these files as meeting an A3 high-resolution reference. If you plan to print at A3 or larger, test the output before preparing a final poster, especially the legend and small summary text. Upscaling the image can increase print dimensions, but it cannot add land-cover detail that was not present in the underlying raster data.
When using several maps in one project, keep their years and statistics in the captions. Forest 72.88% and agriculture 5.69% belong to the 2025 cover summary. Mean impervious 0.64% belongs to the hard-surface map. The 40.18% value is the 1985–2025 class difference. Labeling those values clearly helps readers avoid treating them as interchangeable measurements.
What the 30-meter data can and cannot tell you
Annual NLCD is raster land-cover data rather than a parcel map. Its 30-meter cells summarize the surface at a scale where trees, grass, a narrow road, rooftops, soil, and water can sometimes share the same area. A single mapped class therefore represents the cell’s classified cover rather than every object inside it. Zooming in enlarges the cell but does not reveal new property-level detail.
This scale is especially important around forest edges and open land. A recently cut stand, regenerating vegetation, pasture with scattered trees, and a wooded stream corridor can produce complex transitions that are simplified in the classification. The same principle applies to narrow wetland margins and small developed features. The maps are strong for countywide comparison but should not substitute for surveying, permitting, legal wetland delineation, or property research.
The dates matter as well. The current maps represent 2025, so later construction, timber activity, regrowth, or farming changes are not included. The change map compares only 1985 and 2025, not every year between them. If the timing of a change matters, use the Annual NLCD series or other dated imagery to build a more complete sequence.
Finally, land cover is not zoning or ownership. A forest-classified cell is not automatically public forest, protected land, or land where timber harvest is restricted. A developed-class cell does not reveal a zoning category or building permission. Alabama Department of Revenue county property links and local records are more appropriate for parcel and assessment questions. These maps are intended to show broad surface patterns and guide the next stage of research.
Frequently Asked Questions
What is the dominant 2025 land-cover class in Coosa County?
Forest is dominant at 72.88%. Shrubland is 7.49%, grassland 6.18%, agriculture 5.69%, developed land 4.22%, water 2.19%, and wetlands 1.24%. The map shows forest extending across most of the county, with open and developed areas broken into much smaller patches.
Why do water features stand out even though water is only 2.19%?
Water occupies a modest share of the county, but the Coosa River reservoir system and the southeastern Lake Martin area create distinctive edges that are easy to recognize. Lay Lake and Mitchell Lake are associated with the Coosa River side of the county, and part of Lake Martin lies in the southeast. These features are useful orientation points when comparing all four maps.
Why is developed land 4.22% while mean impervious cover is only 0.64%?
Developed land is a broader land-cover class that can include vegetation and other permeable surfaces around buildings and roads. Impervious cover measures the hard surfaces themselves, such as roofs and pavement. Only 0.13% of Coosa County is mapped at 50% impervious or higher, so hard surfaces are concentrated in relatively small areas.
Does the 40.18% class difference mean 40.18% of the county was developed after 1985?
No. The figure counts cells assigned different classes at the 1985 and 2025 endpoints. The map separately reports 0.93% classified to developed, 12.94% forest loss, 2.00% agricultural loss, and 24.16% other class difference. Classification variation can also contribute to mapped differences, so the total is not a development rate.
What files are included in the download?
The ZIP contains the four supplied JPG maps: current land cover, forest and farmland, impervious/developed land, and the 1985–2025 class-difference map. Each JPG is 2480×1754 pixels. The asset manifest does not label the files as meeting an A3 high-resolution reference, so test print quality before using them for a large-format poster.
Map File Information
Coosa County Land Cover Maps 2025 land cover, forest & farmland, impervious/developed land, and 1985–2025 class-difference maps in four original JPG files
- Included Files: Use only the versions confirmed in the article and supplied images
- File Type: Use the confirmed download contents
- Intended Use: Printing, education, presentations, and map-based projects
Related Maps
- Autauga County Alabama Land Cover Map
- Baldwin County Alabama Land Cover Map
- Barbour County Alabama Land Cover Map
Sources and reference links
- MRLC Annual NLCD Data – official access to Annual NLCD land-cover data and related products.
- USGS Annual NLCD Land Cover Classification – official descriptions of the land-cover classes used in the maps.
- U.S. Census Bureau TIGER/Line Shapefiles – federal geographic files used for county boundary reference.
- Alabama Cooperative Extension System – Coosa County – county-specific information for the Rockford office and local agriculture, forestry, and natural-resource services.
- Outdoor Alabama – Lake Mitchell – Alabama Department of Conservation and Natural Resources information about Mitchell Lake on the Coosa River.
- Alabama Department of Revenue – County Appraisal and Assessment Records – state guidance for Coosa County property and assessment resources, which are separate from land-cover classification.
Green Map creates custom-edited map images using open geographic data sources such as geoBoundaries, Natural Earth, OpenStreetMap, and government open data.
These maps are edited visual materials, not raw data files, and are provided for education, documents, presentations, and graphic reference.