Conecuh County’s 2025 land-cover pattern is led by forest, but the map is far from a single-color landscape. Forest accounts for 54.24% of the county, wetlands 14.58%, agriculture 9.68%, grassland 8.42%, shrubland 7.46%, developed cover 5.12%, and open water 0.25%. The dominant green is repeatedly interrupted by teal wetland networks, yellow agricultural patches, open grass and shrub cover, and a compact developed concentration near the middle of the county.
The four maps on this page separate those features into different questions. One shows the complete 2025 land-cover classification, another reduces the view to forest and farmland, a third maps fractional impervious surface and developed land, and the fourth compares mapped classes in 1985 and 2025. WebP previews are provided for quick reading, while the download contains the four original JPG maps for documents, classroom handouts, slides, or county-to-county comparison.
Table of Contents
Evergreen is the clearest hard-surface cluster in an otherwise lightly impervious county
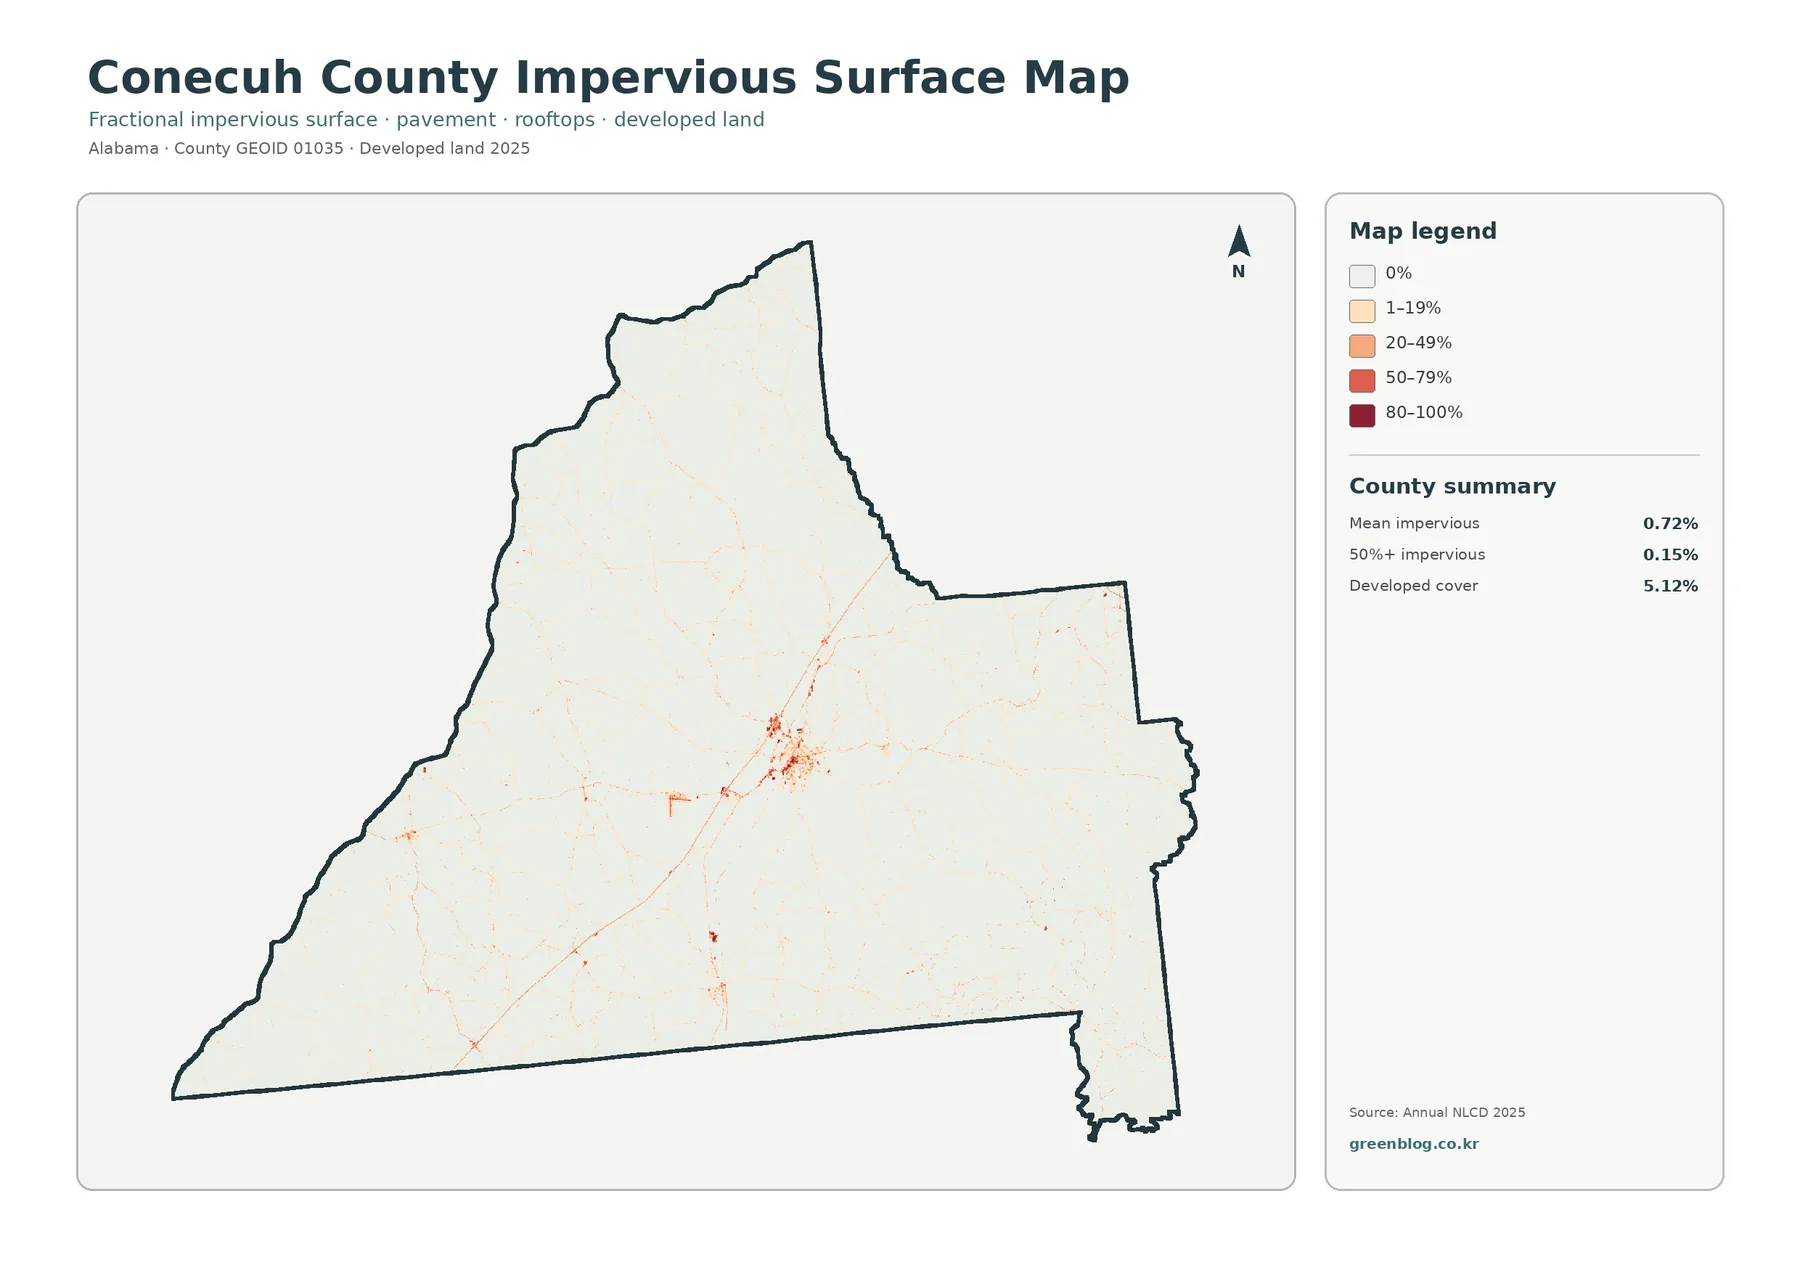
The impervious-surface map provides the simplest way to locate the county’s main built-up concentration. Most of Conecuh County is nearly white on this view, which means hard surfaces occupy little or none of a typical 30-meter cell. A much stronger orange-red cluster appears near the center, with thin linear traces extending outward and smaller concentrations farther south and southwest. Alabama’s court system and the Alabama Cooperative Extension System both place county offices in Evergreen, so the central cluster is geographically consistent with that community.
The countywide mean impervious value is only 0.72%, and just 0.15% of the county is summarized in cells with at least 50% impervious surface. Developed land, however, covers 5.12% of the 2025 land-cover map. These values measure different things. A developed cell can include rooftops and pavement together with lawns, trees, exposed soil, and other surfaces that still absorb water, while the impervious layer estimates the fraction occupied by harder surfaces more directly.
The thin orange and red lines are useful for seeing how built surfaces connect the larger clusters, but they should not be named as specific roads from this map alone. Road labels are not included. The safe observation is that development is concentrated along a limited network rather than spread continuously across the county. That pattern is especially clear when the impervious map is compared with the full land-cover view, where a developed class can cover a wider area than the highest impervious values.
This view can support runoff lessons or help identify places where more detailed drainage information might be worth checking. It is not a flood-hazard map. Flooding depends on rainfall, topography, soils, streams, wetlands, culverts, ditches, and other infrastructure. The 0.72% county mean tells the reader that hard surfaces are limited overall, but it does not describe drainage performance or risk at an individual address.
Forest dominates the county, while wetlands form a widespread second layer
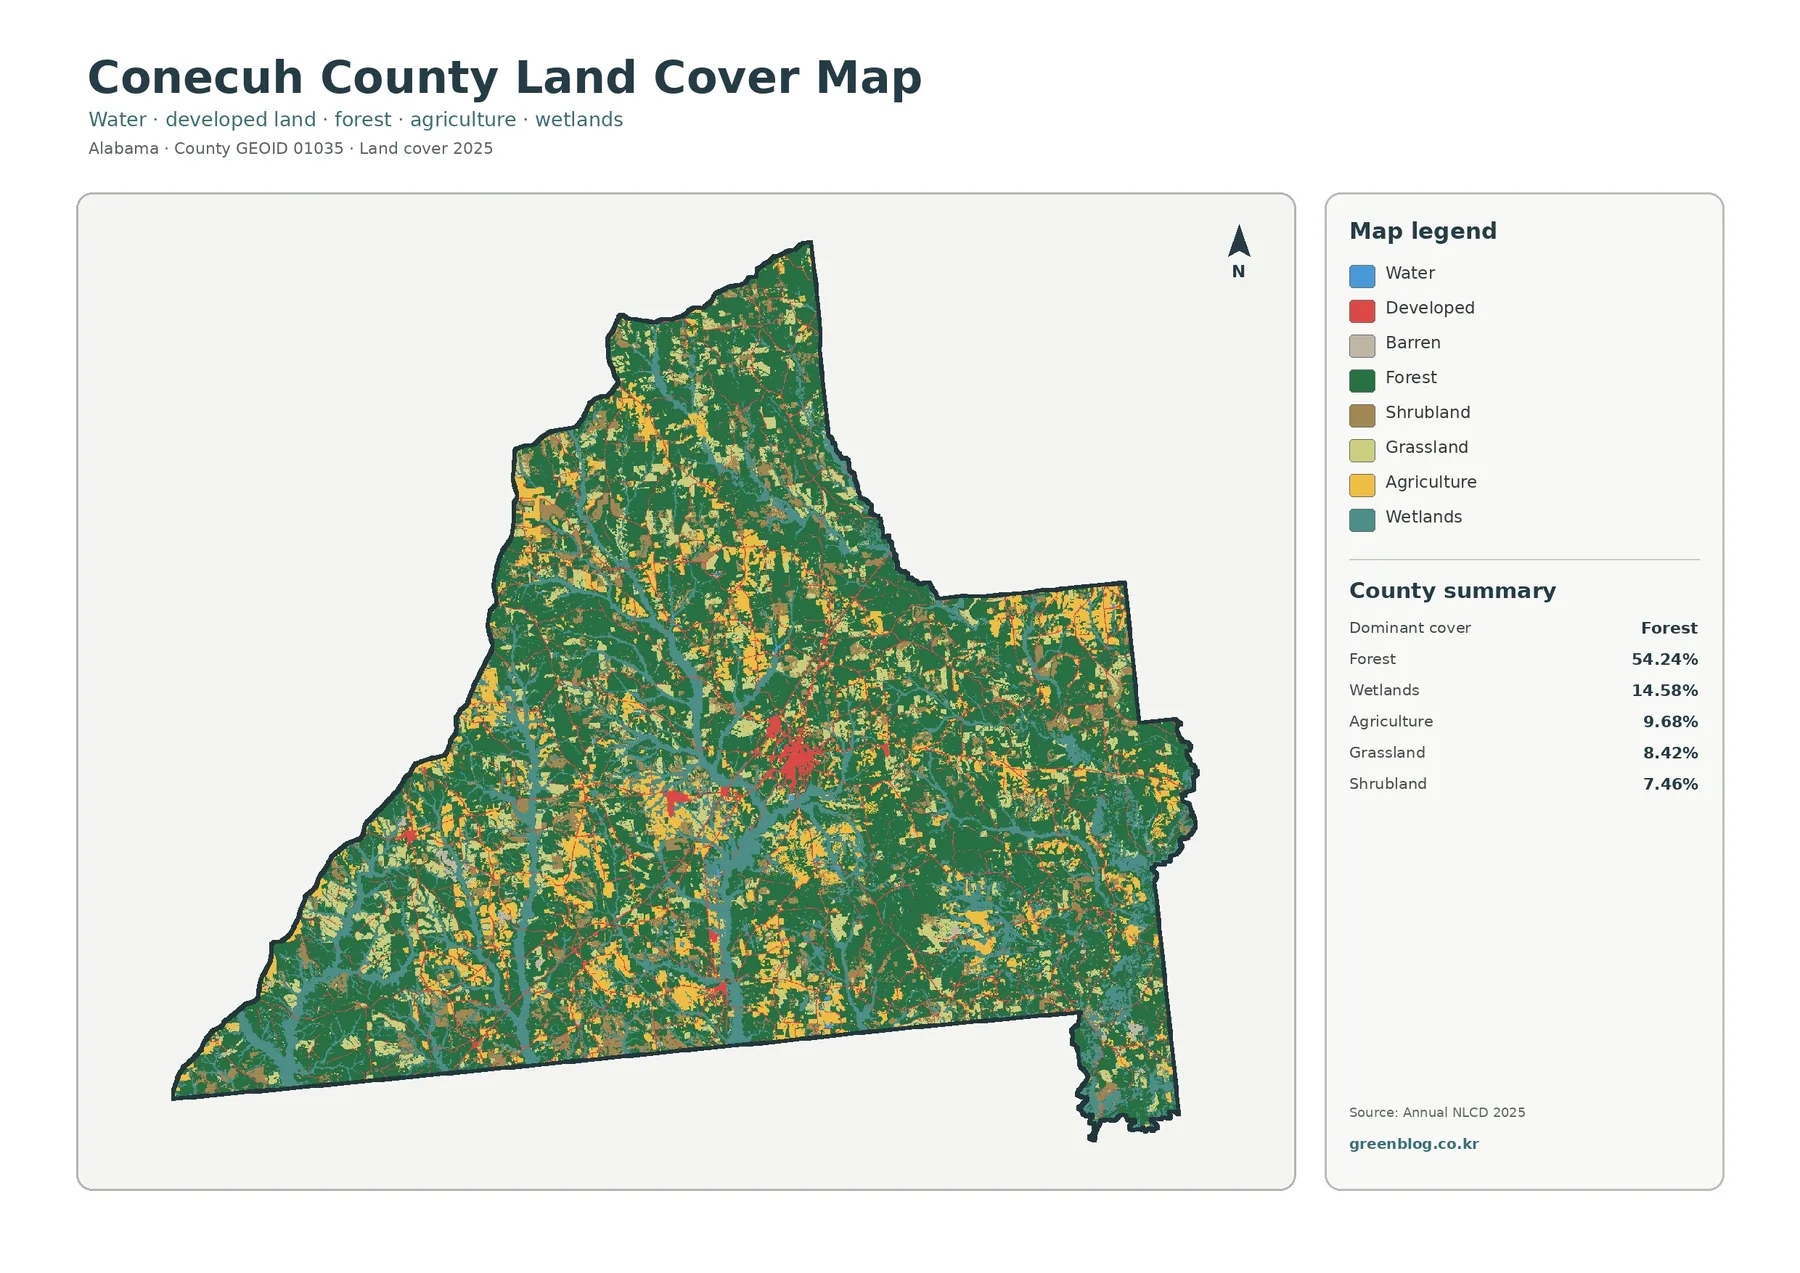
The complete 2025 map shows why a single percentage cannot fully describe Conecuh County. Forest is the largest class at 54.24% and appears across nearly every part of the county. Dark green forms broad blocks in the north, west, east, and south, yet those blocks are interrupted by other classes at short intervals. Agriculture, grassland, shrubland, and wetlands create a patchwork within the forest rather than forming one simple region on one side of the county.
Wetlands account for 14.58%, the second-largest listed class. Their teal pattern is particularly useful because it often forms branching or elongated shapes that pass through forest and open land. Some wetland areas are broad enough to stand out on the countywide view, while others trace narrower drainage-related patterns. The map does not determine legal wetland boundaries, but it does show that wetland cover is a substantial part of the current landscape and should not be treated as a minor leftover category.
Agriculture represents 9.68%, grassland 8.42%, and shrubland 7.46%. These three classes are individually smaller than forest or wetlands, but together they create many of the visible breaks in the green background. Agricultural yellow is frequent in the northwest and central portions and also appears in the east and south. Grass and shrub cover occur as smaller areas around those openings and along transitions between forest, farmland, and developed land.
Developed cover at 5.12% is modest at the county scale but visually obvious where it clusters. The central red concentration provides a useful landmark when comparing the four maps. Open water is only 0.25%, so blue water occupies much less area than teal wetlands. Keeping those two classes separate is important: open water describes visible water surfaces, while wetland cover includes land influenced by water and wetland vegetation.
The forest-and-farmland map makes the patchwork easier to follow
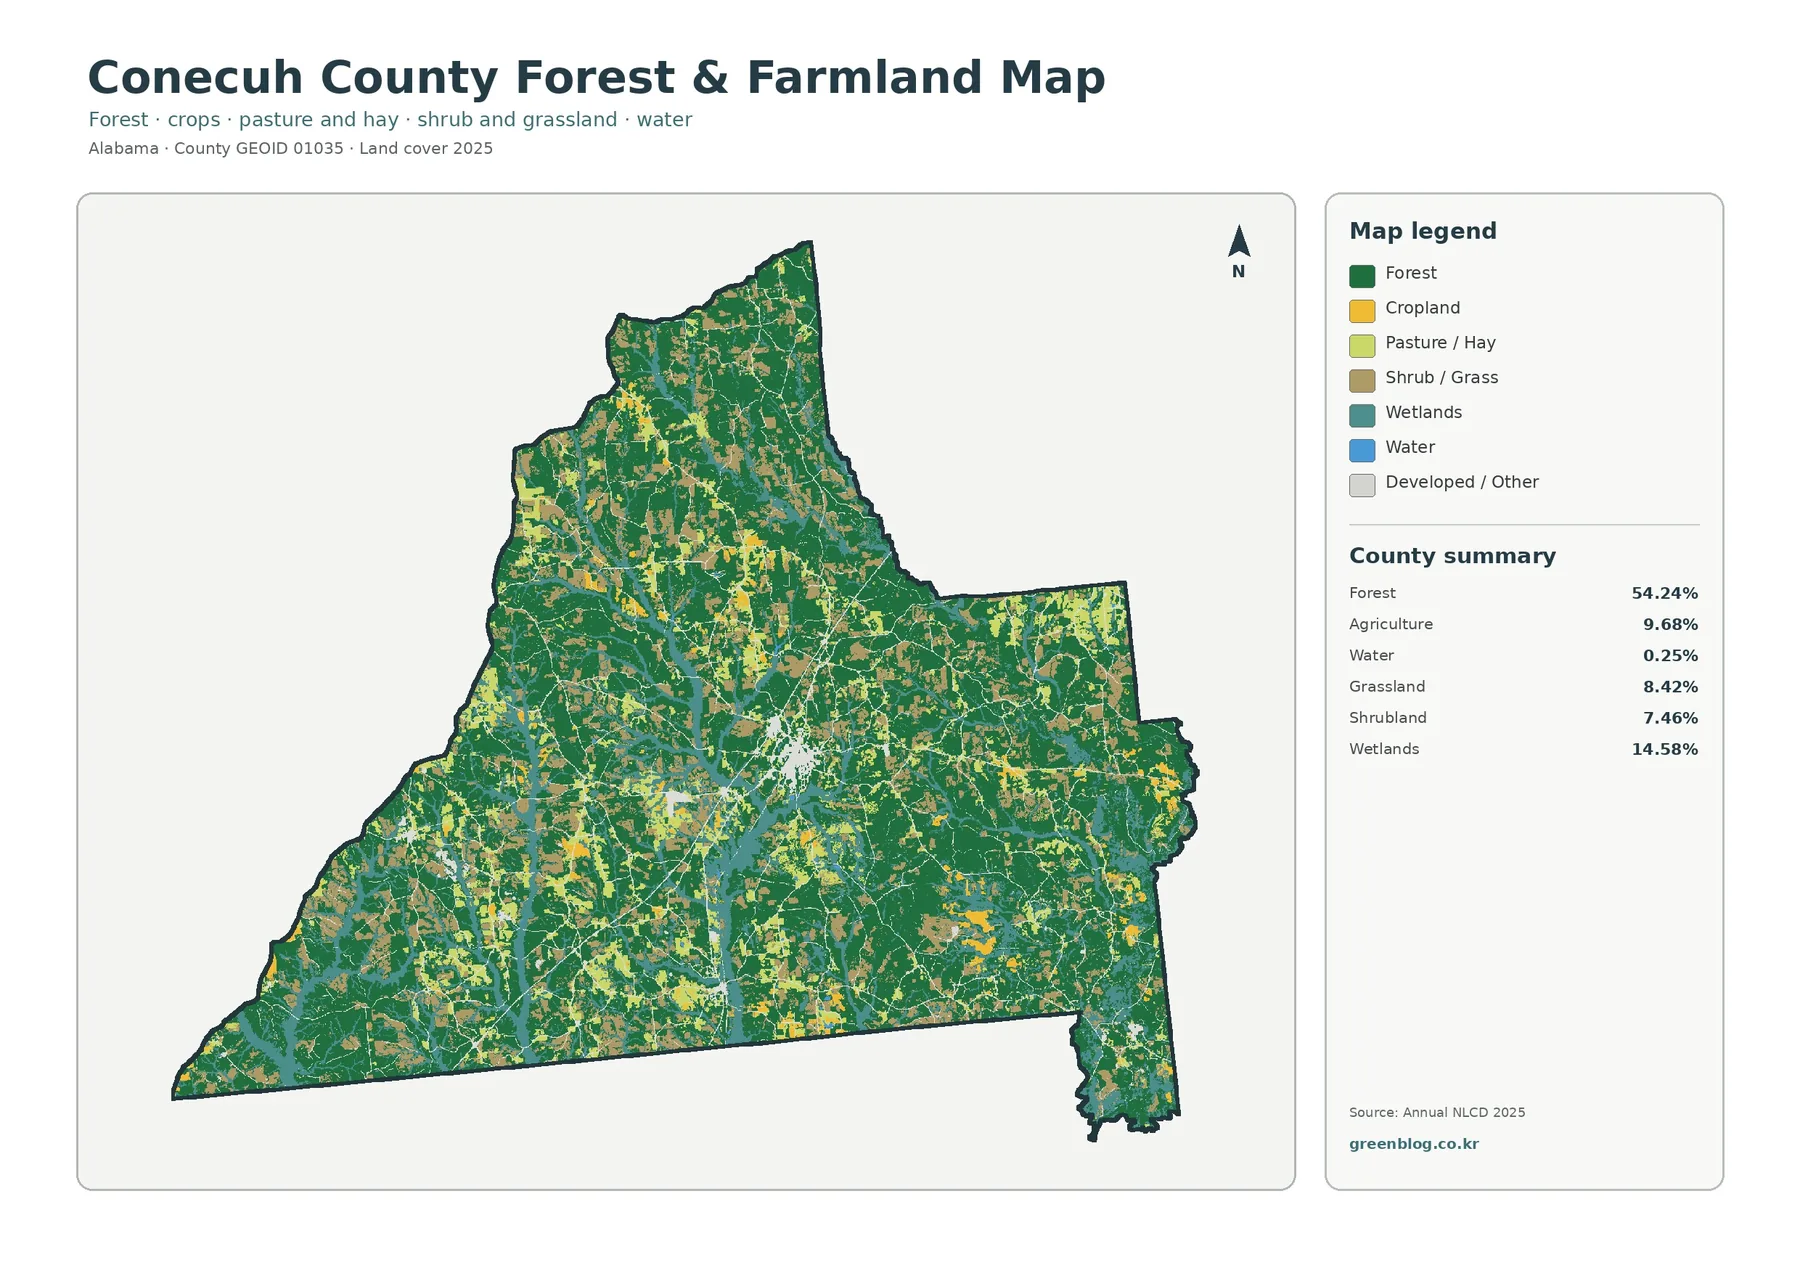
Removing much of the general-map color complexity makes the relationship between woods and open land easier to see. Forest still forms the broadest cover, but cropland and pasture or hay break it into a large number of irregular blocks. The agricultural pattern is not confined to one corner. Yellow fields and lighter pasture areas appear in the northwest, around the central part of the county, toward the eastern side, and in southern areas, with forest continuing between them.
The simplified summary retains forest at 54.24%, agriculture at 9.68%, grassland at 8.42%, shrubland at 7.46%, wetlands at 14.58%, and water at 0.25%. Those figures help establish scale, but the map adds information that a list cannot. A class can have a moderate countywide share and still touch many locations if it is widely scattered. Agriculture in Conecuh County is a good example because the yellow areas repeatedly meet forest instead of occupying one uninterrupted agricultural plain.
Wetlands remain visible in the simplified map because they help explain many of the transitions between forest and open land. Teal features cross or border both green forest and yellow agricultural cover. For watershed education, this makes it possible to discuss how several surface types occur within the same drainage landscape without assuming that a wetland boundary on a land-cover map is the same as a regulatory delineation.
Land cover also should not be confused with legal land use or ownership. An agricultural cell indicates a surface classified as cropland, pasture, hay, or a related cover in the dataset; it does not establish zoning, tax status, ownership, or a parcel’s permitted use. A forest cell similarly says that trees dominate the mapped surface, not whether the land is public, private, protected, or available for timber harvest. Parcel or planning questions require a different source.
The 1985–2025 comparison records many class differences, not one type of change
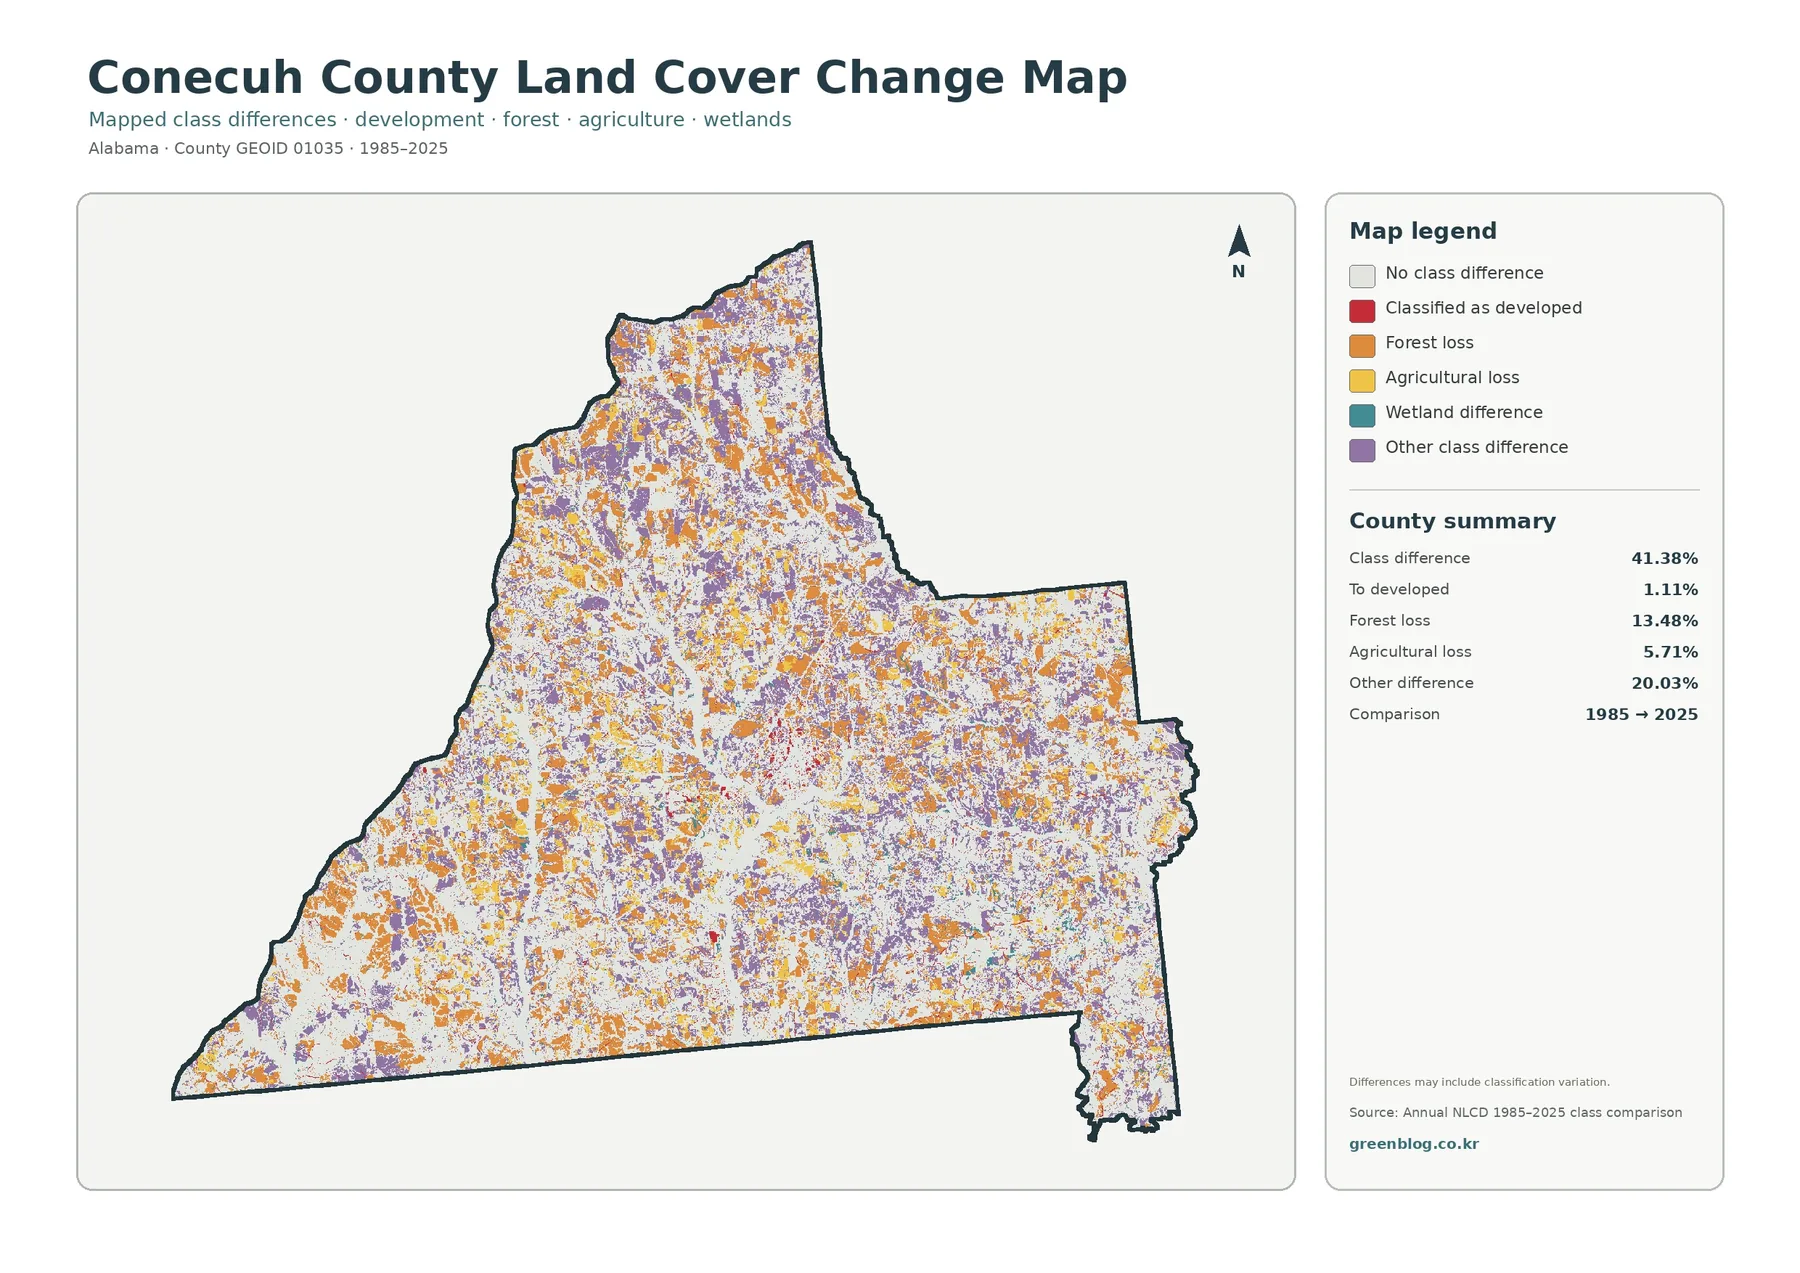
The class-comparison map reports that 41.38% of Conecuh County has a different mapped class at the 1985 and 2025 endpoints. That figure is a combined comparison statistic. The summary separately lists 1.11% as classified to developed, 13.48% as forest loss, 5.71% as agricultural loss, and 20.03% as other class difference. Wetland difference is also shown as its own legend category, although the map’s summary does not provide a separate percentage for it.
Orange forest-loss cells and purple other-difference cells are spread across much of the county, while agricultural-loss cells appear in numerous smaller patches. Red cells associated with classification to developed are visible around the central built-up area and a few other locations, but they do not dominate the comparison. The map therefore does not support a claim that 41.38% of the county urbanized. Only a small part of the total is specifically summarized as classified to developed.
Forest loss at 13.48% should also be interpreted carefully. It means that cells mapped as forest in 1985 were assigned another class at the 2025 endpoint. The map does not identify whether the reason was permanent development, timber harvest, agricultural conversion, later regrowth, a shift between forest and shrub or grass classes, or classification variation. A cell may also have changed more than once during the forty-year interval, something that a two-endpoint map cannot show.
The note on the map warns that differences may include classification variation. This matters most along boundaries and in mixed 30-meter cells where several real-world surfaces occur together. The class-difference view is useful for finding areas that deserve a closer time-series review, but Annual NLCD data for intervening years, historical aerial photographs, or field records are better choices when the timing or cause of a change matters.
A practical sequence for reading all four maps
Start with the full land-cover map and locate three broad features: the dominant forest cover, the wetland networks, and the central developed concentration. Then move to the impervious map and find that same central cluster. The comparison shows that a developed land-cover area can be larger than the area with strongly impervious cells. This is a useful way to explain the difference between a broad developed class and the hard-surface fraction measured within it.
Next, use the forest-and-farmland map to remove most of the visual competition from developed classes. The repeated boundary between green forest and yellow or light-green agricultural cover becomes easier to follow. Wetlands remain visible, so the reader can see where they pass through the same forest-farm mosaic. Returning to the complete map afterward makes it easier to add the developed and other classes back into the picture.
Save the class-difference map for last. It asks a historical comparison question rather than a current-cover question. A forested cell in 2025 may or may not have been forest in 1985, and a difference shown between the endpoints does not identify exactly when the transition happened. Treating the current map and the change map as separate layers of information prevents a present-day pattern from being mistaken for a long-term trend.
For county-to-county comparison, keep the year and metric consistent. Conecuh County’s 54.24% forest figure is best compared with another county’s 2025 forest share. Its 0.72% mean impervious value should be matched to the same impervious metric and year. The 41.38% class-difference figure is most meaningful beside a map using the same 1985 and 2025 endpoints. Otherwise differences in data definitions can be mistaken for geographic differences.
Download the four original JPG maps
The downloadable ZIP contains four JPG files: the 2025 general land-cover map, the forest-and-farmland map, the impervious/developed-land map, and the 1985–2025 class-comparison map. Each original JPG is 2480×1754 pixels. The WebP previews embedded in the page are 1800×1273 pixels, so the JPG files provide a larger source for presentations, handouts, reports, and side-by-side map layouts.
The asset manifest does not mark the JPG files as meeting an A3 high-resolution reference. They may still work well for ordinary documents and moderate-size printing, but a large poster should be test-printed before final production so the legend and small labels can be checked. Enlarging the image dimensions does not create additional land-cover detail beyond the source data.
Keep the map year and statistic visible when you reuse the images. Forest 54.24% and wetlands 14.58% belong to the 2025 current-cover summary; 0.72% is the countywide mean impervious surface; and 41.38% is the 1985–2025 class-difference total. Clear labeling prevents a reader from confusing a present-day cover percentage with a historical comparison measure.
What the 30-meter raster can and cannot show
Annual NLCD represents the landscape as raster cells rather than parcel polygons. At 30-meter spatial resolution, a single cell may contain trees, grass, a narrow road, a roof, soil, or water at the same time, even though the land-cover product assigns a representative class. Small streams, buildings, field edges, and narrow wetlands can therefore be generalized or blended with surrounding cover. Zooming in makes the cell larger on screen but does not reveal details that were not resolved by the source product.
Mixed cells matter along the many forest-farm-wetland edges visible in Conecuh County. A narrow wet area may be represented partly as wetland and partly as nearby vegetation, while a small rural structure may not form a distinct developed cell. The maps are appropriate for countywide pattern recognition, environmental education, broad watershed context, and initial comparison. They are not substitutes for a property survey, a parcel map, a regulatory wetland delineation, or a site-specific engineering study.
The observation year is another limit. The current maps describe the 2025 classification, so construction, timber activity, regrowth, or farming changes that occurred later are not included. The change map compares only the 1985 and 2025 endpoints. If a cell changed from forest to grass and later returned to forest, a simple endpoint comparison may show no difference even though an important intermediate change occurred.
Used with those limits in mind, the four-map set gives a clear overview of Conecuh County. It identifies the broad forest cover, extensive wetland presence, scattered agricultural openings, localized hard-surface clusters around the central community, and the places where endpoint classifications differ. Those observations can then guide a more detailed search in aerial imagery, stream data, elevation models, parcel records, or field information when a project needs greater precision.
Frequently Asked Questions
What is the largest 2025 land-cover class in Conecuh County?
Forest is the largest class at 54.24%. Wetlands follow at 14.58%, agriculture at 9.68%, grassland at 8.42%, shrubland at 7.46%, developed cover at 5.12%, and open water at 0.25%. The map also shows that the county is not uniformly wooded because wetlands and open-cover classes repeatedly interrupt the forest.
Why is developed cover 5.12% when mean impervious surface is only 0.72%?
Developed land-cover cells can contain a mixture of roofs, pavement, lawns, trees, and soil. The impervious product measures the harder, water-shedding fraction more directly. As a result, a place can be classified as developed without being mostly pavement or rooftops. In Conecuh County, only 0.15% of the county is summarized in cells with at least 50% impervious surface.
Does the 41.38% class difference mean that 41.38% of the county became developed after 1985?
No. The 41.38% figure combines several types of mapped difference between the 1985 and 2025 endpoints. Only 1.11% is listed as classified to developed. The summary also includes 13.48% forest loss, 5.71% agricultural loss, and 20.03% other class difference, while wetland difference is represented separately in the legend.
What files are included in the download?
The ZIP includes four original JPG maps: 2025 land cover, forest and farmland, impervious/developed land, and the 1985–2025 class comparison. Each JPG is 2480×1754 pixels. The article uses smaller WebP previews for faster viewing, and the asset manifest does not mark the JPGs as meeting an A3 high-resolution reference.
Map File Information
Conecuh County Land Cover Maps 2025 land cover, forest & farmland, impervious/developed land, and 1985–2025 class-difference maps in four original JPG files
- Included Files: Use only the versions confirmed in the article and supplied images
- File Type: Use the confirmed download contents
- Intended Use: Printing, education, presentations, and map-based projects
Related Maps
- Autauga County Alabama Land Cover Map
- Baldwin County Alabama Land Cover Map
- Barbour County Alabama Land Cover Map
Sources and references
- MRLC Annual NLCD Data – Official access to Annual NLCD land-cover and related products.
- USGS Annual NLCD Land Cover Classification – Official explanation of the land-cover classes used by Annual NLCD.
- U.S. Census Bureau TIGER/Line Shapefiles – Federal county-boundary and geographic reference data.
- Alabama Cooperative Extension System – Conecuh County – County-specific agriculture, forestry, natural-resource, and outreach information, with the office located in Evergreen.
- Conecuh County Circuit Clerk – Alabama Judicial System page for the Conecuh County Government Center in Evergreen.
Green Map creates custom-edited map images using open geographic data sources such as geoBoundaries, Natural Earth, OpenStreetMap, and government open data.
These maps are edited visual materials, not raw data files, and are provided for education, documents, presentations, and graphic reference.