Gallatin County, Illinois, is mostly agricultural on the 2025 land-cover map, but the county is not a uniform sheet of fields. Agriculture accounts for 69.08% of the mapped area, while forest covers 15.41% and wetlands another 8.19%. Developed land is 5.70% and water is 1.56%. The strongest contrast appears between the broad farm blocks in the north and center, the larger forests in the south, and the wetland-rich eastern edge.
This page includes four views of the same county: current land cover, forest and farmland, impervious surface and developed land, and the 1985–2025 class comparison. The four original JPG maps are available together in one ZIP download. Using the maps side by side makes it easier to separate present surface cover from hard-surface intensity and from places where the two comparison years received different classifications.
Table of Contents
The eastern edge is where wetlands make the strongest break from the farm landscape
Wetlands cover 8.19% of Gallatin County, a larger share than developed land or open water. They are not spread evenly. Teal areas gather along the winding eastern boundary and in several broad patches toward the northeast, with additional wetland pieces extending inland. That concentration gives the eastern side a very different appearance from the large agricultural blocks farther west.
Water covers only 1.56% of the county, yet blue areas are often close to the wetland patches. The map is useful for seeing that proximity, but it should not be treated as a flood map or a legal wetland inventory. Land-cover classification describes the surface detected by the dataset. It does not establish jurisdictional wetland boundaries, drainage rules, parcel ownership, or flood-hazard status.
Agriculture covers more than two-thirds of the county, with forest becoming much stronger toward the south
Yellow agricultural cover dominates the current map at 69.08%. Large field blocks are especially continuous across the north and much of the center, and agriculture remains common in the west and southeast. The pattern changes in the southern part of the county, where forest becomes broader and more connected. Smaller wooded and wetland pieces also interrupt farm areas in the west and northwest.
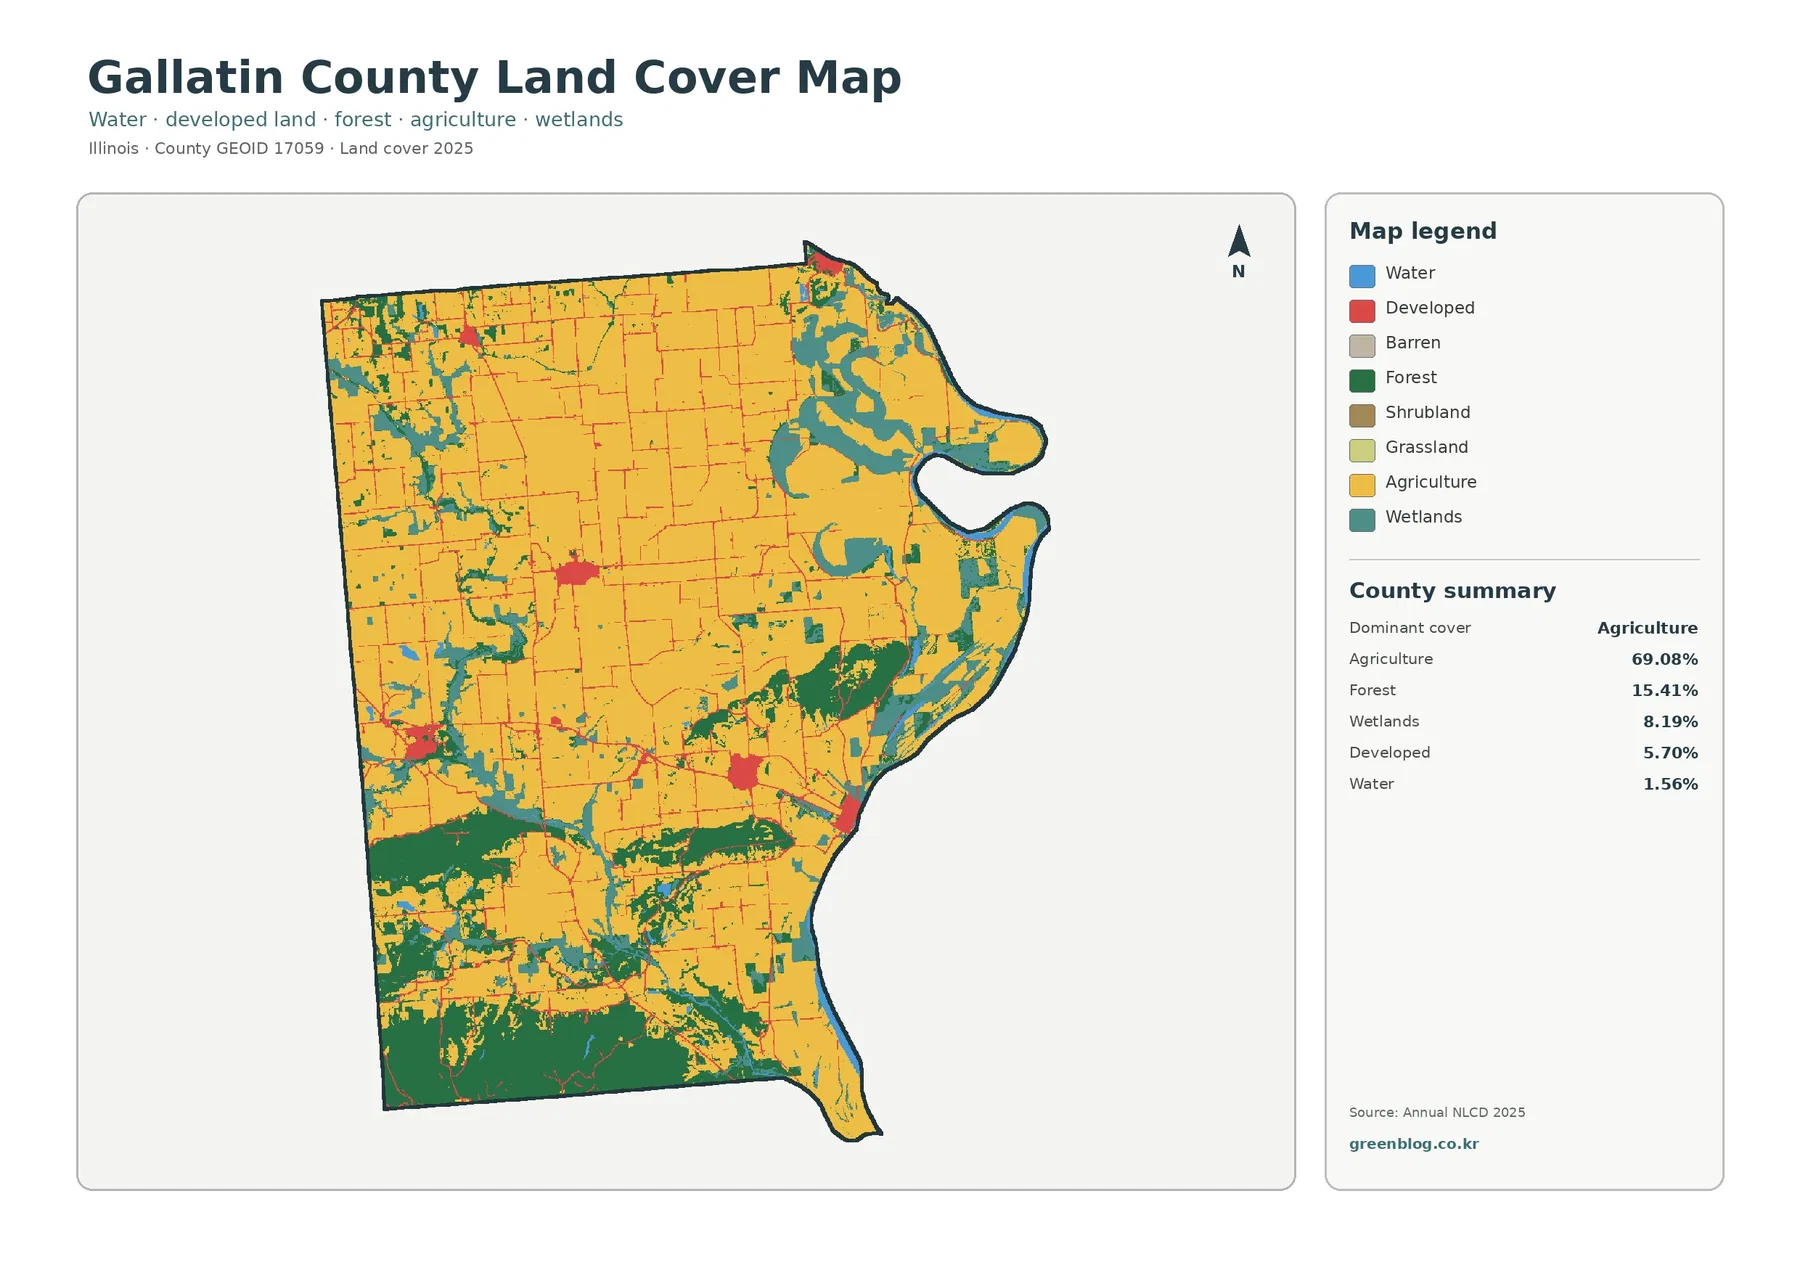
Developed land is a much smaller class at 5.70%. A few red clusters stand out in the west-central and south-central parts of the county, while thinner red lines follow roads and smaller settlement patterns. The bright color can make these places look larger than their countywide share, so the summary percentage is important when judging how much developed land is actually present.
The forest-and-farmland view shows why the southern half cannot be described by agriculture alone
The simplified forest-and-farmland map removes much of the visual competition from other developed classes. That makes the transition from broad crop areas to larger wooded blocks easier to see. The north and center remain strongly agricultural, while the south and southwest contain some of the county’s most continuous forest. Forest also appears in narrower pieces through the central and western farm landscape.
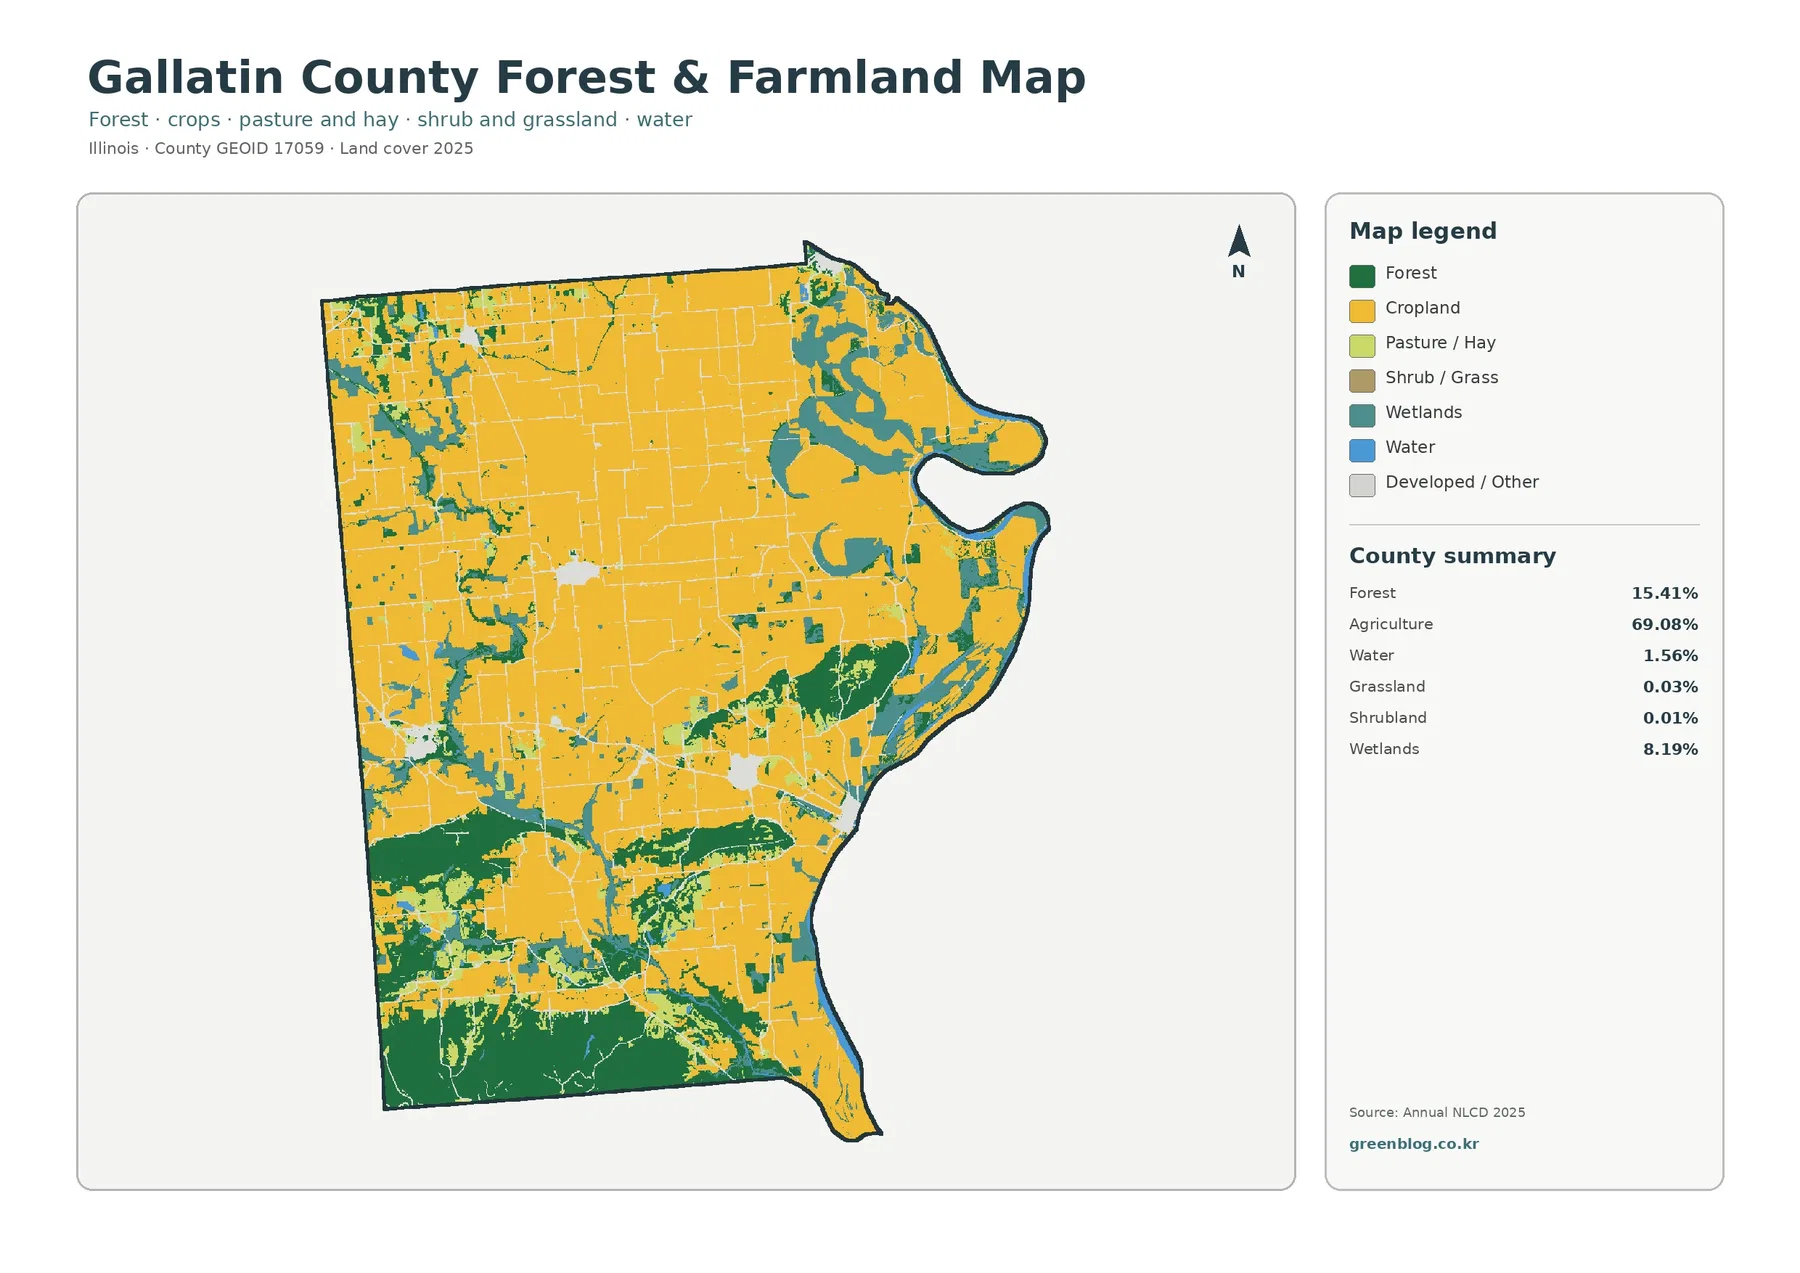
Grassland and shrubland are very small in the map summary, at 0.03% and 0.01%. They should not be given the same narrative weight as agriculture, forest, or wetlands. For this county, the more informative question is how a very large agricultural share is arranged around southern forest and eastern wetland cover. The spatial pattern adds information that the percentages alone cannot provide.
Hard surfaces are sparse countywide and concentrated around a few compact centers
The impervious-surface map has a much lighter appearance than the general land-cover map. Most of the county has little pavement or rooftop cover, while a few compact clusters and many thin road lines appear in orange and red. The largest concentrations are limited in area, including a noticeable west-central cluster and another south-central center. The road network creates finer linear marks between them.
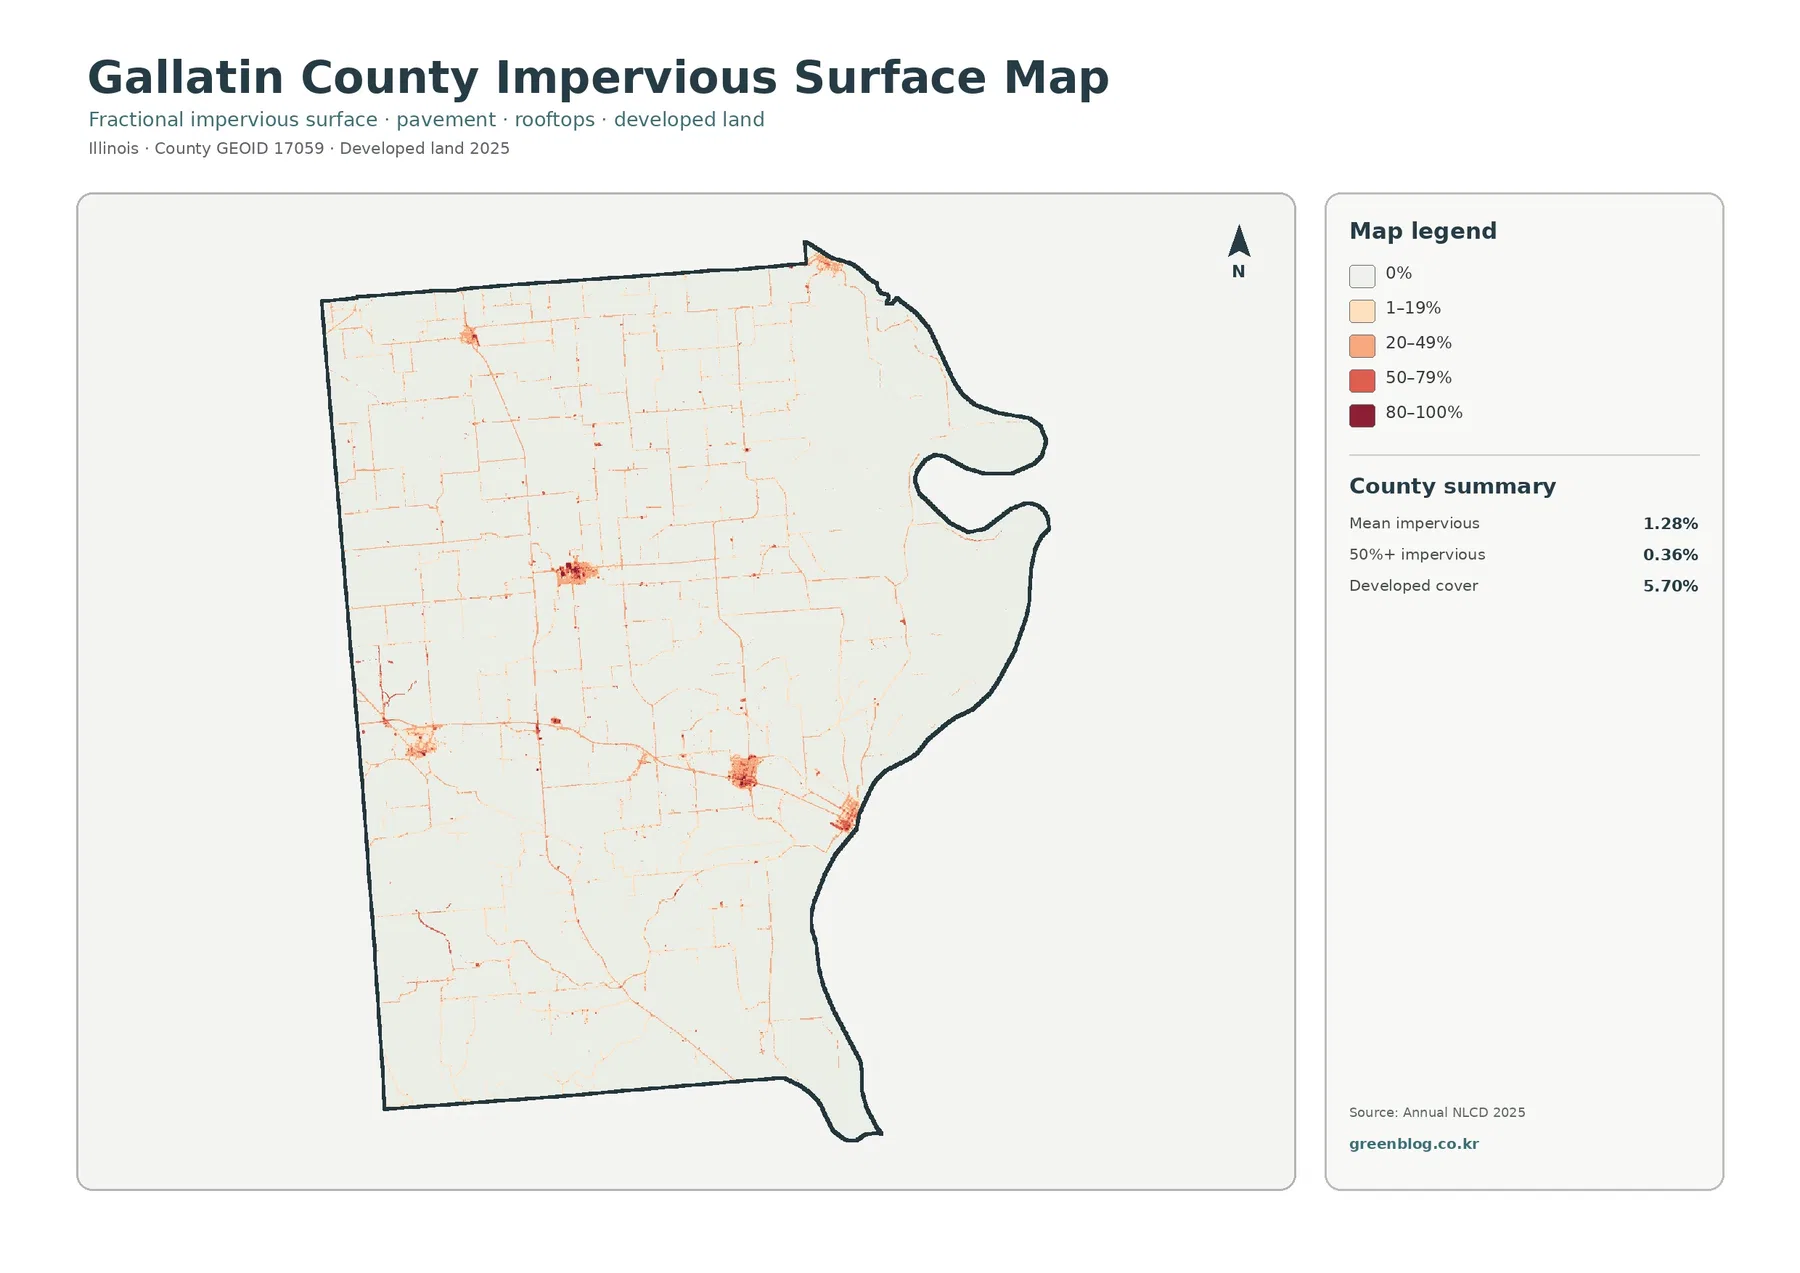
Mean impervious cover is 1.28%, and only 0.36% of the county is mapped above 50% impervious. Those values are lower than the 5.70% developed-land share because the measures are not interchangeable. A developed land-cover cell can still contain lawns, trees, soil, or other surfaces that absorb water. Impervious cover focuses on hard surfaces such as pavement, parking areas, and rooftops.
The 1985–2025 comparison is mostly a scattered pattern of class differences rather than one large change zone
The change map marks cells whose 1985 and 2025 classifications differ. Gallatin County has a total class difference of 6.04%. The summary identifies 0.74% classified as developed in the comparison, 0.83% forest loss, 0.90% agricultural loss, and 3.21% other class difference. Wetland-difference areas are also mapped, but the map does not provide a separate exact percentage for that category.
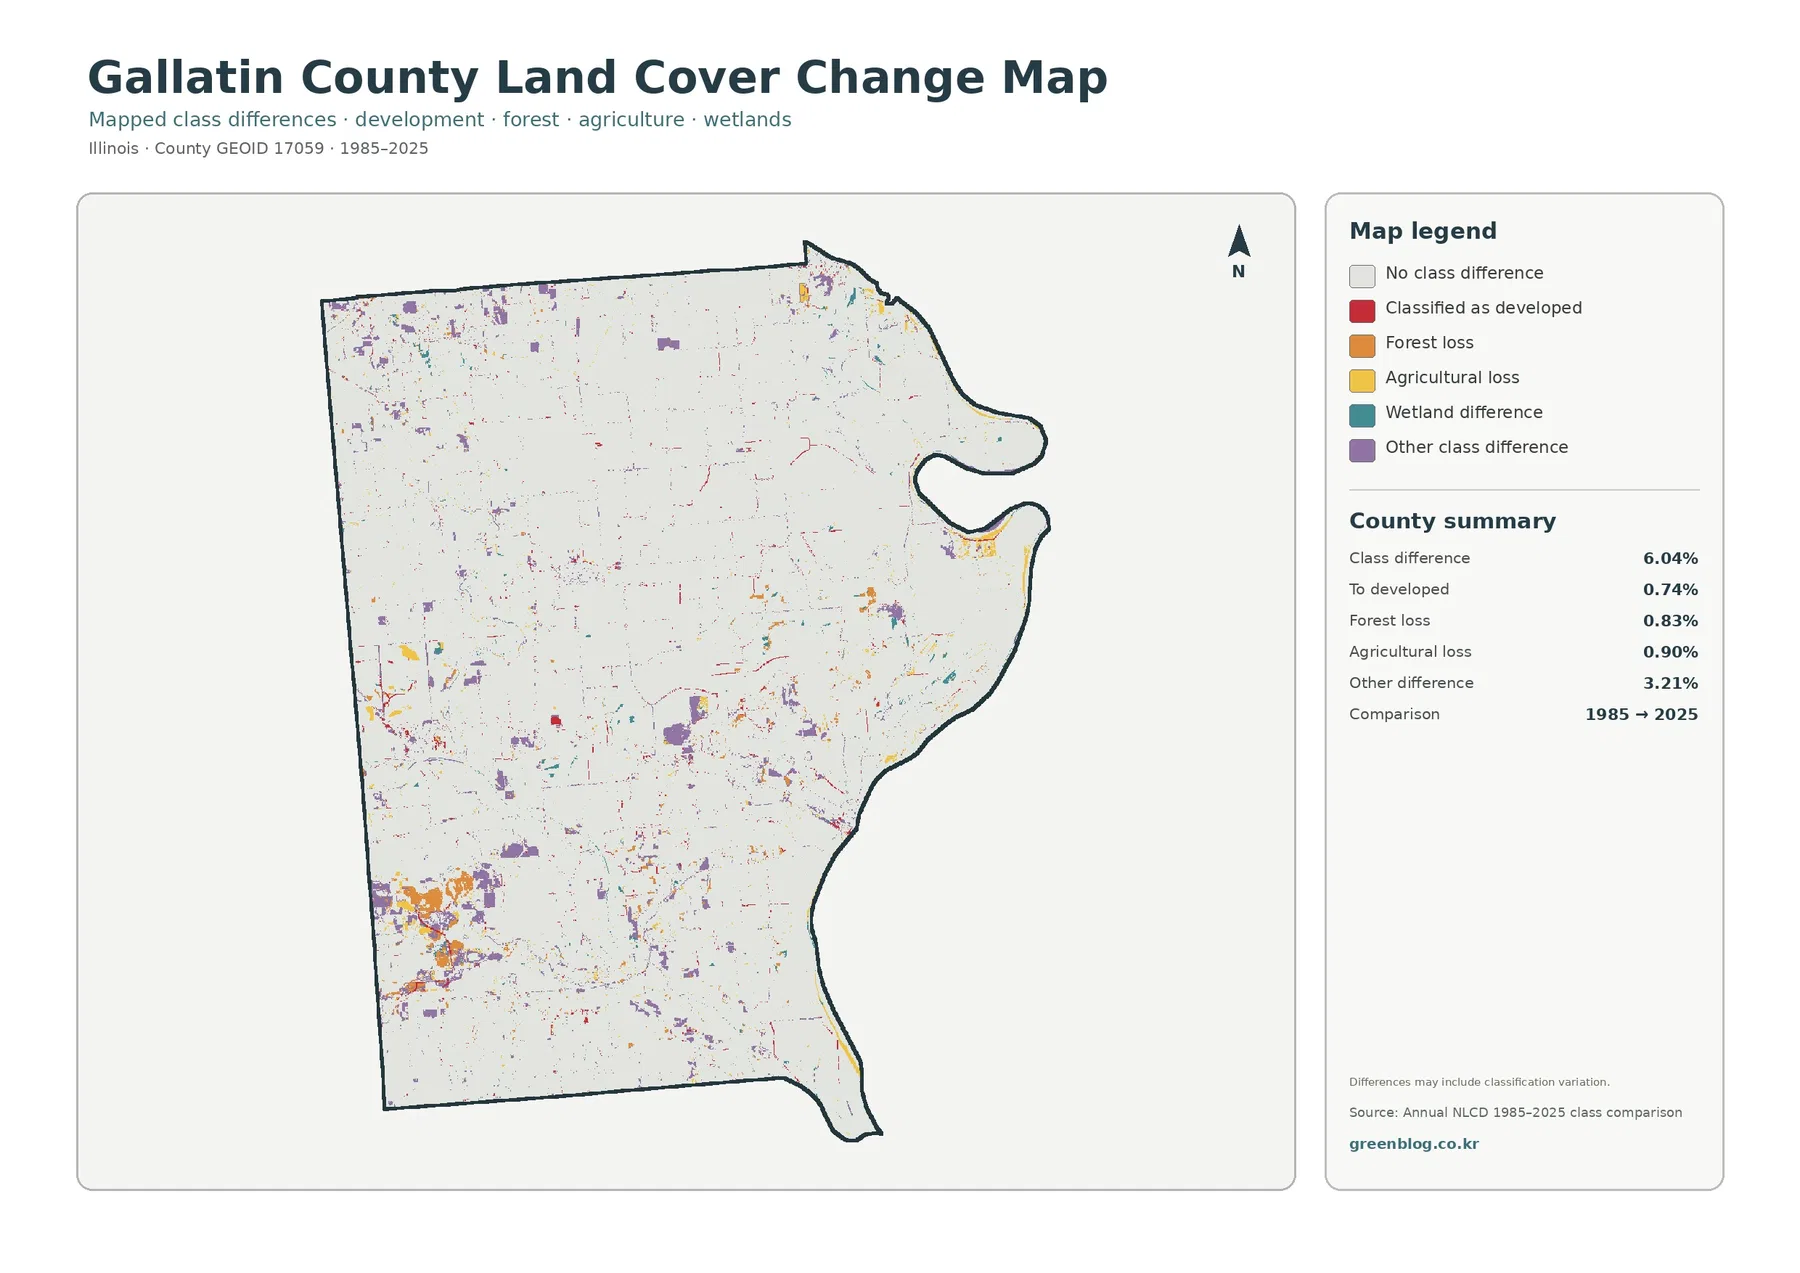
Colored change cells are scattered across much of the county instead of forming a single continuous band. The southwest contains a noticeable mix of forest-loss and other-difference colors, and smaller change patches also appear near the wetland-rich eastern side. Red cells associated with the developed category are easier to find around existing settlement centers and along some road corridors, though they occupy a small share overall.
Each map answers a different practical question, so using one view for every task can be misleading
For a quick description of Gallatin County’s present surface, the general land-cover map is the best starting point because it shows agriculture, forest, wetlands, water, and developed land together. The forest-and-farmland view is clearer when the question is how wooded cover interrupts or borders agricultural blocks. The impervious map is the better choice for paved and built surfaces, while the change map belongs in a time-comparison workflow.
The maps are county-scale classifications, not parcel surveys or zoning documents
Annual NLCD commonly represents the landscape with 30-meter raster cells. A raster cell is a small grid unit used to classify the surface, and one cell can contain more than one real-world feature. A narrow road beside a field, a small pond next to wetland vegetation, or a thin wooded edge can therefore be simplified into a dominant class or a generalized impervious percentage.
Used within those limits, the four-map set is a practical way to understand the county before moving to more detailed sources. It quickly identifies the broad farm landscape, the larger southern forest blocks, the eastern concentration of wetlands and water, and the few places where hard surfaces are denser. Those observations can guide later work with aerial imagery, agricultural statistics, hydrology data, planning records, or field checks.
Frequently Asked Questions
What is the largest land-cover class in Gallatin County?
Agriculture is the largest 2025 class at 69.08%. Forest covers 15.41%, wetlands 8.19%, developed land 5.70%, and water 1.56%. The county is farm-dominated overall, but southern forest and eastern wetlands create strong regional contrasts.
Why is developed land 5.70% while mean impervious cover is only 1.28%?
Developed land can include lawns, trees, soil, and other surfaces that still absorb water. Impervious cover measures harder surfaces such as pavement, parking areas, and rooftops, so it is a different measure from the developed land-cover class.
Does the 6.04% class difference mean that 6.04% of the county definitely changed land use?
No. It is the share where the 1985 and 2025 classifications differ. The total includes 0.74% to developed, 0.83% forest loss, 0.90% agricultural loss, and 3.21% other difference, with classification effects also possible.
Map File Information
The ZIP contains the four original JPG maps for Gallatin County: current land cover, forest and farmland, impervious/developed land, and the 1985–2025 land-cover comparison.
- File Type: one ZIP containing four JPG files
- Intended Use: classes, presentations, farm-and-forest comparison, wetland context, hard-surface review, and change screening
Related Maps
- Adams County Illinois Land Cover Map
- Alexander County Illinois Land Cover Map
- Bond County Illinois Land Cover Map
Sources and references
- MRLC Annual NLCD Data – official access to Annual NLCD land-cover and impervious-surface datasets.
- USGS Annual NLCD Land Cover Classification – official explanation of the land-cover classes and classification approach.
- U.S. Census Bureau TIGER/Line Shapefiles – official geographic boundary source for U.S. counties, including Gallatin County.
- Gallatin County Illinois – About Gallatin County – official county background page with local agricultural context.
- USDA 2022 Census of Agriculture – Gallatin County Profile – county-level agricultural statistics used only as context, not as a substitute for NLCD land cover.
Green Map creates custom-edited map images using open geographic data sources such as geoBoundaries, Natural Earth, OpenStreetMap, and government open data. These maps are edited visual materials, not raw data files, and are provided for education, documents, presentations, and graphic reference.