Download four high-resolution A3 JPG maps of Taliaferro County in one ZIP directly from this page. The set covers county roads and boundaries, Crawfordville and Sharon, the Little River and Ogeechee River systems, and elevation from about 106 to 217 meters. Crawfordville is the clearest starting point for reading the county because it sits near the center of the road network, while the water and elevation views show how short ridges and narrow creek valleys spread around the county seat.
The four maps do not simply repeat the same county outline. One emphasizes roads, named places, and the county boundary; another narrows the city focus to Crawfordville and Sharon; the terrain-and-water layer identifies named rivers and creeks; and the elevation surface shows an actual mapped range of about 106 to 217 meters. Reading those views together makes the county’s small settlements, irregular boundary, and rolling drainage terrain much easier to place in context.
Table of Contents
Crawfordville anchors the road map, but the county spreads unevenly around it
Crawfordville is the county seat and the clearest reference point on the general county map. Numbered routes marked around it include 22 and 47, with additional route labels such as 278 and 12 southeast of town and 44 farther north. Sharon sits east of Crawfordville, while Carters Grove is labeled in the long northern section and Raytown appears in the eastern part of the county. The map is designed for county-scale orientation rather than turn-by-turn navigation, so its strongest value is showing how the main places and roads fit inside the boundary.
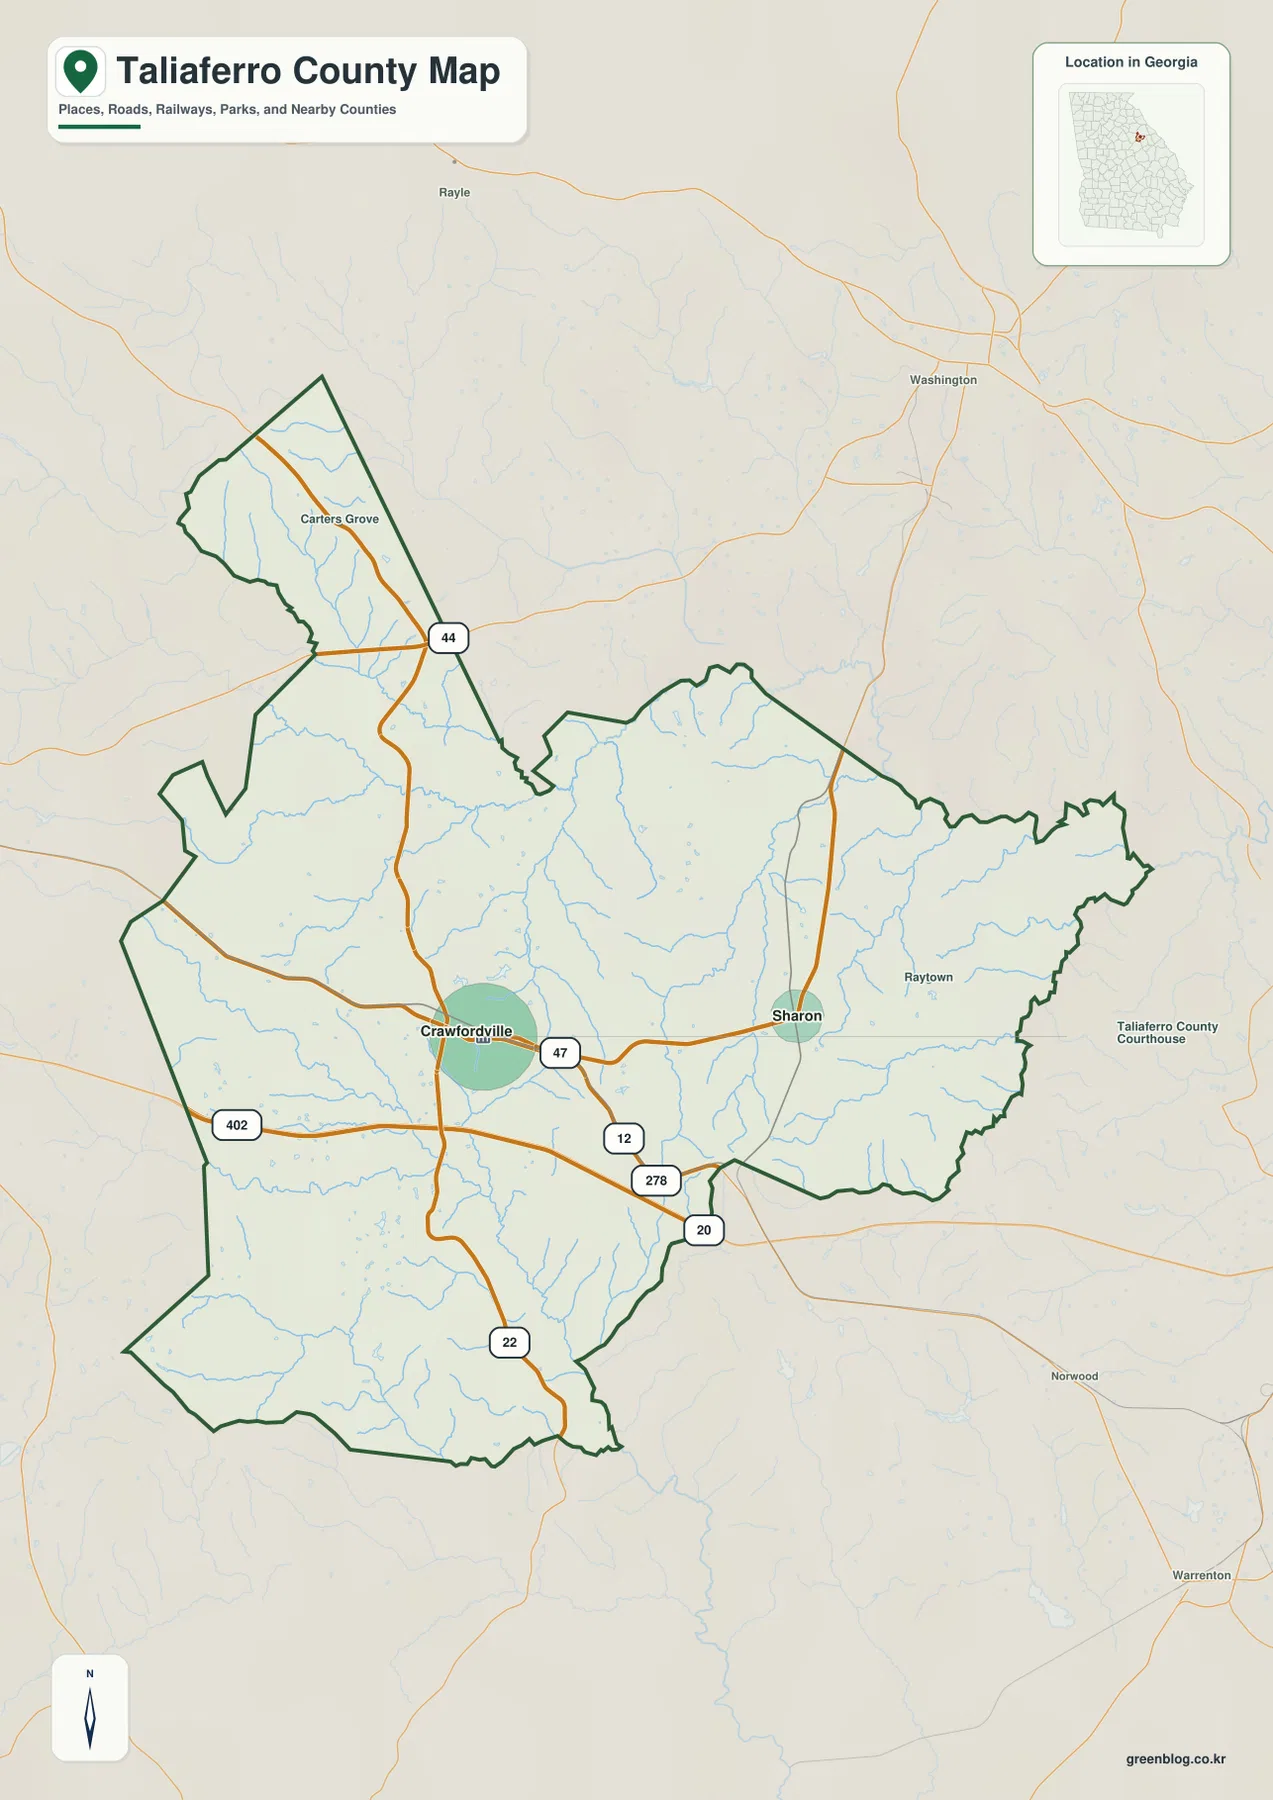
The county shape is unusually useful as an orientation clue. A narrow section projects northward, the eastern edge bends through a series of irregular turns, and the main central-southern body is broader. The city map labels surrounding counties including Wilkes, Oglethorpe, Warren, Hancock, and Greene, while the general map shows outside places such as Washington, Warrenton, and Norwood. Those labels make it easier to see where Taliaferro County sits in relation to neighboring communities without turning the page into a regional road atlas.
Crawfordville and Sharon provide two very different settlement reference points
The city map deliberately simplifies the settlement picture. Its CITY INDEX ranks Crawfordville first with a displayed value of 548 and Sharon second with 56. Those numbers are the values printed on the supplied map and should be treated as map labels rather than a substitute for a current population table. What matters most here is the contrast: Crawfordville is the primary settlement reference, while Sharon provides a second marker farther east.
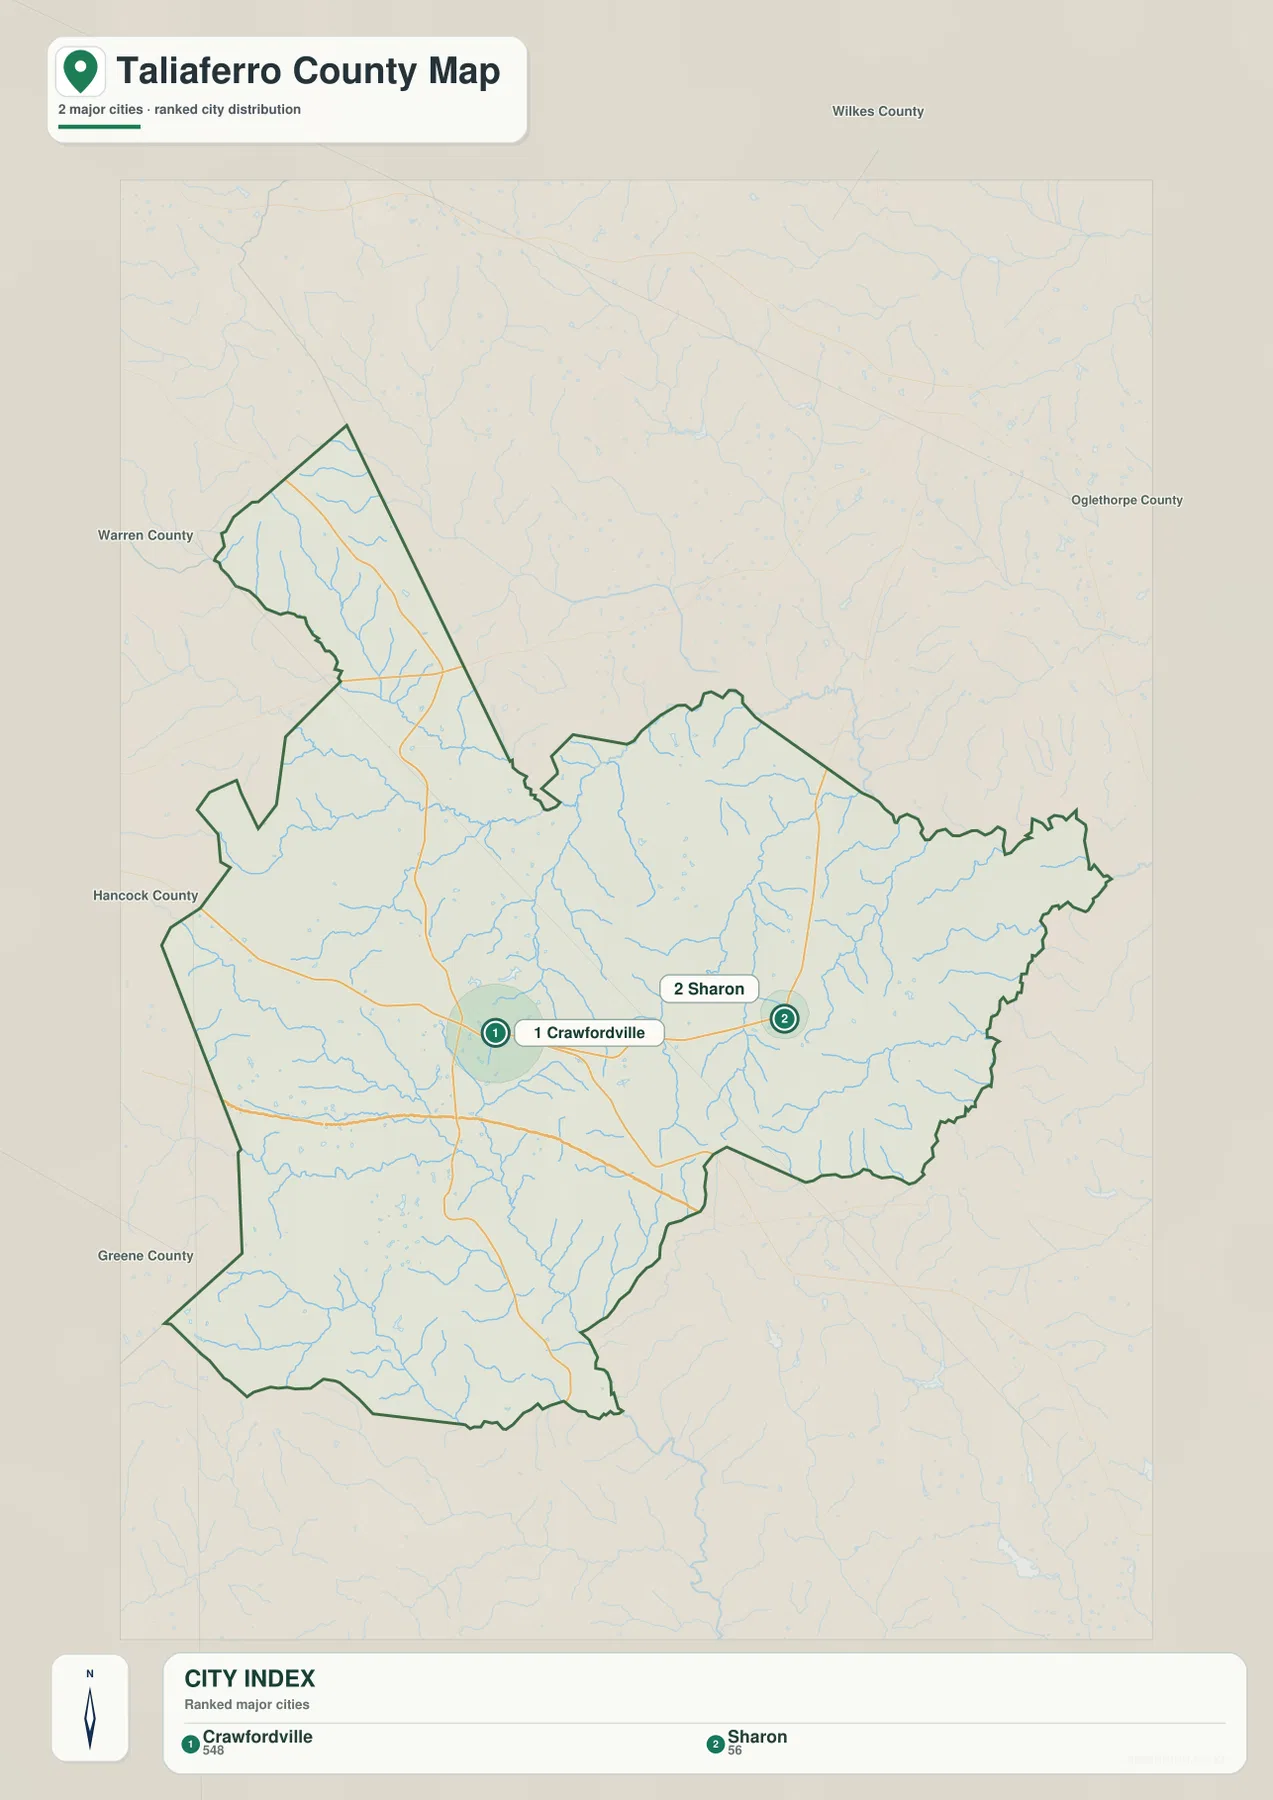
This map should not be read as a complete inventory of every community. The general county map also labels Carters Grove and Raytown, which are not part of the two-city ranking. That difference is useful because it shows why a city-focused layer and a broader reference map serve different purposes. If the goal is to identify the main municipal points quickly, the city map is uncluttered. If the goal is to understand smaller local labels, roads, and the full boundary at the same time, the county map carries more detail.
Crawfordville also makes a practical starting point for reading the other two thematic maps. Once the reader knows where the county seat sits and where Sharon lies to the east, it becomes easier to relate the Little River branches in the north and the Ogeechee drainage in the west and south to familiar place markers. The settlement layer therefore acts as a bridge between the road map and the physical landscape rather than as a stand-alone population graphic.
Little River branches and the Ogeechee system divide the county into many small valleys
The terrain-and-water map reveals a dense drainage network that is easy to miss on the road map. White Creek is labeled in the northern projection. Just below it, North Fork Little River and South Fork Little River form two prominent blue channels across the upper part of the county. Farther west and south, North Fork Ogeechee River and South Fork Ogeechee River are labeled separately before the mapped Ogeechee River continues toward the southern edge.
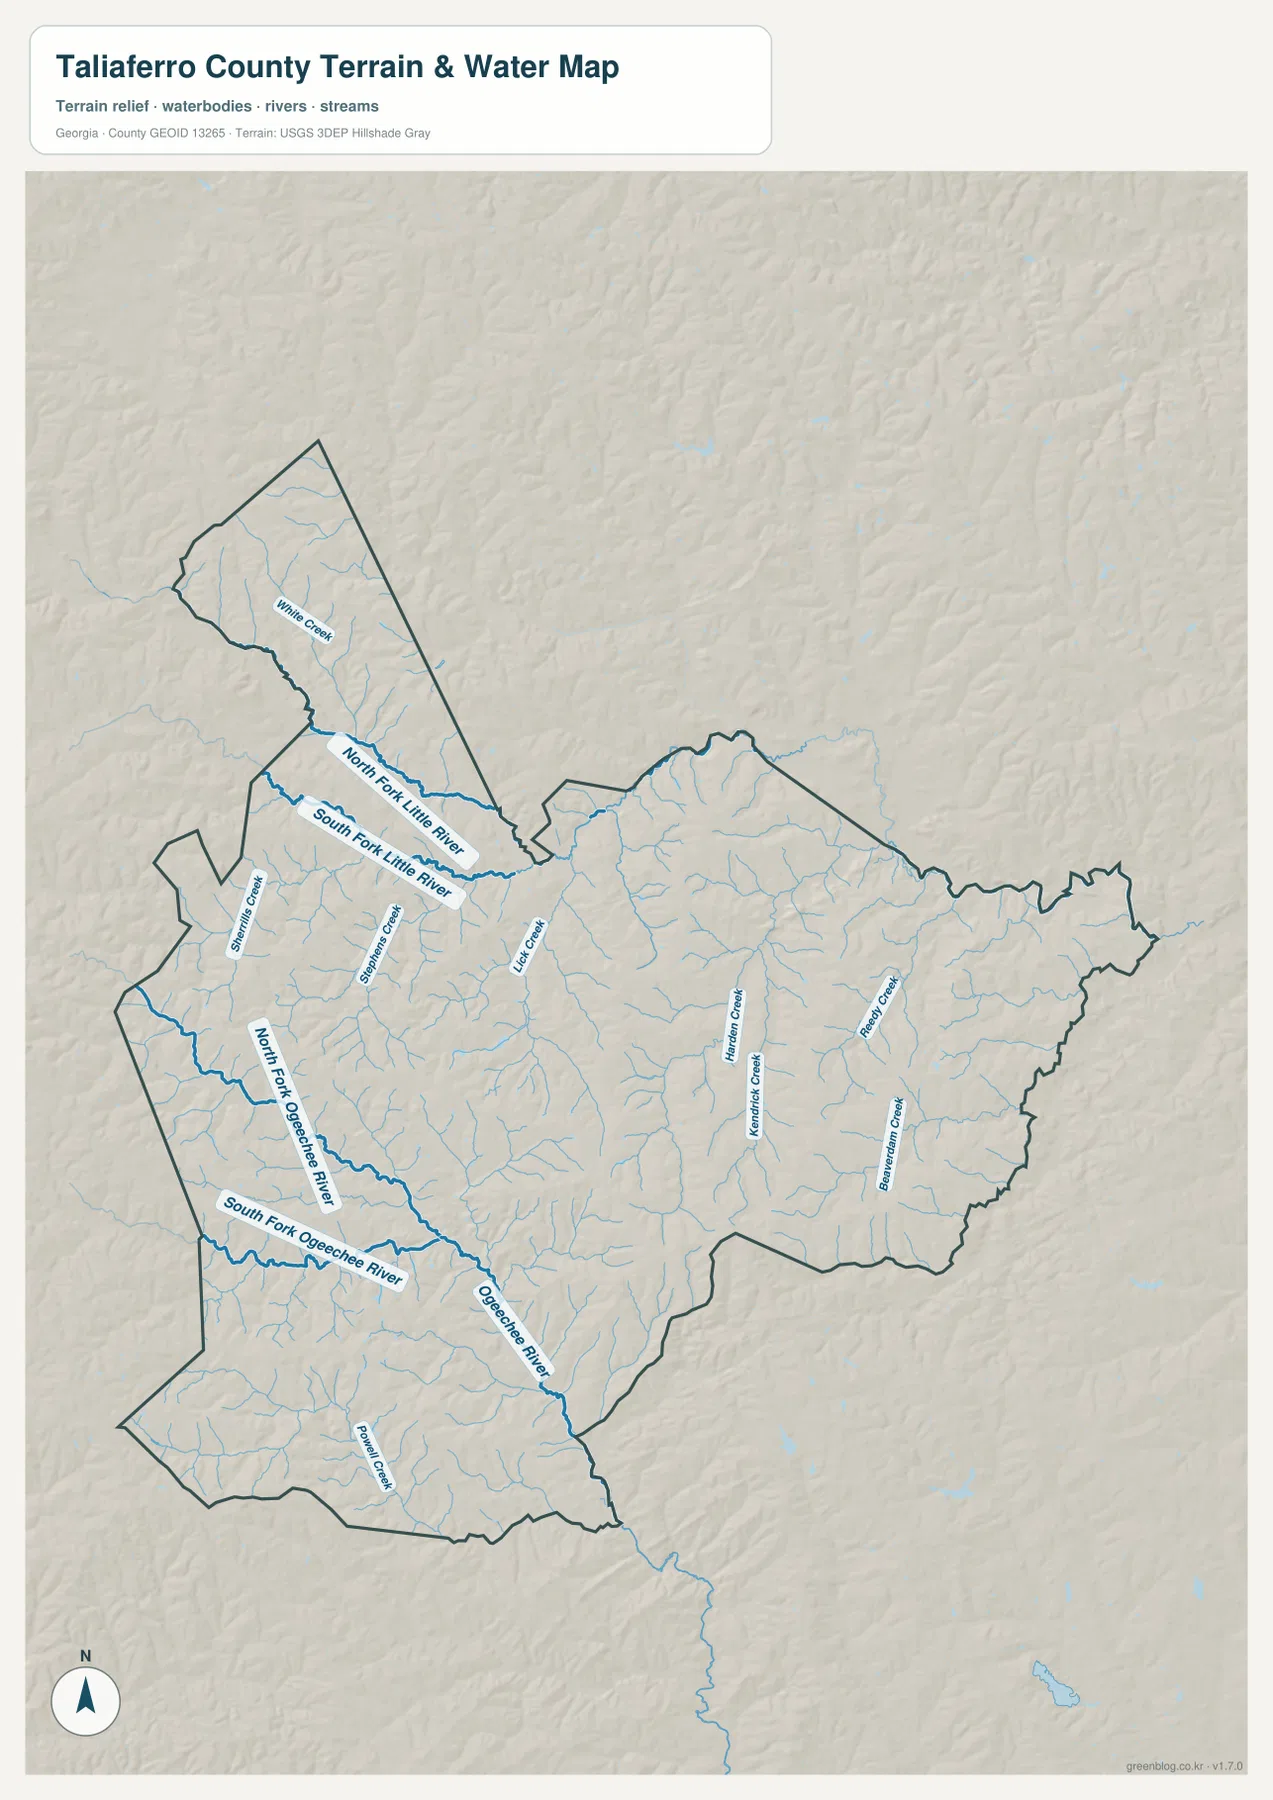
Smaller named streams fill the spaces between those larger channels. Lick Creek, Harden Creek, Kendrick Creek, Reedy Creek, and Beaverdam Creek are labeled through the central and eastern portions, while Stephens Creek appears on the western side. Numerous unnamed tributaries are also visible. The result is not one dominant river valley running straight through the middle of the county; instead, many short drainage lines carve the terrain into separate ridges and low corridors.
The water map is a location reference, not a flood-risk or legal-boundary product. It does not show regulatory flood zones, property ownership, public access, or navigability. For those questions, specialized official records are required. At county scale, however, it is well suited to comparing where the Little River branches and Ogeechee system lie relative to Crawfordville, Sharon, the county boundary, and the surrounding relief.
Elevation ranges from about 106 to 217 meters across short ridges and creek bottoms
The elevation map lists an actual mapped range of roughly 106 to 217 meters and a mean near 163 meters. Higher brown and tan terrain is especially noticeable across the western and southwestern sections, with another elevated area in the long northern projection. Green lower corridors thread between those ridges and become easy to recognize once the water map has been viewed first.
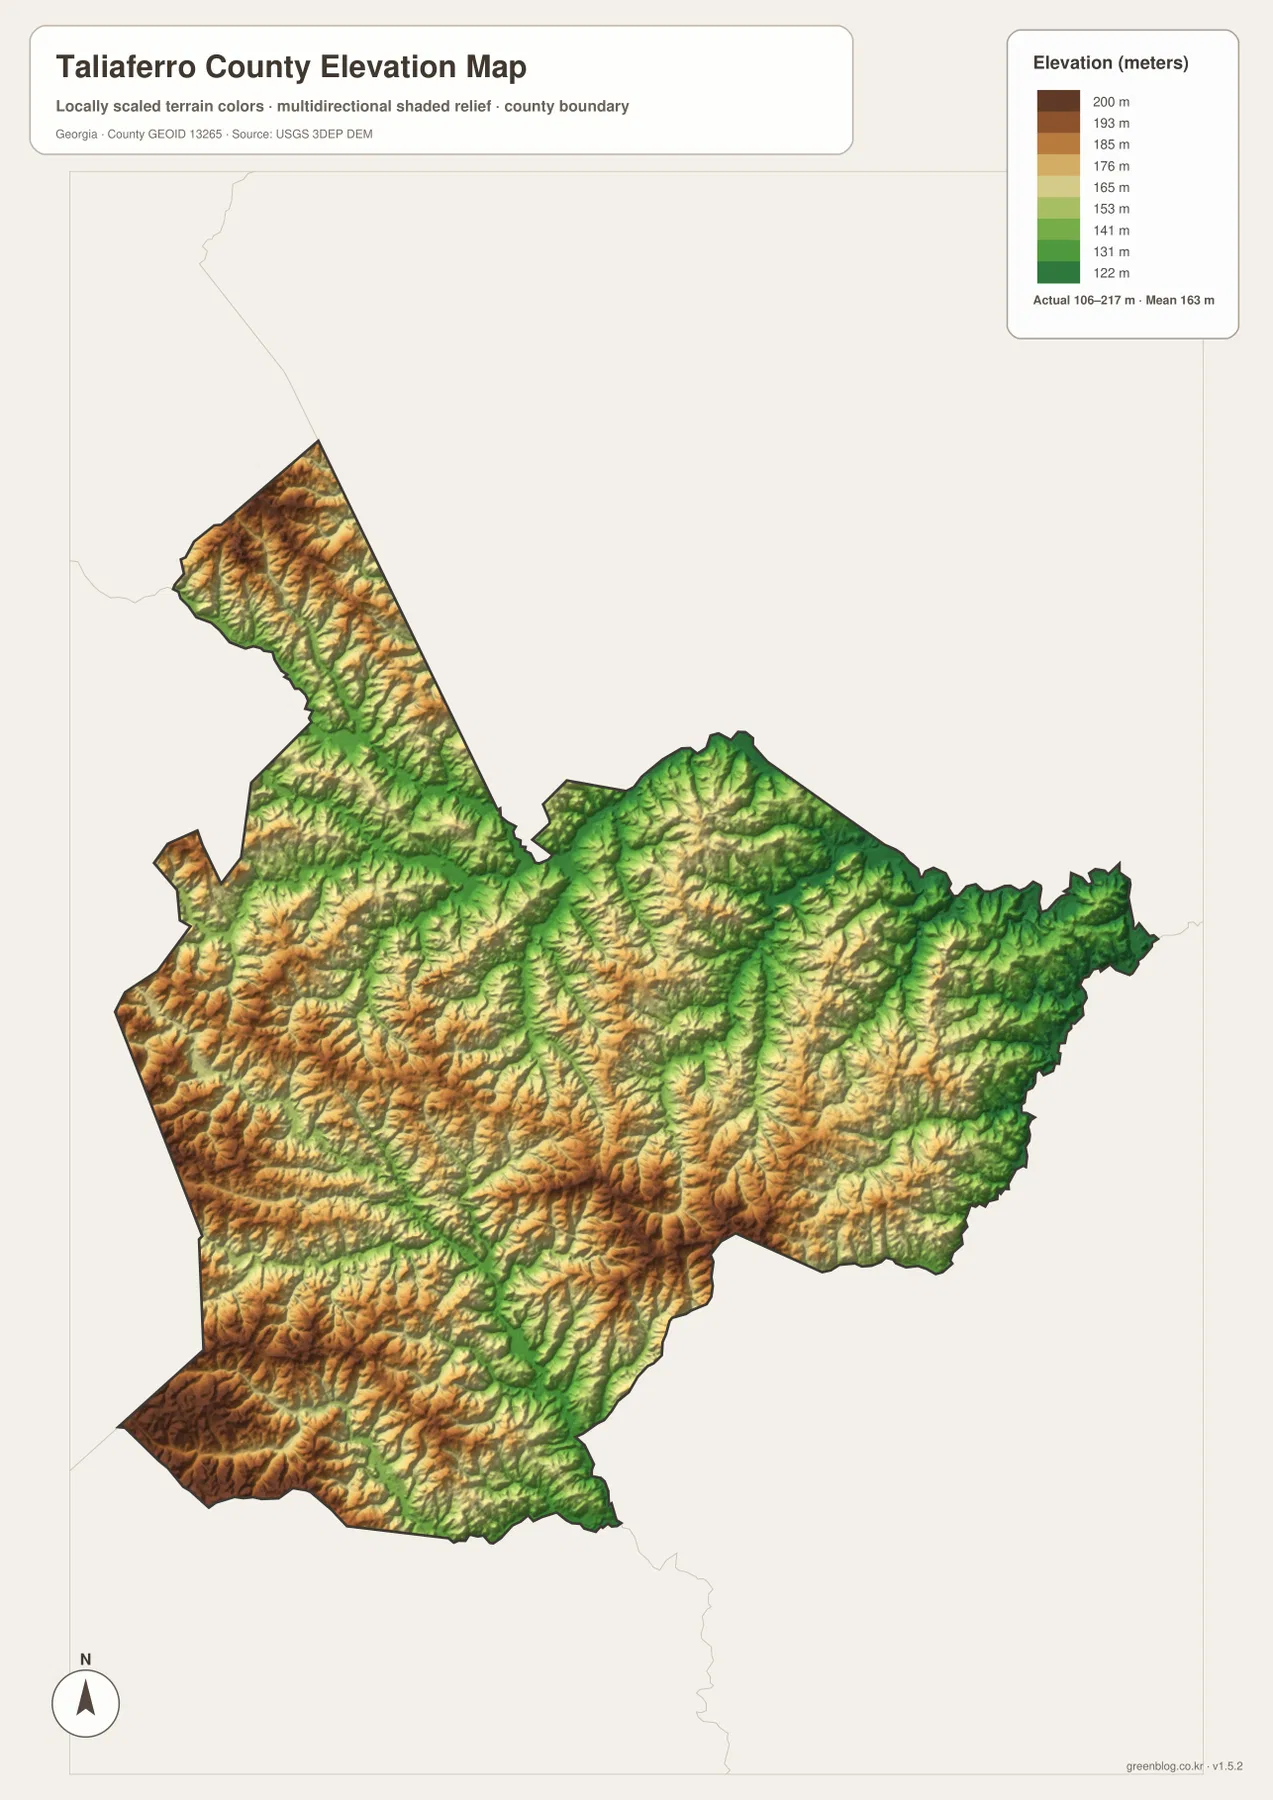
The terrain does not divide neatly into one high side and one low side. Even in the western high ground, narrow green valleys cut into the ridges, and the eastern half contains a mix of low drainage lines and higher interfluves between them. That repeated ridge-and-valley pattern is a better description of the map than a simple west-to-east slope. The relief also explains why the water layer contains so many branching tributaries: each small valley provides a route for runoff toward a larger creek or river.
The 106–217 meter range is intended for county-wide comparison. It should not be used as a survey elevation for a parcel, building site, road project, or engineering decision. The web preview is useful for seeing the broad color pattern, while the full-size A3 JPG makes the narrow valleys and short ridges easier to inspect at a larger scale.
How the four files answer different questions about Taliaferro County
For a quick location check, the county map is the most direct place to start. It combines Crawfordville, Sharon, several local labels, the county boundary, and major numbered roads. The city map removes much of that detail and makes the Crawfordville–Sharon settlement relationship easier to see. The water map then shifts attention away from roads and toward North Fork Little River, South Fork Little River, the Ogeechee system, and the smaller creeks that occupy the valleys.
The elevation map adds the vertical dimension. Its 106–217 meter range shows that the county is not a flat surface even though the absolute elevations are moderate. Comparing the elevation colors with the water layer shows why many of the blue channels follow narrow green corridors between higher ridges. A reader who keeps all four maps together can move from settlements and roads to streams and terrain without asking one map to carry information it was not designed to show.
The set works well for classroom geography, local-history orientation, general trip preparation, and county-scale research. It is not a replacement for current navigation, parcel records, flood-hazard maps, or survey-grade elevation data. Those limitations are important, but they do not reduce the value of the maps as a compact geographic overview of Crawfordville, Sharon, the Little River branches, the Ogeechee drainage, and Taliaferro County’s rolling hills.
Frequently Asked Questions
Why does the city map highlight only Crawfordville and Sharon?
The supplied city map ranks Crawfordville and Sharon as its two major-city reference points. The broader county map also labels places such as Carters Grove and Raytown, so the two-city view should not be interpreted as a complete list of every community.
Are the Little River branches and the Ogeechee River the same waterway?
No. The map labels North Fork Little River and South Fork Little River in the northern part of the county, while North Fork Ogeechee River, South Fork Ogeechee River, and Ogeechee River are shown farther west and south as separate named channels.
Can the 106–217 meter elevation range be used as a site survey?
No. That range summarizes the county-scale elevation surface shown on the supplied map. Precise height information for a parcel, structure, or construction project requires site-specific survey or official elevation data.
Sources and reference data
- U.S. Census Bureau QuickFacts for Taliaferro County
- New Georgia Encyclopedia entry for Taliaferro County
- USGS National Hydrography
- USGS 3D Elevation Program
Map File Information
The ZIP contains the four high-resolution A3 JPG originals introduced on this page: the county reference map, city map, terrain-and-water map, and elevation map.
- Included Files: Four high-resolution A3 JPG maps: county reference, city, terrain-and-water, and elevation
- File Type: ZIP archive containing four JPG maps
- Intended Use: Printing, education, presentations, and map-based projects
Related Maps
Green Map creates custom-edited map images using open geographic data sources such as geoBoundaries, Natural Earth, OpenStreetMap, and government open data. These maps are edited visual materials, not raw data files, and are provided for education, documents, presentations, and graphic reference.