Franklin County has one of the clearest internal land-cover contrasts in northern New York. The 2025 classification is 65.16% forest, 15.72% wetlands, 9.40% agriculture, 3.82% water, and 3.77% developed land. Those percentages matter, but the map makes the geography much easier to understand: farmland and small developed places are most visible in the north, while broad Adirondack forest, wetlands, and lakes dominate farther south.
Four complementary maps on this page let you compare current land cover, forest and farmland, impervious surface and developed land, and mapped class differences between 1985 and 2025. After reviewing the WebP previews, you can download one ZIP containing all four original JPG maps for classroom work, reports, presentations, or other map-based projects. Land cover describes the surface seen in remotely sensed data; it is not zoning, ownership, a parcel survey, or a statement about what a property may legally be used for.
Table of Contents
A strong north–south contrast defines the 2025 land-cover pattern
Forest is the first feature that stands out across the county. Large green areas fill much of the center and almost all of the southern portion, where lakes and wetlands break up the wooded landscape. Agricultural colors become much less common as the map moves south. The result is a broad Adirondack setting with relatively few developed clusters.
Northern Franklin County looks different. Yellow agricultural patches spread around Malone and through areas closer to the Canadian border, mixed with forest, wetlands, and small settlements. Developed land is also easier to spot here than in the south. Instead of forming a large metropolitan area, the red classes appear as compact centers and narrow corridors linked to roads and populated places.
Wetlands account for 15.72% of the county, making them the second-largest mapped category. They are not confined to a single lowland or lake edge. Wetland colors appear among northern farm areas and continue through central and southern forested terrain, often near streams, lakes, or other wet ground. Water covers 3.82%, with numerous blue features especially noticeable in the southern half.
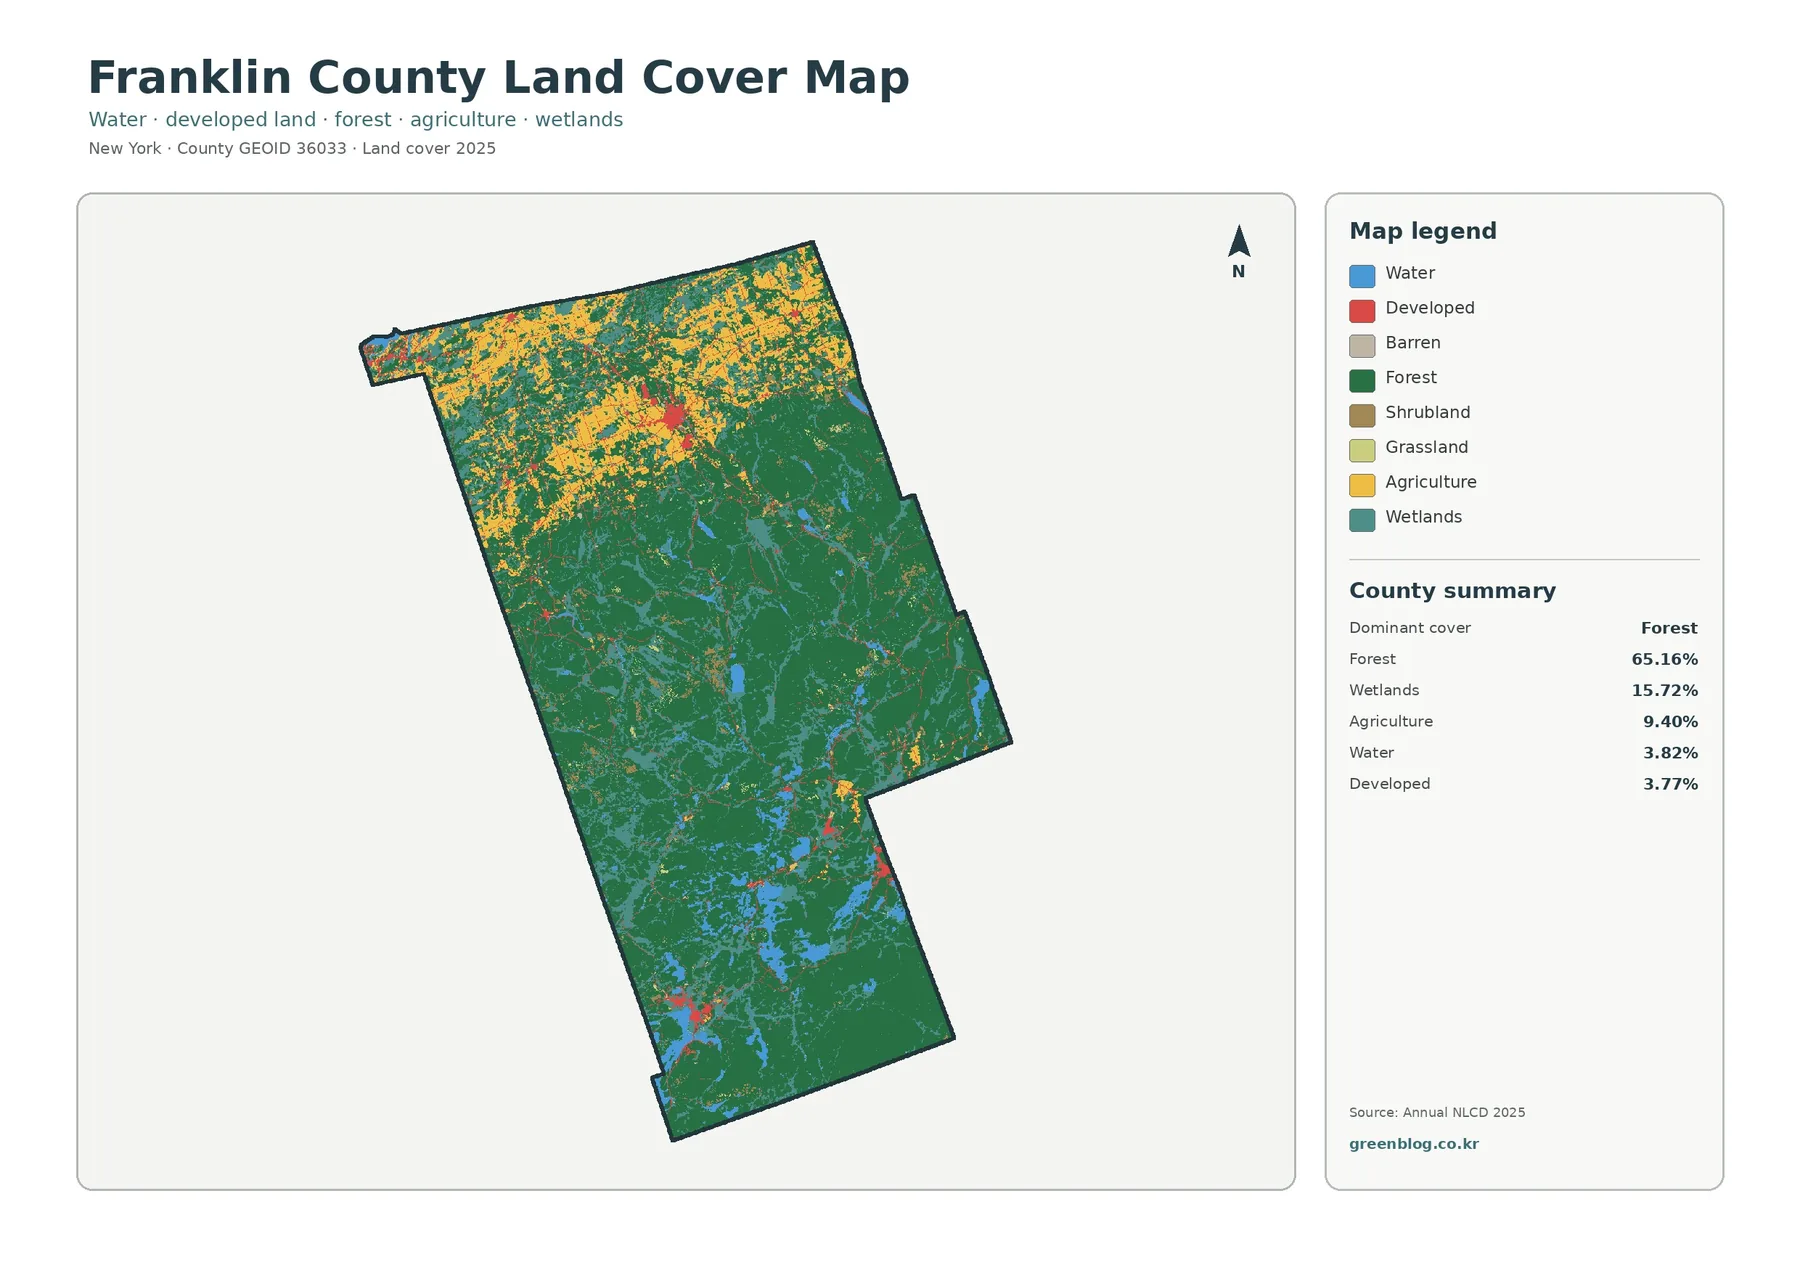
A useful way to read this first map is to identify the large regional pattern before examining individual classes. Agriculture and development are more prominent in the north; forest, wetlands, and water become more dominant toward the Adirondack south. That gradual transition explains the county more clearly than any single percentage.
Forest and farmland mapping makes the transition easier to see
The forest-and-farmland layer removes much of the visual complexity associated with detailed developed classes. Once simplified, the northern agricultural concentration becomes unmistakable. Cropland and pasture or hay occupy broad patches around Malone and other northern communities, while forest still fills the spaces between fields rather than disappearing completely.
Moving south from the farm belt, open agricultural patches become smaller and less frequent. Forest takes up an increasing share of the landscape, wetlands remain common, and water features appear more often. The middle of the county therefore works as a transition zone rather than a sharp boundary. By the southern Adirondack portion, dark green forest is overwhelmingly dominant.
The legend separates cropland from pasture and hay, and it also distinguishes shrub or grass cover, wetlands, and water. That distinction matters because an open-looking area is not automatically farmland. The map does not show farm ownership, individual field boundaries, or crop type. For those questions, agricultural statistics and parcel-level information are more appropriate.
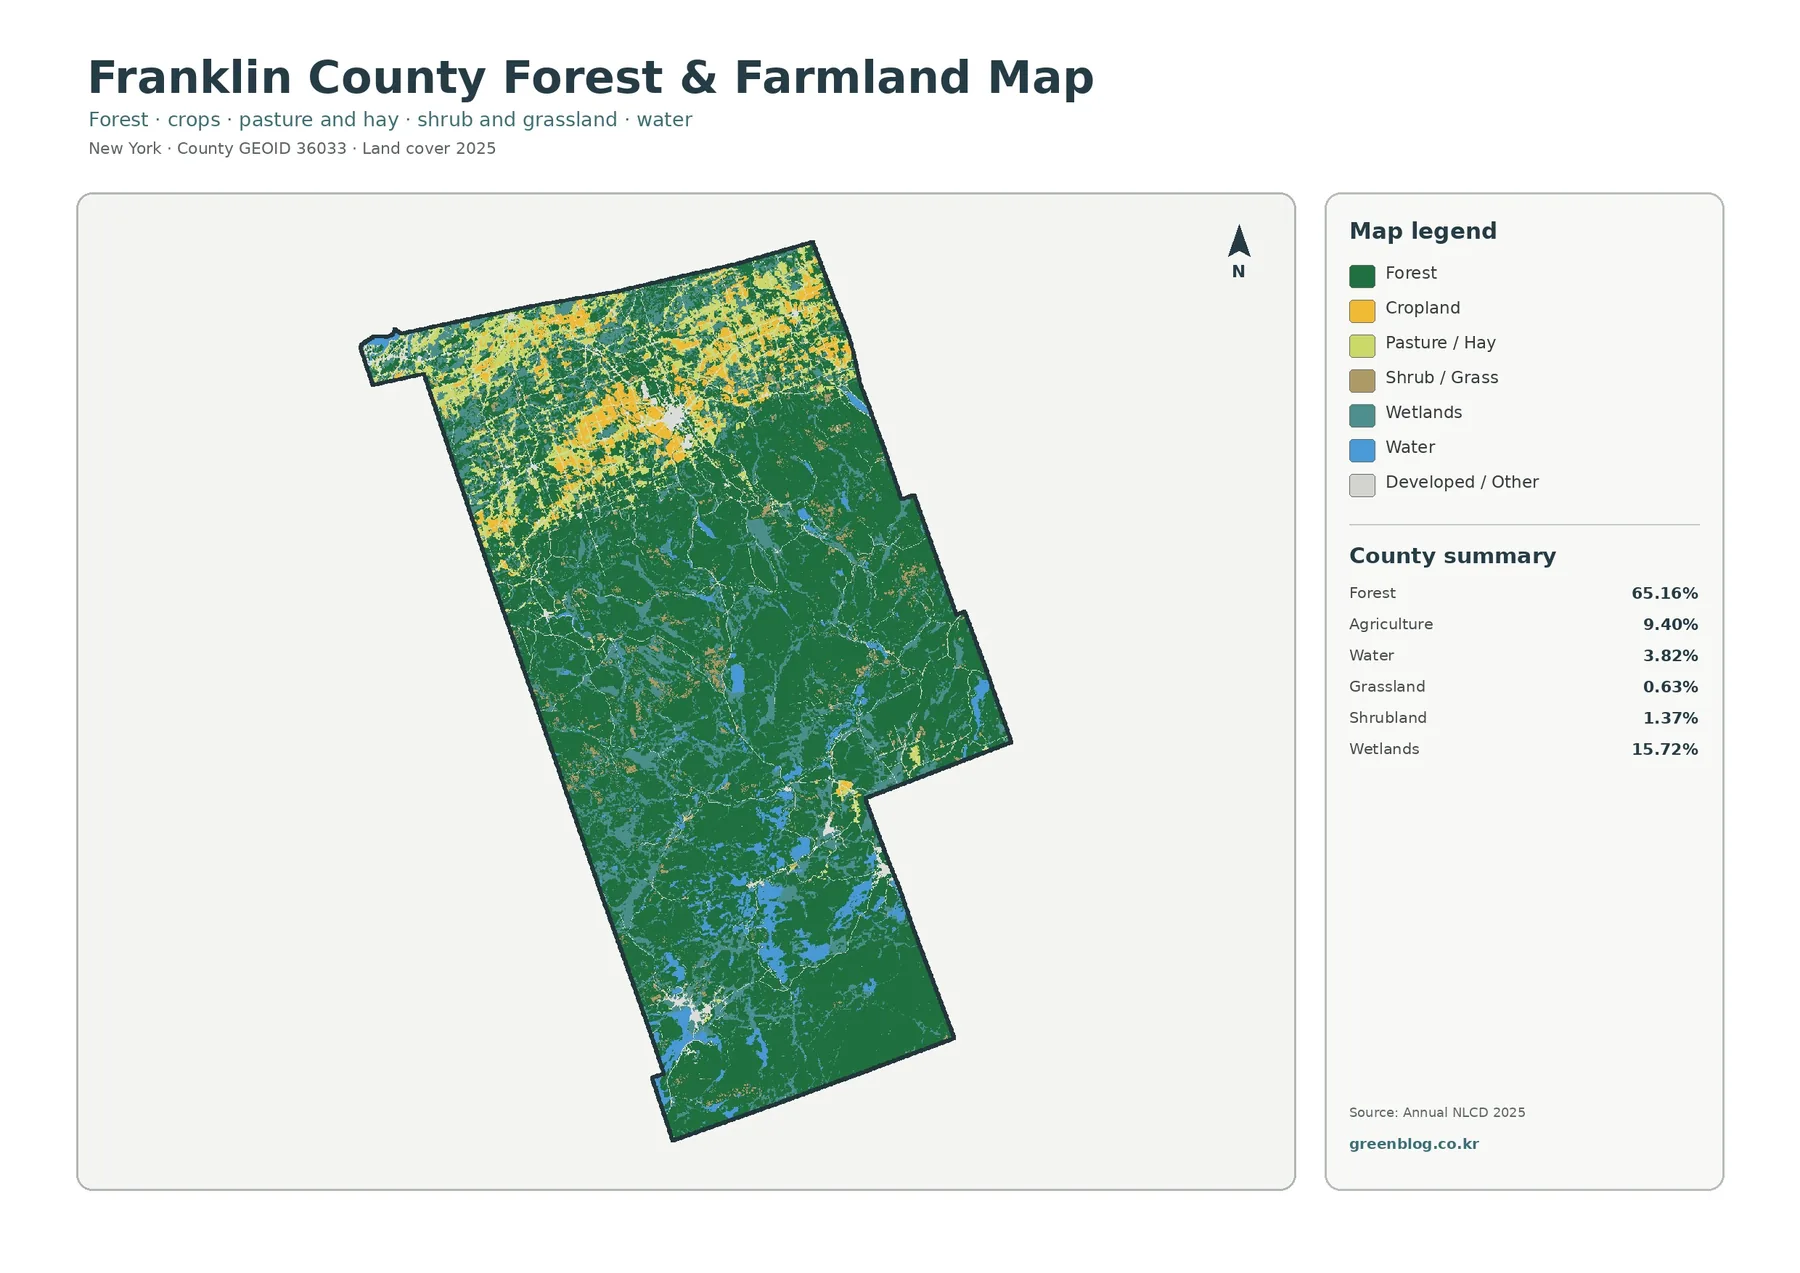
Regional context helps explain why this layer is useful. Franklin County includes active agricultural communities in its north while extending deeply into the Adirondack landscape farther south. Cornell Cooperative Extension Franklin County provides local agricultural information, but the map contributes the spatial view by showing where agricultural cover is concentrated and where continuous forest becomes dominant.
Impervious surfaces remain concentrated in small centers and along roads
Impervious surface measures hard materials such as pavement, parking areas, and rooftops that do not readily absorb water. Franklin County has a mean impervious value of 0.80%, and only 0.29% of the county is mapped at 50% impervious or greater. Those figures are far below the 3.77% developed-land share because developed classes can include lawns, trees, and other permeable surfaces.
Malone forms the clearest concentration on the map. Darker red values cluster around the populated center, while thinner lines extend outward along roads. Smaller concentrations occur elsewhere in northern Franklin County and around a few settlements farther south. None of them expands into a broad urbanized zone.
Much of the central and southern map remains pale. Roads can still be traced in places, but they cross a landscape where forest, wetlands, and water dominate. The low countywide impervious average therefore fits the overall land-cover picture rather than standing apart from it.
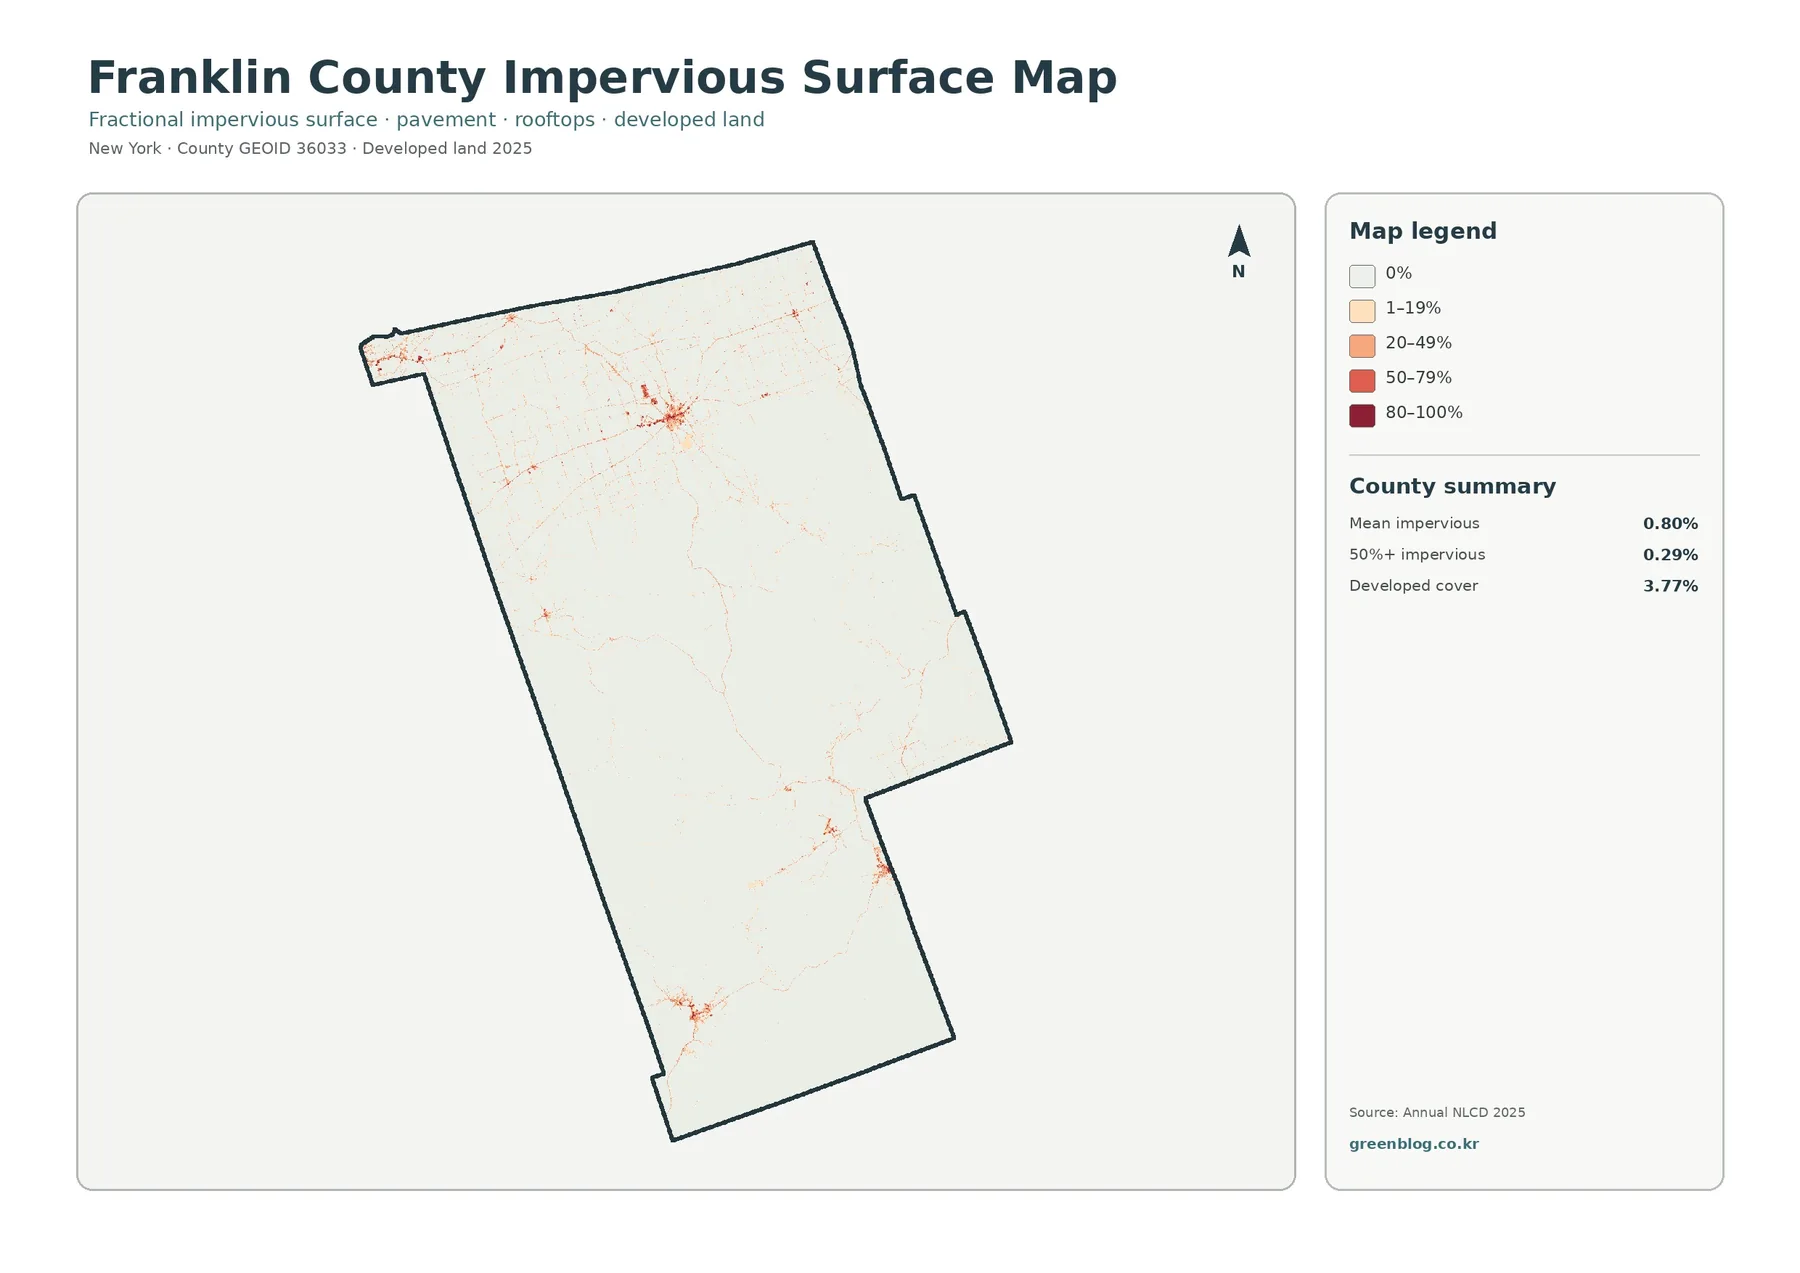
This layer can be useful when discussing runoff or development intensity, but it should not be treated as a flood-risk map. Water movement also depends on terrain, soils, rainfall, streams, drainage infrastructure, and many other factors. A high impervious value is best used as a clue about where hard surfaces are concentrated, not as a complete environmental diagnosis.
The 1985–2025 comparison shows dispersed class differences rather than one large conversion area
The change layer compares mapped classes at the same locations in 1985 and 2025. Overall class difference is 9.14%. Cells classified to developed account for 0.56%, forest loss for 2.00%, agricultural loss for 0.33%, and other class differences for 6.00%. Instead of forming one continuous front, colored patches are scattered across the county.
Northern areas contain many of the more visible changes. Orange forest-loss marks and purple other-difference cells appear through the mixed farm-and-forest landscape, while some red developed-change cells occur near settlements and transportation corridors. The pattern remains fragmented, with many small areas separated by unchanged cells.
Southern Franklin County also contains mapped differences, but no single category takes over the Adirondack portion. Small patches occur within forest and wetland settings, producing a speckled pattern rather than a broad zone of uniform conversion. That distribution argues for careful site-by-site interpretation.
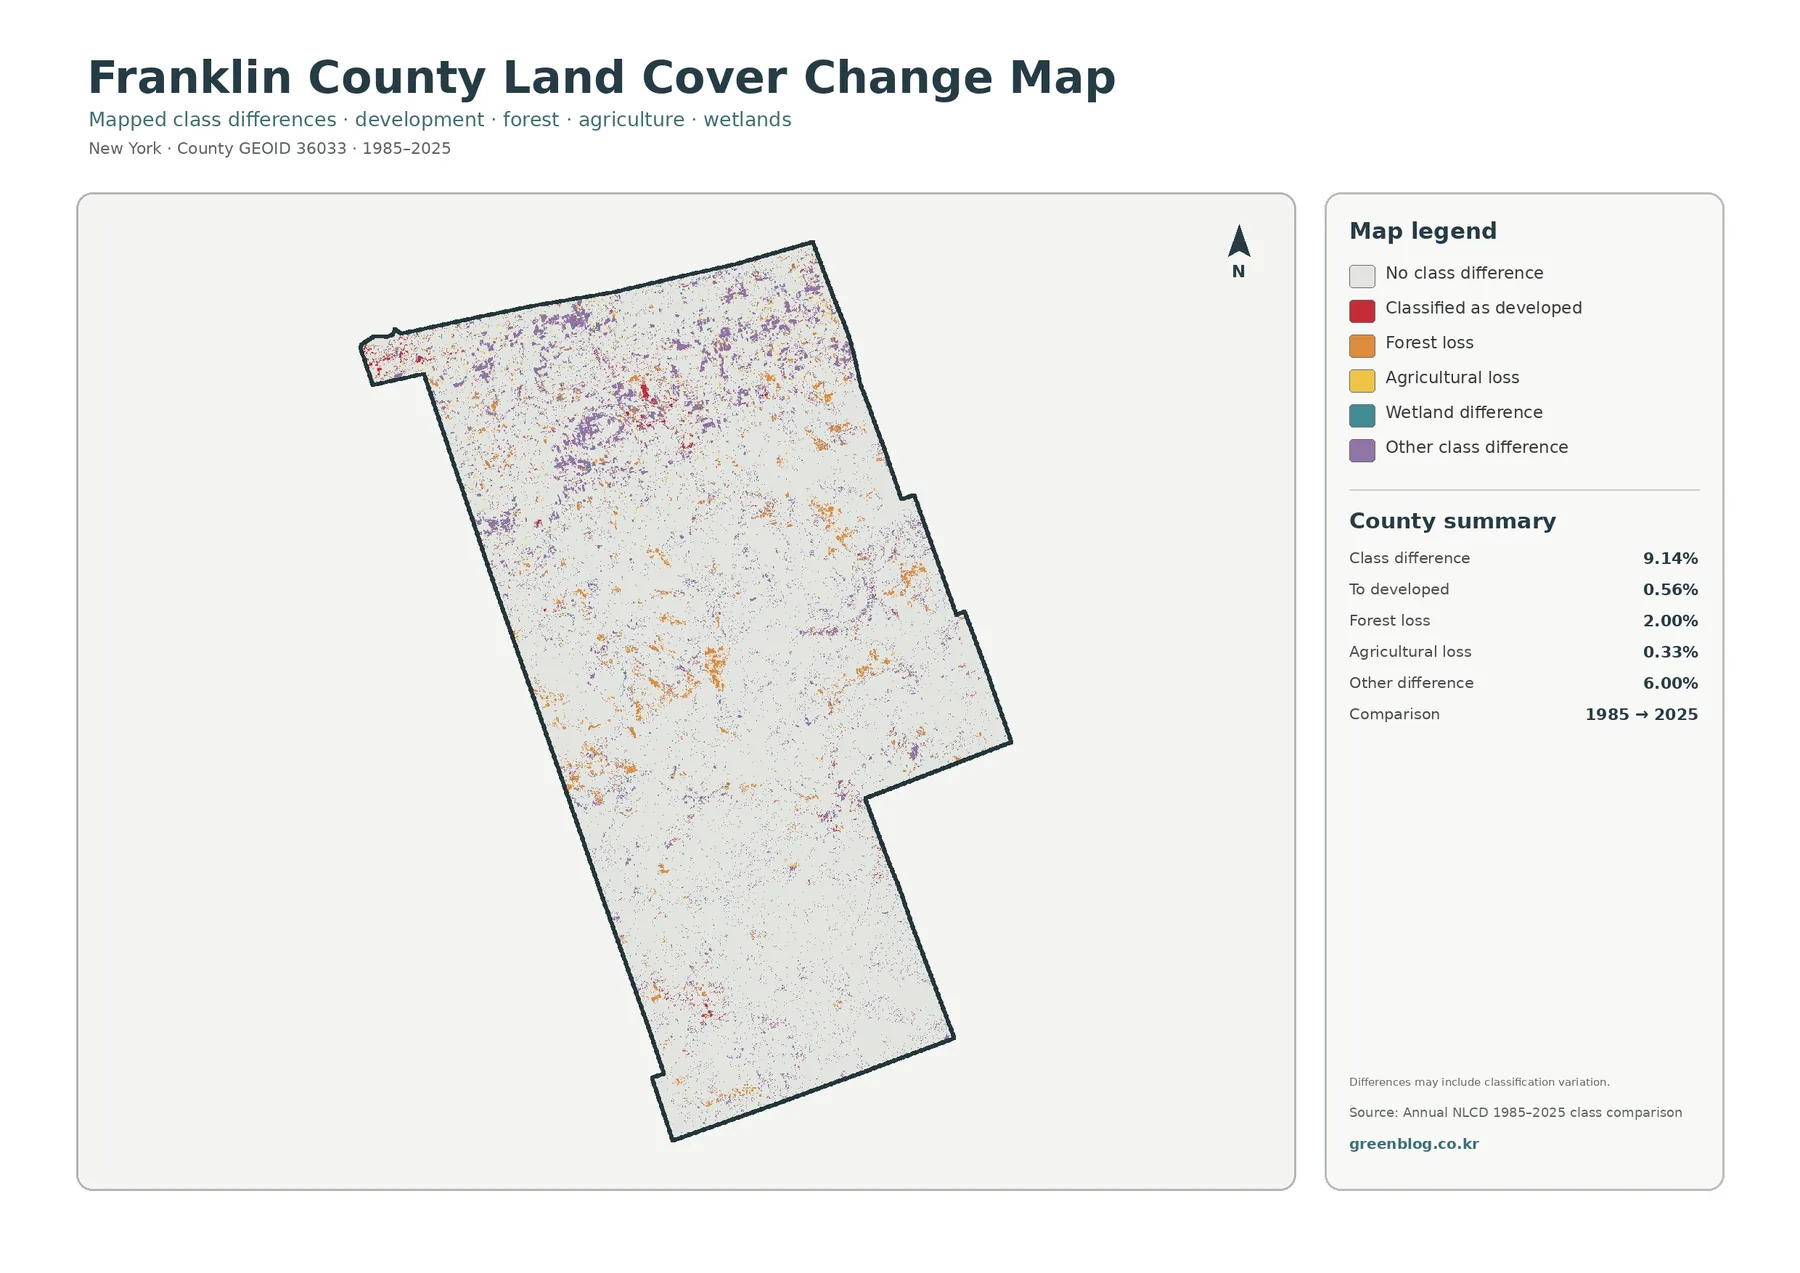
A 9.14% class difference does not mean that every one of those cells experienced a confirmed land-use event. Seasonal conditions, imagery characteristics, mixed pixels, and classification procedures can contribute to differences between two dates. Historical aerial photographs, planning records, or field information are better sources when the cause of change at a specific location matters.
Frequently Asked Questions
What is the dominant land cover in Franklin County?
Forest is the dominant 2025 class at 65.16%. Wetlands are second at 15.72%, and agriculture accounts for 9.40%. The largest forest areas extend through much of the central and southern county.
Where is agricultural cover most visible?
Agriculture is concentrated in northern Franklin County, especially around Malone and other areas closer to the Canadian border. It becomes much less common toward the Adirondack south.
Does the 9.14% class difference represent confirmed physical conversion everywhere?
No. It is the share of cells whose mapped class differs between 1985 and 2025. Real landscape change may be included, but imagery conditions, mixed pixels, and classification variation can also contribute.
Practical uses for classrooms, reports, and regional context
Franklin County is a useful teaching example because one county contains two visually different landscapes. Students can identify the farm belt in the north, trace the growing dominance of forest toward the south, and then compare wetlands and water features across both areas. Connecting the map colors to the summary percentages helps turn an abstract table into a geographic pattern.
Agriculture-focused presentations can center on Malone and other northern farming areas. Local information from Cornell Cooperative Extension Franklin County adds context about agricultural programs and community activity, while the map shows where agricultural cover is concentrated across the county as a whole.
Environmental or natural-resource discussions can begin with the extensive southern forest and the countywide wetland share of 15.72%. The graphics are suitable for orientation, comparison, and presentation, but they do not identify wetland jurisdiction, habitat quality, conservation priority, or ownership. Those questions require more detailed datasets and local or field-based information.
Report writers may also find the four JPG files useful as a matched visual sequence. A general land-cover map works well as an opening overview, followed by the forest-and-farmland layer for rural context or the impervious map for development. The historical comparison can close the sequence when a long-term perspective is needed.
Raster classification has limits at small scales
These maps are based on raster data, which divide the landscape into grid cells and assign a representative class or value to each cell. Narrow roads, small buildings, field edges, and small streams may share a cell with surrounding cover. For that reason, a crisp color boundary on the map should not be read as an exact property, ecological, or regulatory boundary.
Mixed pixels are especially important near edges. One cell can contain forest, a road, and part of a field, yet the classification still needs one representative result. Small isolated patches deserve more cautious interpretation than large continuous areas where the surrounding pattern is consistent.
The current maps use the supplied 2025 classification. Development, forest disturbance, agricultural rotation, or wetland change after that observation period may not be represented. Likewise, the historical layer compares 1985 and 2025 rather than showing a continuous year-by-year record of every change.
Download the four Franklin County JPG maps
The downloadable ZIP contains four original JPG maps for Franklin County: current land cover, forest and farmland, impervious surface and developed land, and the 1985–2025 land-cover comparison. Keeping the maps together makes side-by-side use easier in classroom handouts, reports, printed reference sheets, and slide presentations.
Map File Information
Franklin County Land Cover Map Files
- Included Files: Use only the versions confirmed in the article and supplied images
- File Type: Use the confirmed download contents
- Intended Use: Printing, education, presentations, and map-based projects
Related Maps
- Albany County Land Cover Map
- Bronx County New York Land Cover Map
- Cattaraugus County New York Land Cover Map
Sources and references
MRLC Annual NLCD Data — official access to Annual NLCD products and supporting data.
USGS Annual NLCD Land Cover Classification — background on the land-cover classes used in Annual NLCD.
New York State – Franklin County — official state information about the county and its regional setting.
Cornell Cooperative Extension Franklin County Agriculture — local agricultural education and program information.
Green Map creates custom-edited map images using open geographic data sources such as geoBoundaries, Natural Earth, OpenStreetMap, and government open data.
These maps are edited visual materials, not raw data files, and are provided for education, documents, presentations, and graphic reference.