Grayson County sits in North Texas at the Oklahoma line, about 60 miles north of Dallas according to the county government. Sherman is the county seat and the strongest central reference on the maps, while Denison lies just to the north and Lake Texoma spreads across much of the upper edge of the county. This page combines those familiar places with roads, smaller communities, waterways, and elevation, and the high-resolution JPG map files are available as a single ZIP download.
The county is easier to understand when it is viewed as several connected areas rather than one large city region. Sherman and Denison form the busiest central-northern cluster, Whitesboro marks the western side, Pottsboro sits closer to Lake Texoma, and Howe and Van Alstyne lead toward the southern edge. Bells, Tom Bean, and Whitewright help define the eastern side. The maps make those relationships visible without requiring a long list of place names.
Four map files are supplied for this page. The county map emphasizes places, roads, parks, and nearby counties; the city map ranks six major cities; the water map labels rivers, creeks, lakes, and the reservoir shoreline; and the elevation map shows local relief from roughly 148 to 279 meters. Each map has a different job, so the sections below focus on what can actually be seen in that specific image rather than repeating the same description.
Table of Contents
Sherman and Denison form the clearest starting point
On the general county map, Sherman stands near the middle of the populated corridor and contains the Grayson County Courthouse marker. Denison is north of Sherman, and Grayson College appears between the two urban areas. The concentration of streets and developed shading around these places contrasts with the broader open spaces to the west and southwest. That difference makes the central corridor easy to recognize even before reading every road shield or community label.
Moving outward from Sherman reveals how varied the county is. Southmayd and Dorchester sit nearby, Howe and Van Alstyne continue south, and Gunter and Tioga occupy the southwestern portion. To the west, Whitesboro lies close to the county edge. Pottsboro is northwest of Denison and closer to the Lake Texoma side, while Bells, Tom Bean, and Whitewright establish a separate set of reference points in the east. These places make it possible to judge direction and distance across the county without treating Sherman as the only useful landmark.
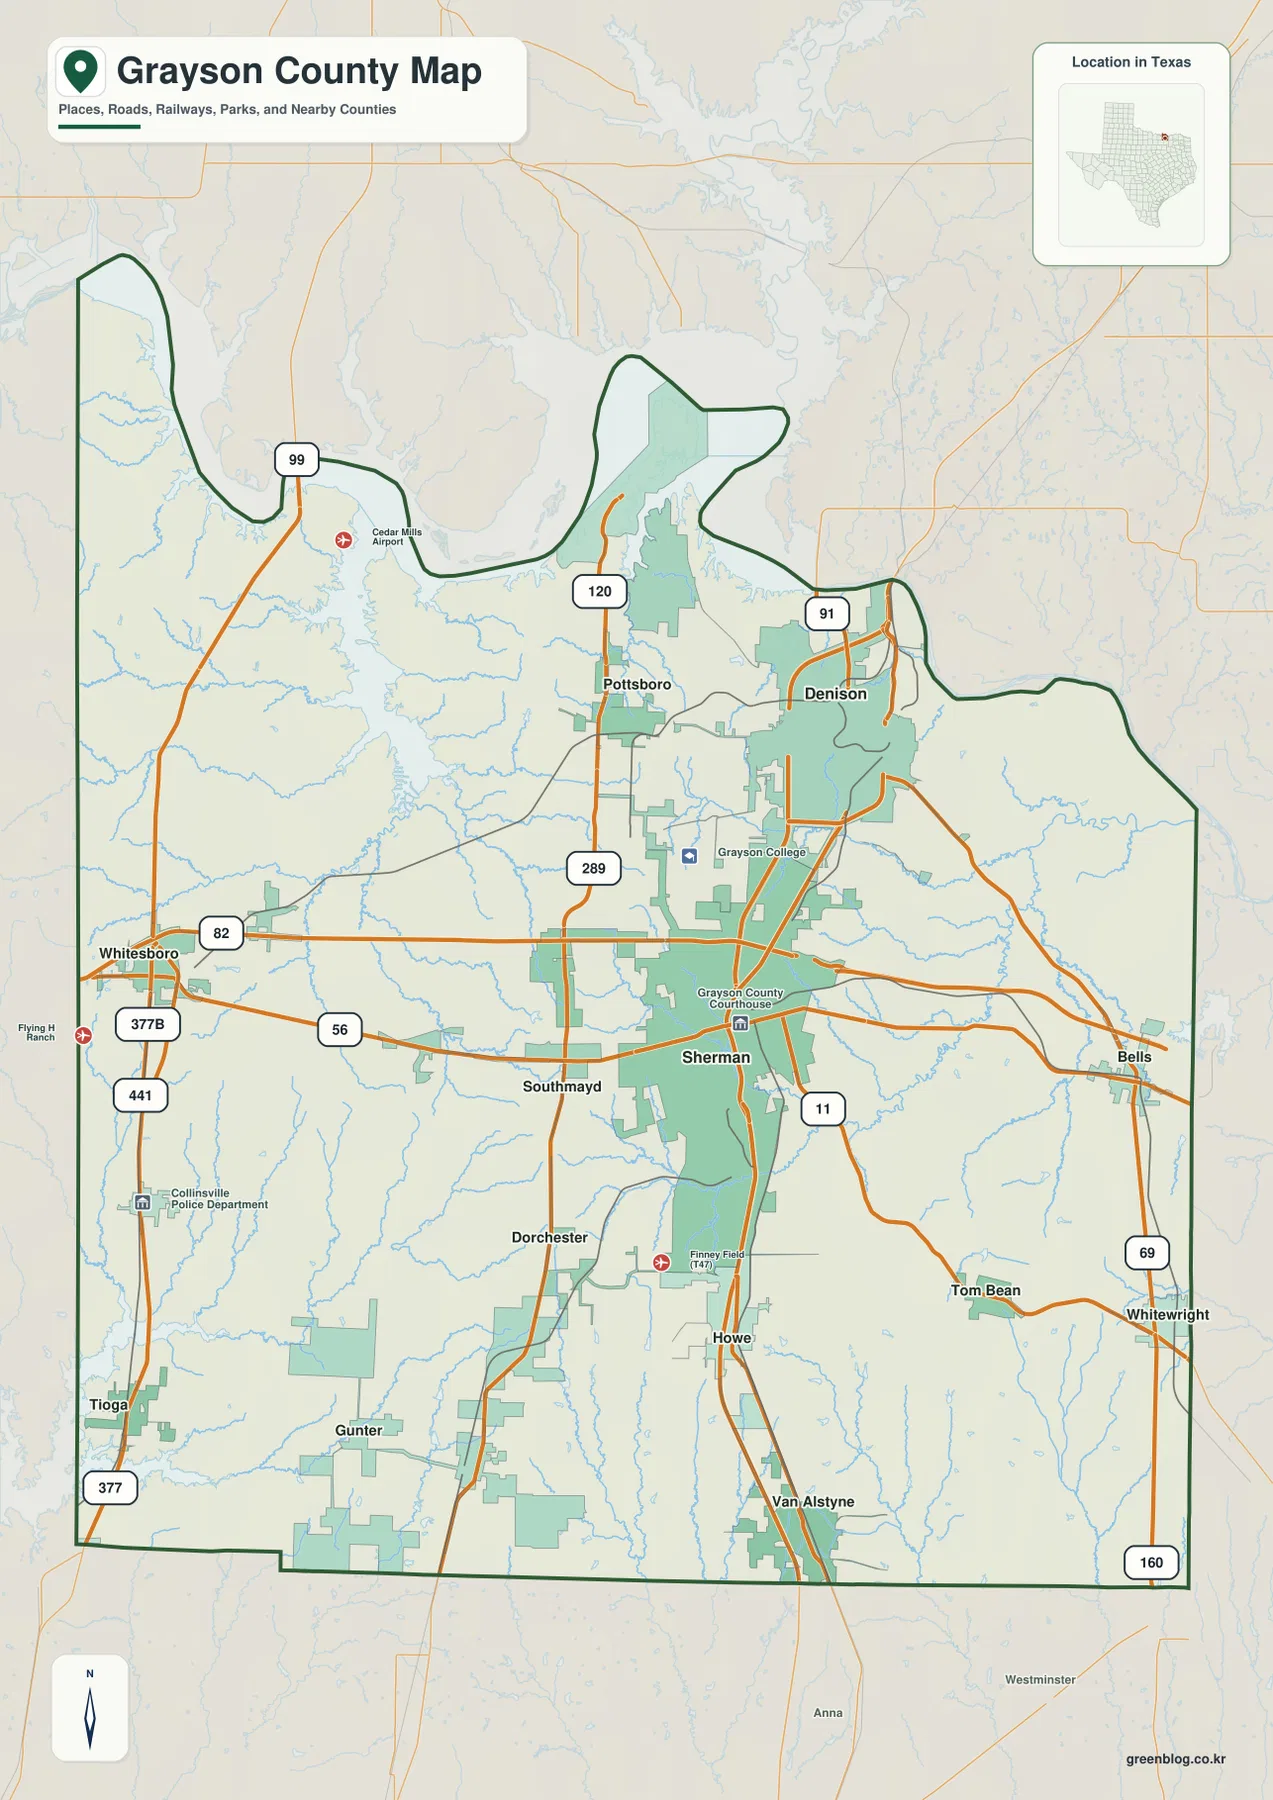
Roads explain much of the connection between those communities. The existing county material identifies U.S. 75 as the main north-south route linking Sherman and Denison with the Dallas direction, while U.S. 82 crosses the county from west to east. The map also shows routes numbered 289, 120, 91, 56, 11, 69, and 160 in different parts of the county. For a visitor, teacher, or local researcher, the combination of these roads with city labels is more useful than a boundary-only outline because it shows how a trip can continue beyond one community.
The northern county line is much less regular than the southern boundary. Water is the main reason. Lake Texoma and the Red River create a long, curving edge against Oklahoma, while the southern border appears comparatively simple. That contrast is important when judging travel: two places that look close in a straight north-south comparison may require a more specific crossing or road because the reservoir and river shape the available routes.
The ranked city map separates the main centers from smaller towns
The city map highlights six communities instead of trying to label every town. Sherman is ranked first and Denison second, followed by Van Alstyne, Whitesboro, Howe, and Pottsboro. The ranking provides a quick visual hierarchy, while the map location shows that the six are not clustered in one corner. Sherman and Denison are close together, but the other four pull the reader south, west, and northwest across the county.
Van Alstyne is positioned near the southern edge toward Collin County, and Howe lies farther north on the same general side of the county. Whitesboro is close to the western boundary, while Pottsboro sits north of the central part of the county and closer to the Lake Texoma shoreline. This arrangement is useful for understanding why different parts of Grayson County may look toward different nearby cities for work, shopping, recreation, or through travel. The map does not attempt to describe those activities in detail; it simply provides a clear geographic frame for them.
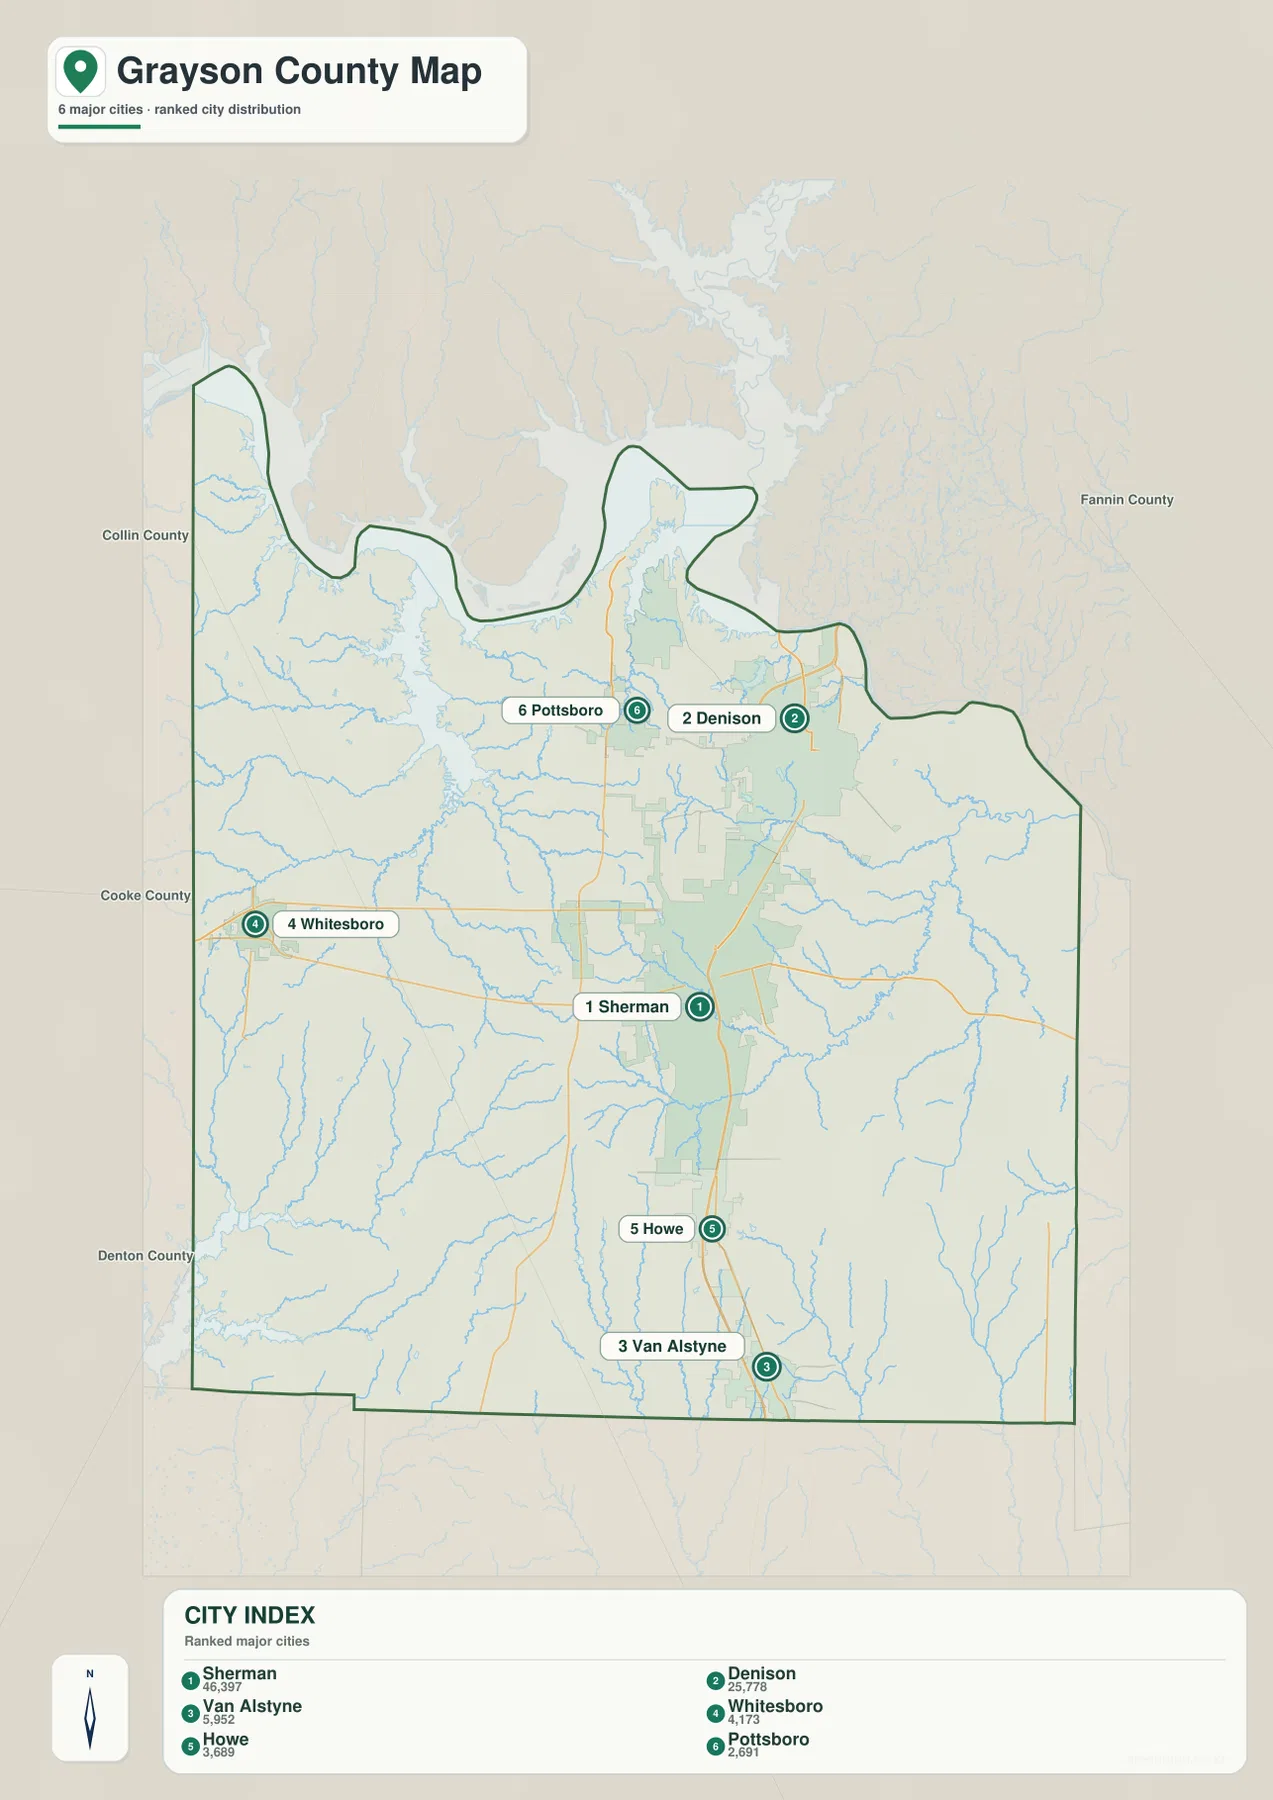
Names outside the boundary provide another useful clue. Cooke County, Denton County, Collin County, and Fannin County are shown around the Texas sides of Grayson County. The existing county material also identifies Bryan and Marshall counties in Oklahoma along the northern side. Instead of reading those labels as a separate list, use them to orient the six ranked cities: Whitesboro is nearer the western edge, Van Alstyne is near the south, and Denison and Pottsboro sit closer to the Oklahoma and Lake Texoma side.
The city map is intentionally simpler than the general map. Bells, Tom Bean, Whitewright, Tioga, Gunter, Southmayd, and Dorchester may be visible on the broader county map but are not part of the six-city ranking. That is not a contradiction. It reflects the different purpose of the two images: one is designed to show a fuller set of places and roads, while the other reduces the county to a quick comparison of its larger named centers.
Lake Texoma and the Red River shape the entire northern edge
The water and terrain map makes the northern geography unmistakable. A broad reservoir shoreline fills the upper part of the image, and the Red River label appears near the northeastern boundary. Lake Texoma is the dominant water feature in this part of the county, and the U.S. Army Corps of Engineers maintains the federal lake project from a Denison office. On the map, the reservoir shoreline creates deep inlets and irregular projections that explain why the county outline bends so frequently along the Oklahoma side.
Smaller water bodies are distributed well south of the reservoir. The map labels Russel Lake, Waterloo Lake, Loy Lake, Sherman Country Club Lake, and Meadow Pond. These features are much smaller than Lake Texoma, but they help show how drainage is spread through the interior rather than confined to the county line. Around Sherman and Denison, the mix of small lakes and creek channels is especially useful when the water map is compared with the city and road map.
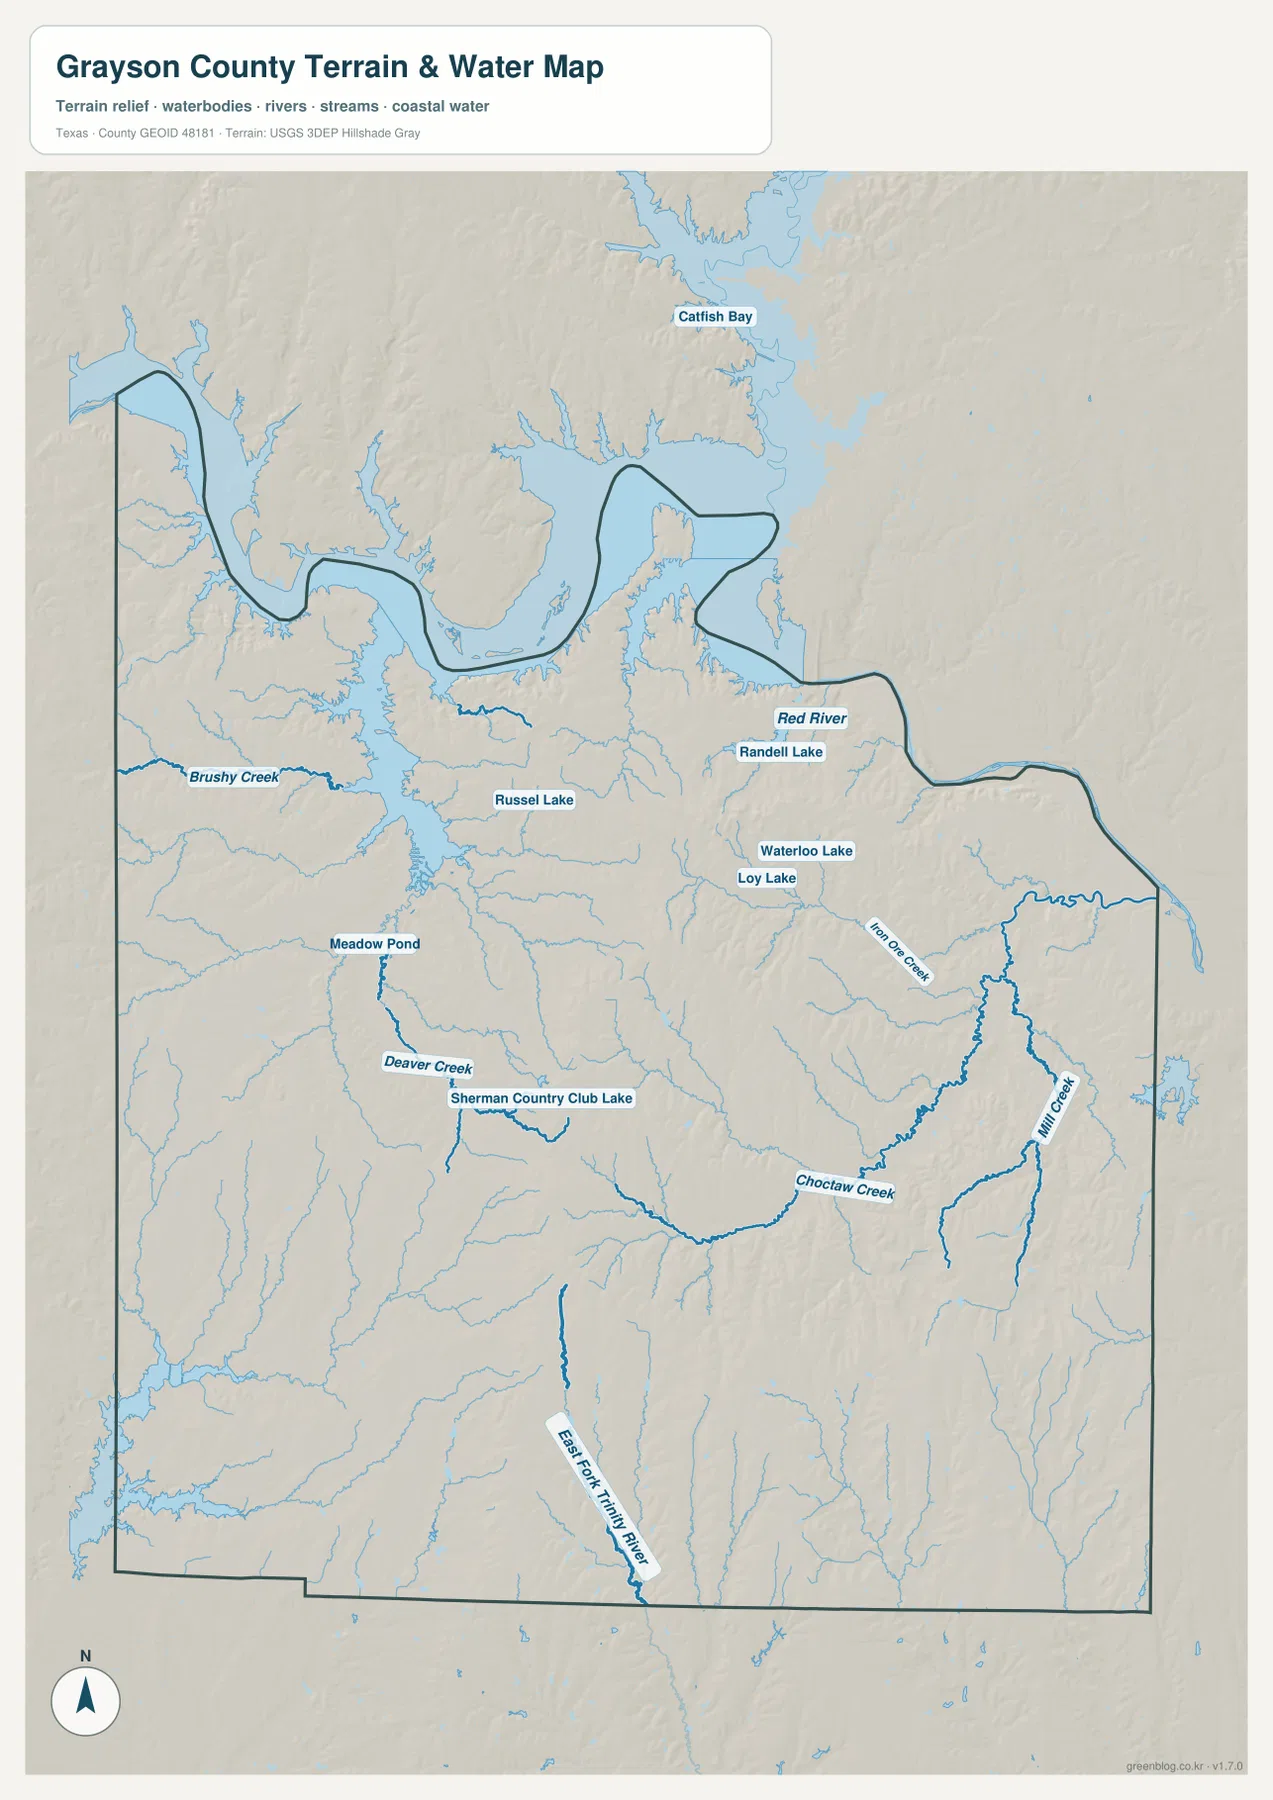
Several named streams make the interior network easier to follow. Brushy Creek and Deaver Creek are labeled in the western half, while Iron Ore Creek and Mill Creek are shown in the east. Choctaw Creek curves through the central-eastern part of the county, and the East Fork Trinity River appears in the south. The map also marks Catfish Bay north of the county boundary. Together, these names show that water does not drain in only one direction and that the county contains many small valleys between the better-known reservoir and river features.
This image should be used as a geographic water reference, not as a flood hazard map, property map, or navigation chart. It is well suited to questions such as where a named creek lies relative to Sherman, which parts of the county are close to large water, or why the northern boundary has its distinctive shape. Flood risk, parcel ownership, and boating details require separate authoritative products made for those purposes.
Elevation reveals low water corridors and higher interior ridges
The elevation map uses a local color scale for Grayson County. Its legend reports an actual range of about 148 to 279 meters and a mean elevation of about 217 meters. Greens represent the lower part of the local range, while lighter tan and brown colors mark higher ground. Because the scale is fitted to this county, the colors are best used for comparisons within Grayson County rather than comparisons with mountain counties elsewhere in the United States.
Lower green areas are prominent around the northern water edge and in several creek valleys. Higher brown terrain appears more strongly along portions of the west and in a broad, elongated area through the central-southern part of the county. Numerous narrow valleys cut into those higher surfaces. The result is more varied than a simple flat-plain description would suggest: the county contains a repeated pattern of shallow drainage corridors separated by rolling higher ground.
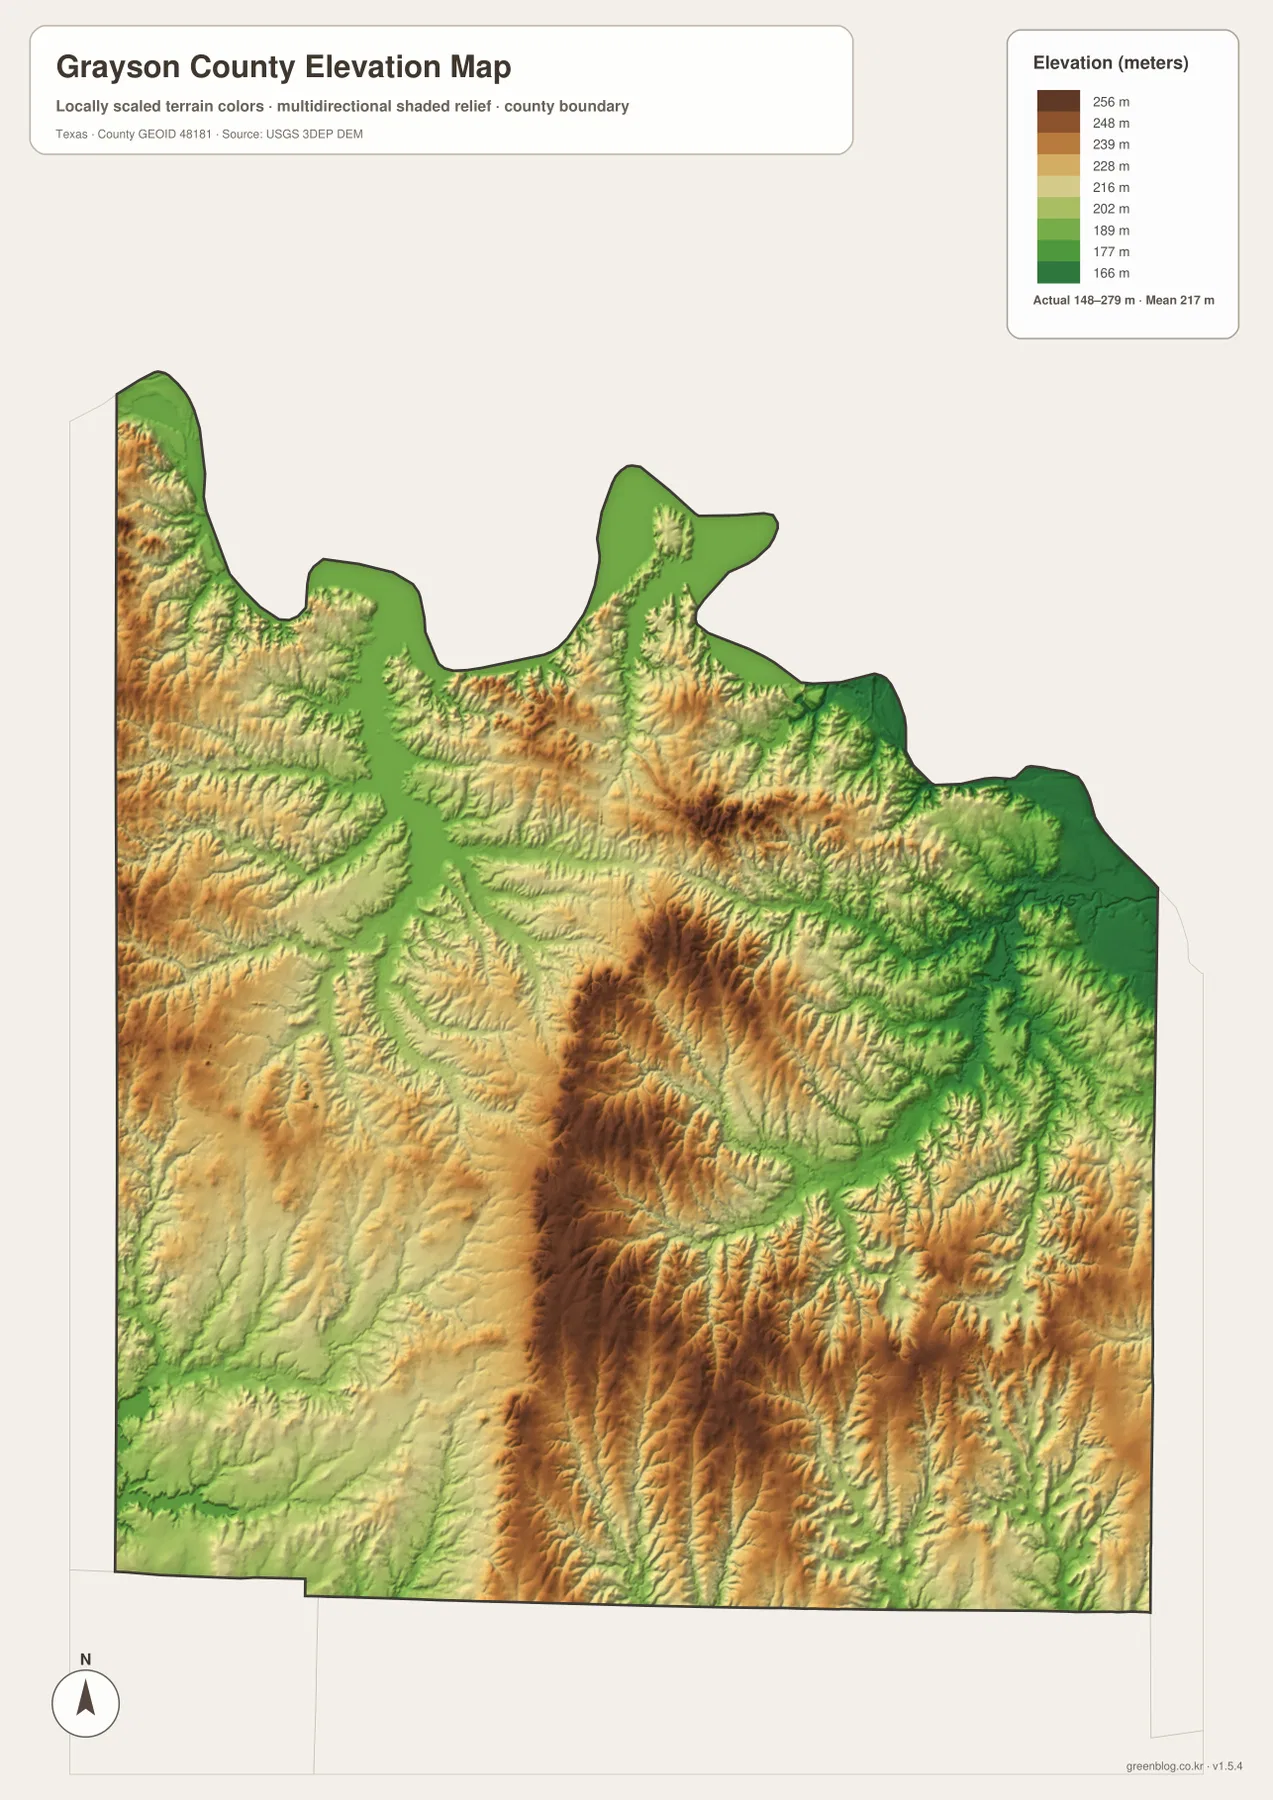
The water map helps explain many of the green low areas on the elevation image. Where creeks run across the county, the shaded relief frequently forms narrow lower corridors, while adjacent ground rises on either side. The broad northern lowlands also correspond to the reservoir and Red River setting. Looking at the two maps together is therefore more informative than treating elevation as an isolated number. It connects the visible relief to actual named water features.
The elevation surface is not survey-grade data for a particular lot, structure, road project, or drainage design. It is a county-scale visualization designed to show relative relief. For classroom geography, trip planning, regional comparison, or general local study, that level of detail is useful because the map makes the broad high-low differences easy to see without requiring specialized GIS software.
West, east, and south Grayson County have different visual character
The western side of the county is marked by smaller towns and wider gaps between developed areas. Whitesboro, Tioga, and Gunter provide orientation, but the map contains much more open space between them than around Sherman and Denison. The elevation image also shows noticeable rolling relief in parts of the west, while the water map includes Brushy Creek, Deaver Creek, and scattered small water bodies. Taken together, those details give the western side a different visual character from the central urban corridor.
The east has its own chain of places. Bells, Tom Bean, and Whitewright appear along different road connections east and southeast of Sherman. Iron Ore Creek, Choctaw Creek, and Mill Creek are also concentrated in that side of the water map. The county therefore does not fade into an empty margin east of Sherman; it continues through named communities and a dense set of small drainage channels toward Fannin County.
The south is defined by the route toward Howe and Van Alstyne and, beyond the county, the larger North Texas urban region. The Grayson County government describes the county as roughly 60 miles north of Dallas, which matches the map orientation: moving south from Sherman leads through smaller cities toward Collin County, while moving north leads toward Denison, Lake Texoma, and Oklahoma. That north-south contrast is one of the easiest ways to remember the county layout.
Choosing the right Grayson County map for the task
Use the general county map first when you need roads, a wider selection of town names, the courthouse, Grayson College, or the relationship between communities and the boundary. It is the most complete orientation image and works well for a first look at the county. If the goal is simply to compare the most prominent cities, the ranked city map removes much of that detail and makes Sherman, Denison, Van Alstyne, Whitesboro, Howe, and Pottsboro easier to compare.
For lake, river, and creek questions, the water map is the better starting point. It makes the Lake Texoma shoreline, Red River, named lakes, and smaller tributaries much more visible than the general map. The elevation map is best when the question is about relative height: where low valleys run, where higher rolling ground stands out, or how the terrain changes between the reservoir side and the county interior. Switching between those two natural-feature maps can clarify why water follows particular low corridors.
Printed use is another reason to keep the maps separate. A road-and-place lesson may need the general map, a population or settlement discussion may use the ranked city map, and a physical-geography lesson may place the water and elevation maps side by side. The downloadable JPG files are 2572 by 3638 pixels each, larger than the WebP previews on the page, so labels and linework remain more useful when the maps are printed or placed in a presentation.
Details that become clearer when the maps are compared
One easy-to-miss detail is the difference between the city ranking and the full place map. Sherman and Denison dominate the ranking, but a trip across the county may depend on smaller places such as Tioga, Gunter, Bells, Tom Bean, or Whitewright. The general map supplies those additional labels. A reader looking only at the ranked map could understand the main population centers yet still miss the smaller communities that make the county easier to navigate.
A second detail is the scale of the northern water boundary. On the general map it appears as a large pale water area behind the road and city information. On the water map it becomes the central geographic feature, with bays, inlets, creeks, and the Red River visible much more clearly. That change in emphasis explains why Pottsboro and Denison are useful northern references and why the county line cannot be understood as a simple rectangular edge.
A third detail is the meaning of the elevation colors. Brown areas are higher than green areas within this county, but the highest mapped elevation is only about 279 meters. The color ramp is locally scaled, so a dark brown ridge here should not be interpreted as equivalent to a high mountain elsewhere. The correct use is to compare nearby parts of Grayson County and identify relative highs, lows, and drainage valleys.
Finally, the maps show how one county can connect two very different regional directions. Southbound roads lead toward the Dallas side of North Texas, while the north ends at Lake Texoma, the Red River, and Oklahoma. Sherman and Denison sit between those two directions. That simple orientation helps organize the other details—town rankings, highways, creek names, and elevation—into a coherent picture of where Grayson County is and how its landscape is arranged.
Frequently Asked Questions
Where are Sherman and Denison on the Grayson County map?
Sherman is near the central part of the county, slightly south of Denison. The two cities form the strongest developed cluster on the maps and are connected by the main north-south corridor. Sherman is the county seat, while Denison is closer to Lake Texoma and the Oklahoma side. On the ranked city map they are shown as the first- and second-ranked cities.
Which map is best for Lake Texoma, the Red River, and local creeks?
Start with the water and terrain map. It emphasizes the large northern reservoir shoreline and the Red River, and it also labels smaller features such as Brushy Creek, Deaver Creek, Iron Ore Creek, Choctaw Creek, Mill Creek, Waterloo Lake, Loy Lake, and the East Fork Trinity River. Use the general county map afterward if you need to relate those water features to roads and towns.
What is included in the downloadable Grayson County ZIP?
The ZIP contains four high-resolution JPG files: the general county map, ranked city map, water and terrain map, and elevation map. Each JPG is 2572 × 3638 pixels. The files are separate, so you can print or use only the map that fits your task instead of working from one combined image.
Map File Information
The ZIP contains four high-resolution A3 JPG files covering the county map, ranked city distribution, water and terrain, and elevation. These files are larger than the on-page WebP previews and are suitable for printing, classroom use, local reference, and side-by-side map study.
- File Type: ZIP containing 4 JPG files
Related Maps
- Rockwall County Texas map
- Wise County Texas map
- Tarrant County Texas map
- Rains County Texas map
- Van Zandt County Texas map
Sources and References
The article description is based primarily on the supplied Grayson County map images and their legends. The official resources below are useful for checking county information, Lake Texoma, administrative boundaries, hydrography, and elevation data.
- Grayson County Texas official website – county government information and North Texas location
- U.S. Army Corps of Engineers – Lake Texoma – official lake information, maps, management, and recreation resources
- U.S. Census Bureau TIGER/Line Shapefiles – county boundaries and geographic line data
- USGS National Hydrography – official river, stream, and waterbody information
- USGS 3D Elevation Program – national elevation data and program information
Green Map creates custom-edited map images using open geographic data sources such as geoBoundaries, Natural Earth, OpenStreetMap, and government open data.
These maps are edited visual materials, not raw data files, and are provided for education, documents, presentations, and graphic reference.