Gonzales County lies in south-central Texas between the Austin, San Antonio, and Victoria regions, with the city of Gonzales serving as the county seat and the clearest reference point on the map. The county is especially easy to understand when its roads, communities, and rivers are viewed together: Interstate 10 crosses the north, Gonzales sits near the meeting of the San Marcos and Guadalupe rivers, and smaller communities spread toward the north and southwest. The map files shown on this page can also be downloaded as high-resolution JPG images in one ZIP archive.
Rather than treating the county boundary as the main story, it helps to begin with Gonzales and work outward. Waelder and Harwood sit north of the county seat, while Nixon and Smiley form a separate cluster in the southwest. The Guadalupe River then runs through the middle of the county and continues southeast after meeting the San Marcos River near Gonzales. That arrangement creates a useful framework for comparing the road map, city-connections map, water map, and elevation map without turning the page into a simple list of map types.
The four downloadable maps emphasize different details. The general county map combines roads, communities, nearby places, streams, and the county outline. The city map strips away much of that detail so the direction and straight-line distance from Gonzales to selected communities are easier to compare. The water map brings the rivers, creeks, and named lakes forward, while the elevation map shows how low river corridors are set between higher rolling ground around parts of the county.
Table of Contents
Gonzales as the center of a road network that changes north to south
The county map makes Gonzales the natural starting point. Several major roads meet around the city, and a dense network of small waterways surrounds the central part of the county. Harwood appears to the north, Waelder farther northeast, and Nixon and Smiley near the southwestern side. Once those places are located, the rest of the map becomes much easier to follow because the main travel directions are tied to recognizable communities instead of abstract boundary lines.
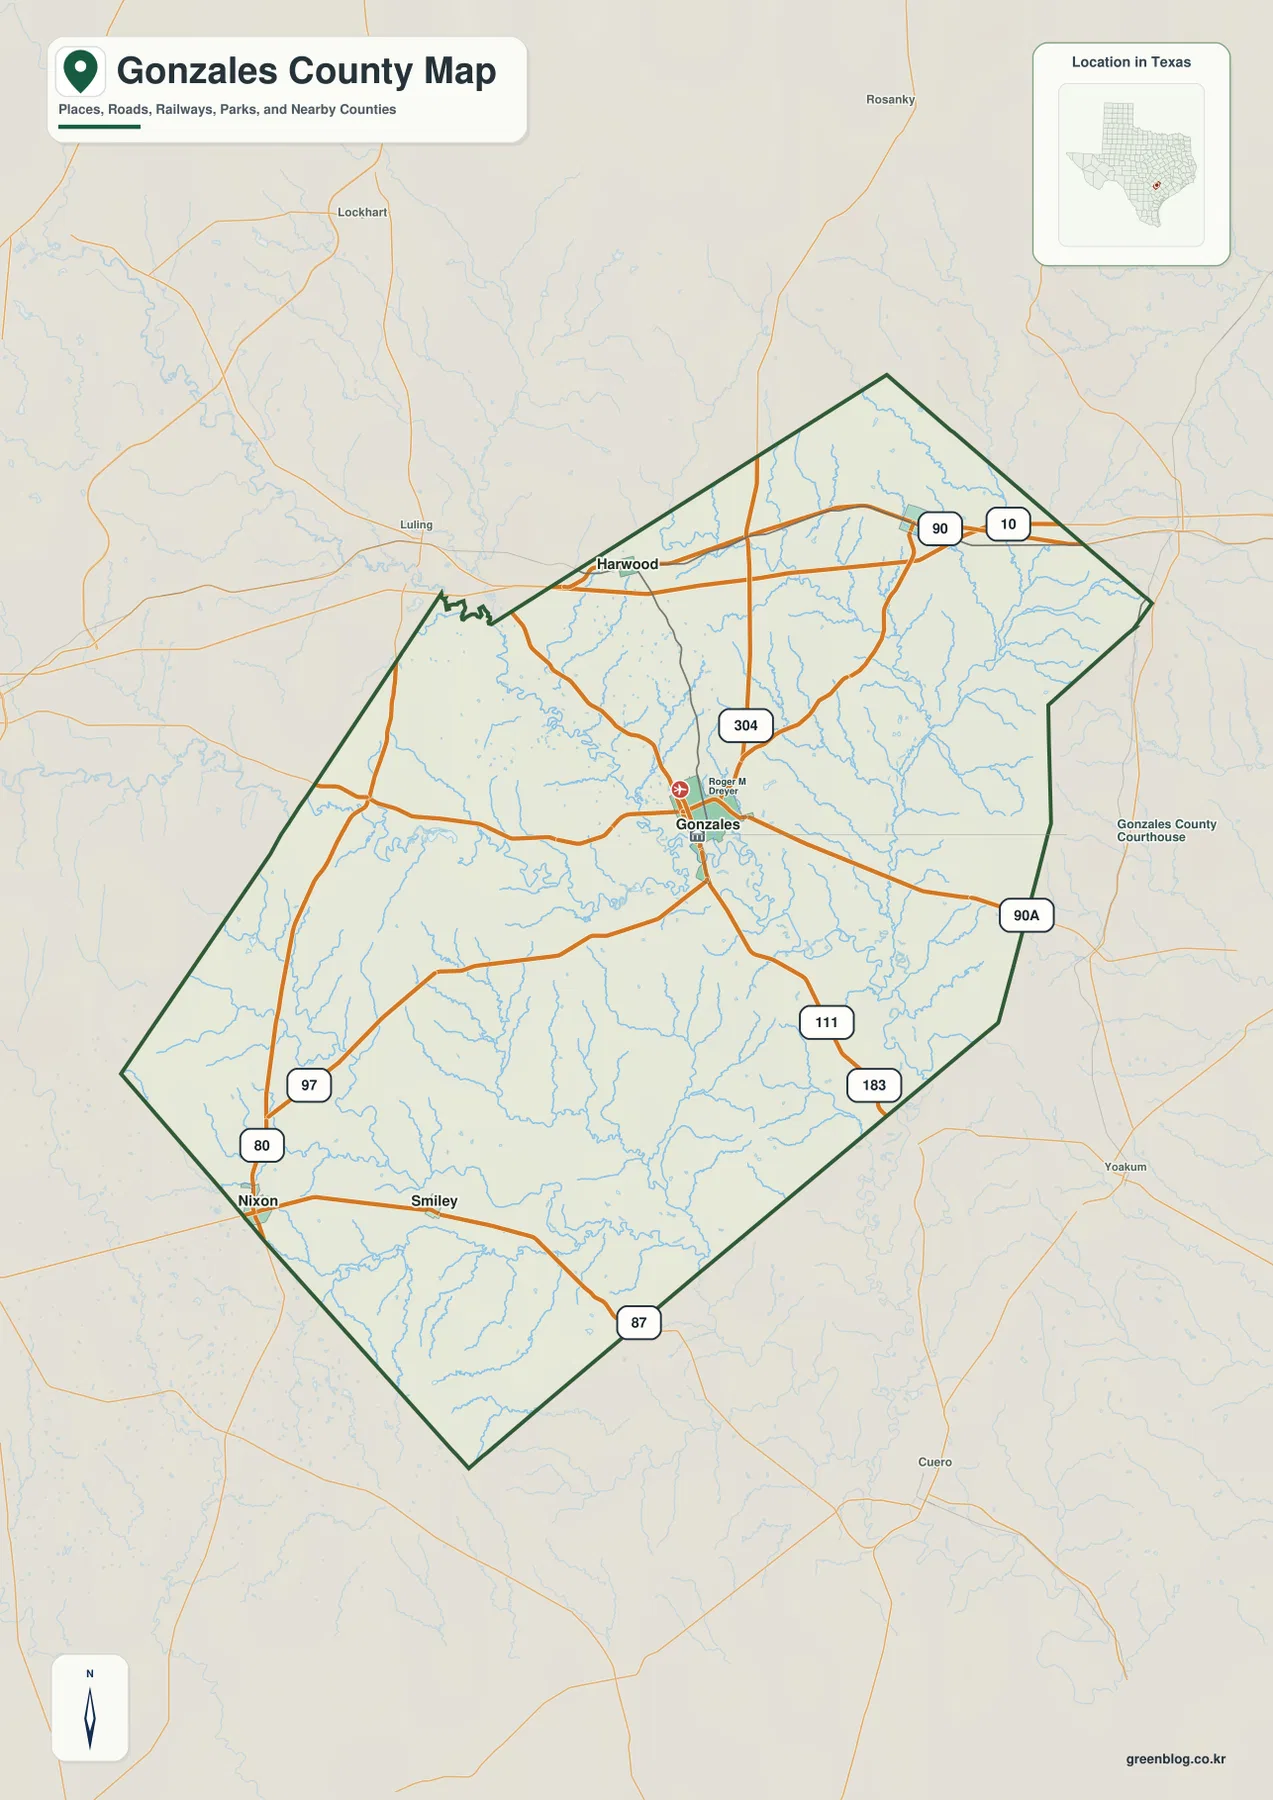
Interstate 10 and U.S. 90 form the strongest east-west route across the northern part of the map, close to Harwood and Waelder. Gonzales is connected to that northern corridor by the route marked 304, while U.S. 90 Alternate crosses the central area and continues east. Other numbered roads extend toward the southwest and south, including the routes marked 97, 80, and 87, with 111 and 183 visible southeast of Gonzales. This is not a turn-by-turn driving map, but it clearly shows which parts of the county rely on the I-10 corridor and which are oriented toward Gonzales or the southern communities.
Gonzales County borders Caldwell County to the north, Fayette County to the northeast, Lavaca County to the east, DeWitt County to the south, Karnes County to the southwest, Wilson County to the west, and Guadalupe County to the northwest. Those neighboring counties matter because the numbered highways continue well beyond the local boundary. The county therefore works as part of a larger inland network between Central and South Texas rather than as an isolated block on the map.
The northern edge also looks different from the central and southwestern sections. I-10 gives Waelder and Harwood quick access to a major east-west highway, whereas Nixon and Smiley are separated from that corridor by a much larger rural area. Gonzales sits between these two patterns. For a reader trying to understand where services, through traffic, and local travel are likely to concentrate, that three-part arrangement is more useful than memorizing every small road.
Waelder and Harwood to the north, Nixon and Smiley to the southwest
The city-connections map focuses on five named places: Gonzales, Nixon, Waelder, Smiley, and Harwood. Gonzales is the hub, and the map places the other communities around it without the distraction of the full road network. Waelder lies to the northeast, Harwood to the northwest, and Nixon and Smiley sit close to one another in the southwestern part of the county. This arrangement is useful when a visitor knows a town name but is unsure which side of the county to search first.
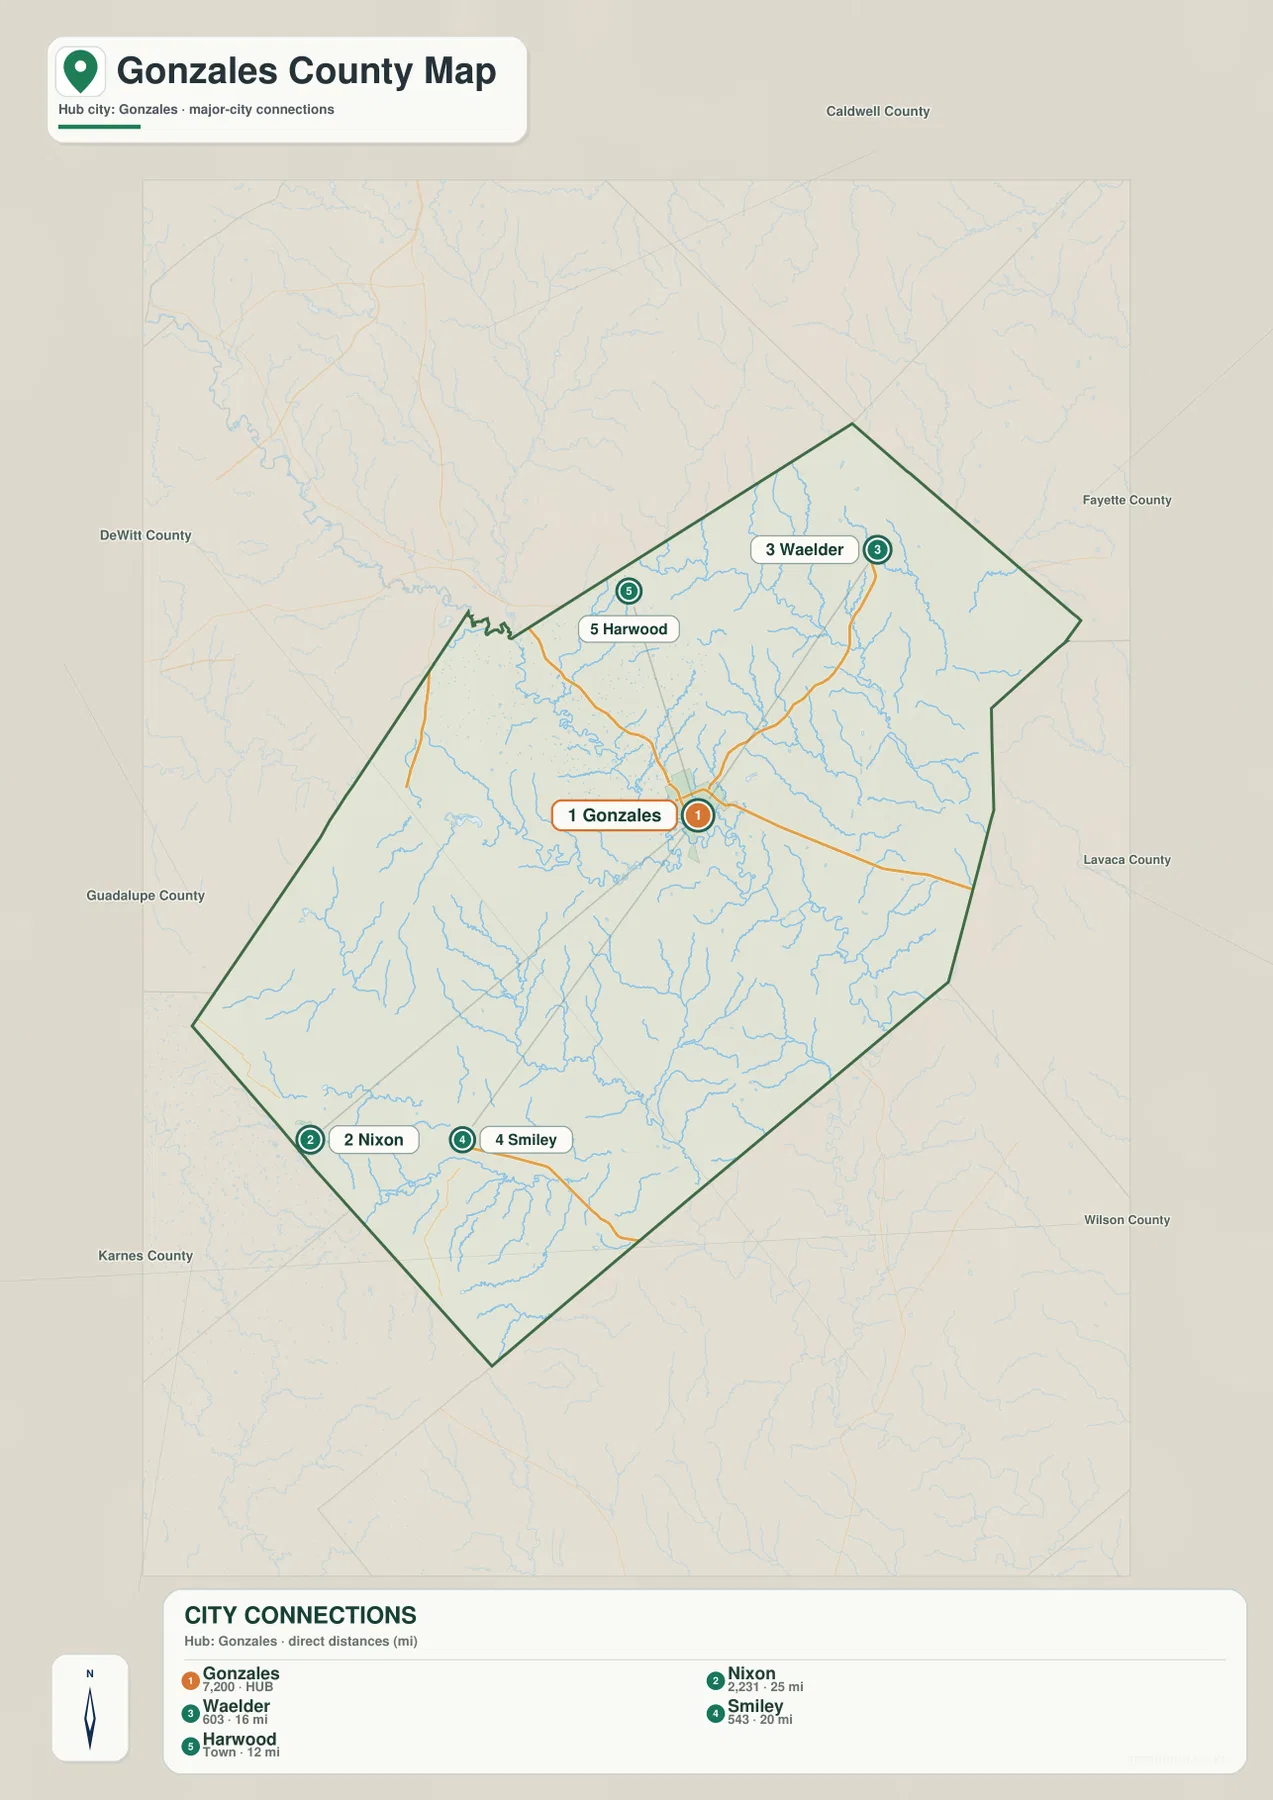
The distance labels are straight-line distances, not driving distances. On the map, Harwood is about 12 miles from Gonzales, Waelder about 16 miles, Smiley about 20 miles, and Nixon about 25 miles. A road trip between the same places can be longer because roads do not follow a perfect straight line, so these numbers are best used for orientation. They answer a simpler question: which communities are relatively close to the county seat, and in what direction do they lie?
The map also shows why Gonzales is such a practical reference point for the county. It is not located at one extreme edge; instead, the selected northern and southwestern communities spread out from it in different directions. For local research, the map can help separate questions about the I-10 side of the county from questions about the Nixon-Smiley area. For printing or classroom use, it provides a cleaner view of settlement spacing than the road-heavy county map.
Gonzales itself has a long historical role that adds meaning to its central position. The Handbook of Texas identifies Gonzales as the county seat and notes its location near the confluence of the Guadalupe and San Marcos rivers. The city is also closely associated with the opening events of the Texas Revolution. Those historical facts are not required to read the map, but they explain why the name Gonzales appears so prominently in both county geography and Texas history.
The San Marcos joins the Guadalupe near Gonzales, then the river corridor turns southeast
The water map changes the emphasis completely. The San Marcos River enters from the northwest and reaches the central part of the county near Gonzales, where it joins the Guadalupe River. From there, the Guadalupe continues toward the southeast, accompanied by a branching network of creeks and smaller drainage lines. This relationship is one of the most county-specific features on the entire map set because the city of Gonzales and the two major rivers are concentrated in the same central area.
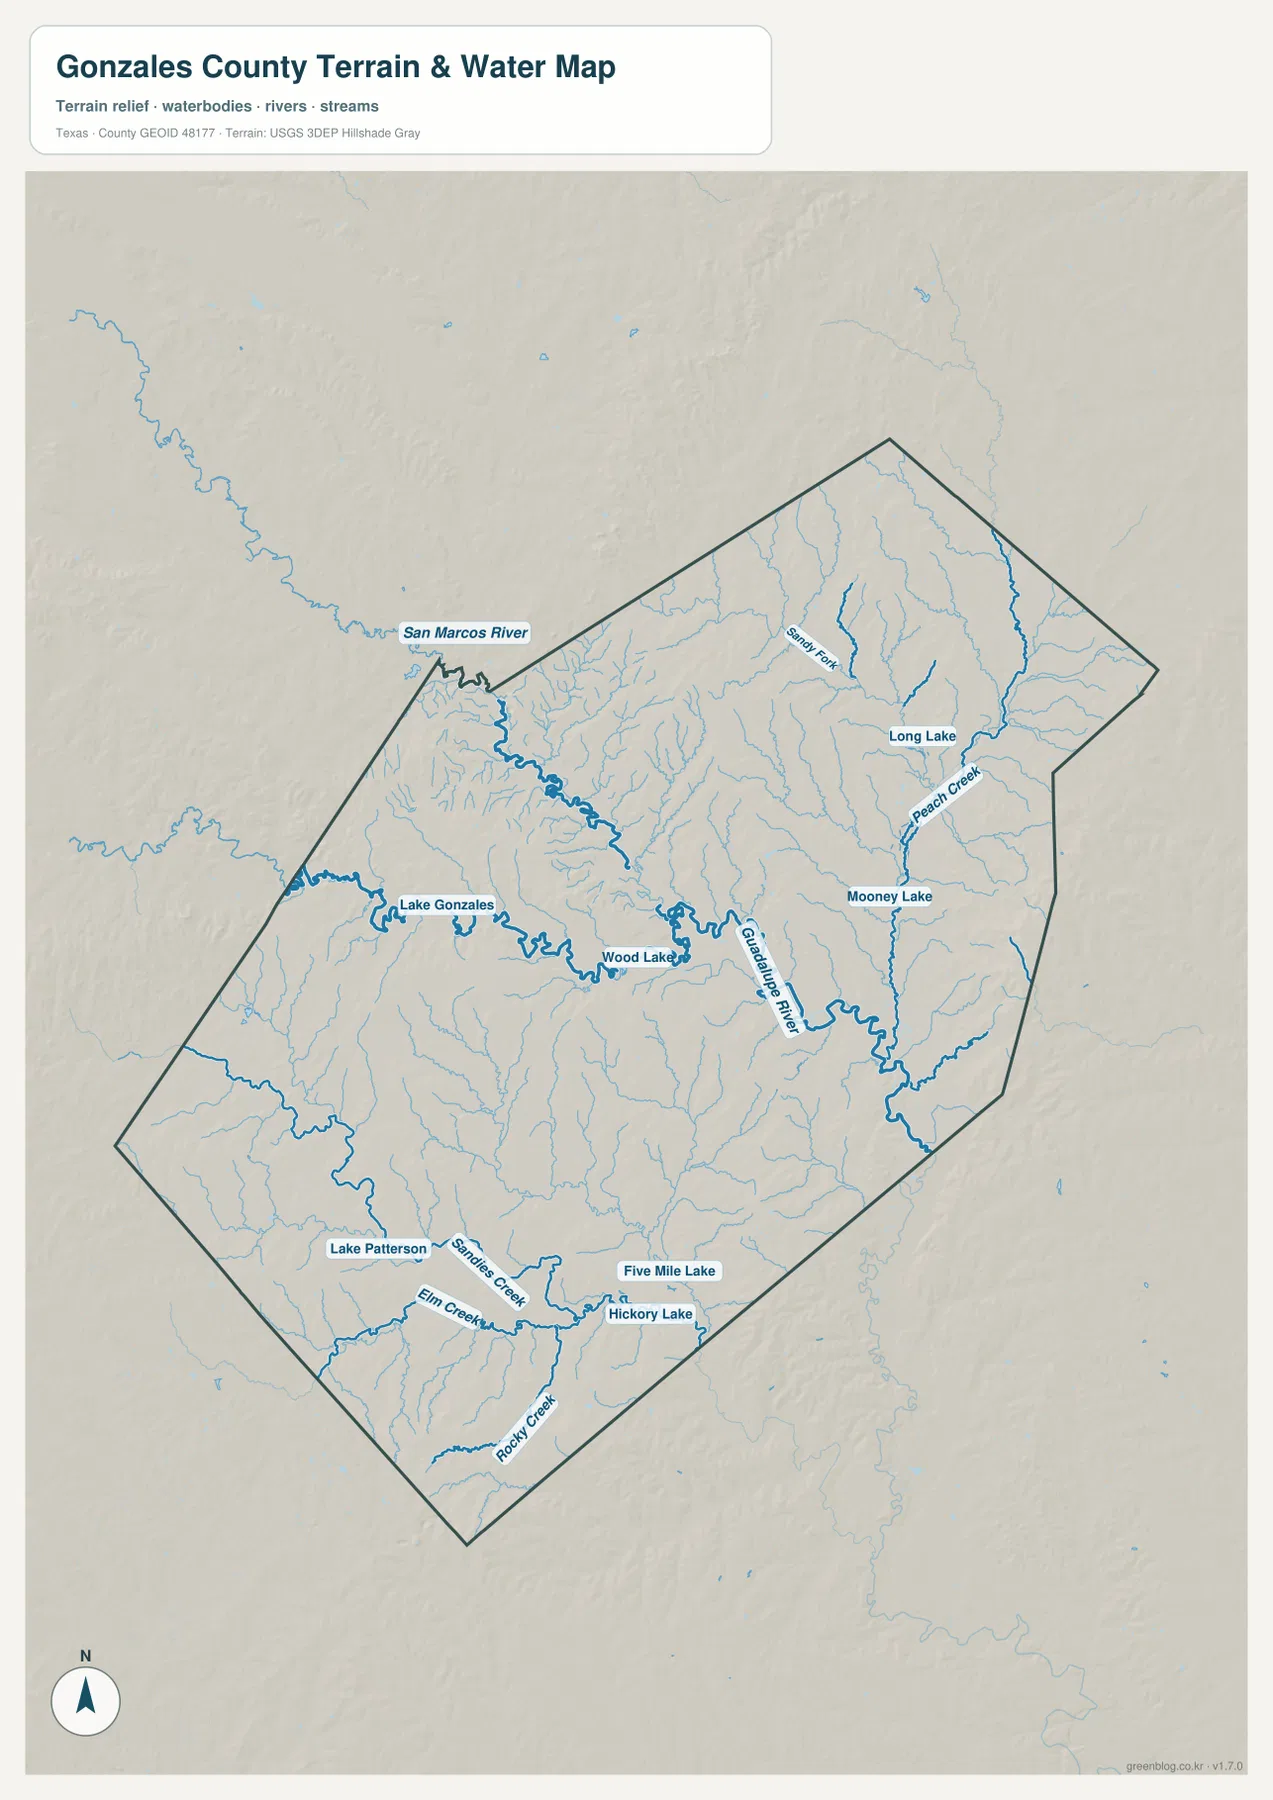
Several named water features become much easier to find on this version. Lake Gonzales and Wood Lake lie along the main river system, while Lake Patterson, Five Mile Lake, and Hickory Lake appear farther south. Sandy Fork and Peach Creek are labeled in the northeastern half, and Sandies Creek, Elm Creek, and Rocky Creek appear in the southern part of the county. Long Lake and Mooney Lake provide additional reference points east of the central river corridor.
These features help explain why the county map contains so many blue lines even away from the two main rivers. Small creeks collect water from rolling ground and feed larger channels, so the river system is a network rather than a pair of isolated blue lines. Comparing the water map with the county map also makes it easier to see where roads cross stream valleys and where the central settlement area sits next to major watercourses.
The map is intended as a geographic water reference, not as a flood-risk, property-boundary, or navigation product. Conditions along rivers can change, and access may cross private land. For an example of a public landscape tied directly to this water system, Palmetto State Park lies on the San Marcos River in Gonzales County. Texas Parks and Wildlife describes the park as containing the flowing river, an oxbow lake, an artesian well, and wetland environments, which makes it a useful real-world reference for the water-rich northwestern side of the county.
Low river valleys stand out against higher rolling ground
The elevation map removes place labels and road shields so the shape of the land becomes the main subject. Its legend gives an actual mapped range of about 59 to 179 meters, with a mean near 104 meters. Lower areas are shown in green, while progressively higher ground shifts through lighter tones toward brown. The result is not a flat-looking county: ridges and shallow valleys repeat across the interior, and the lowest broad corridor follows the river system through the central and southeastern area.
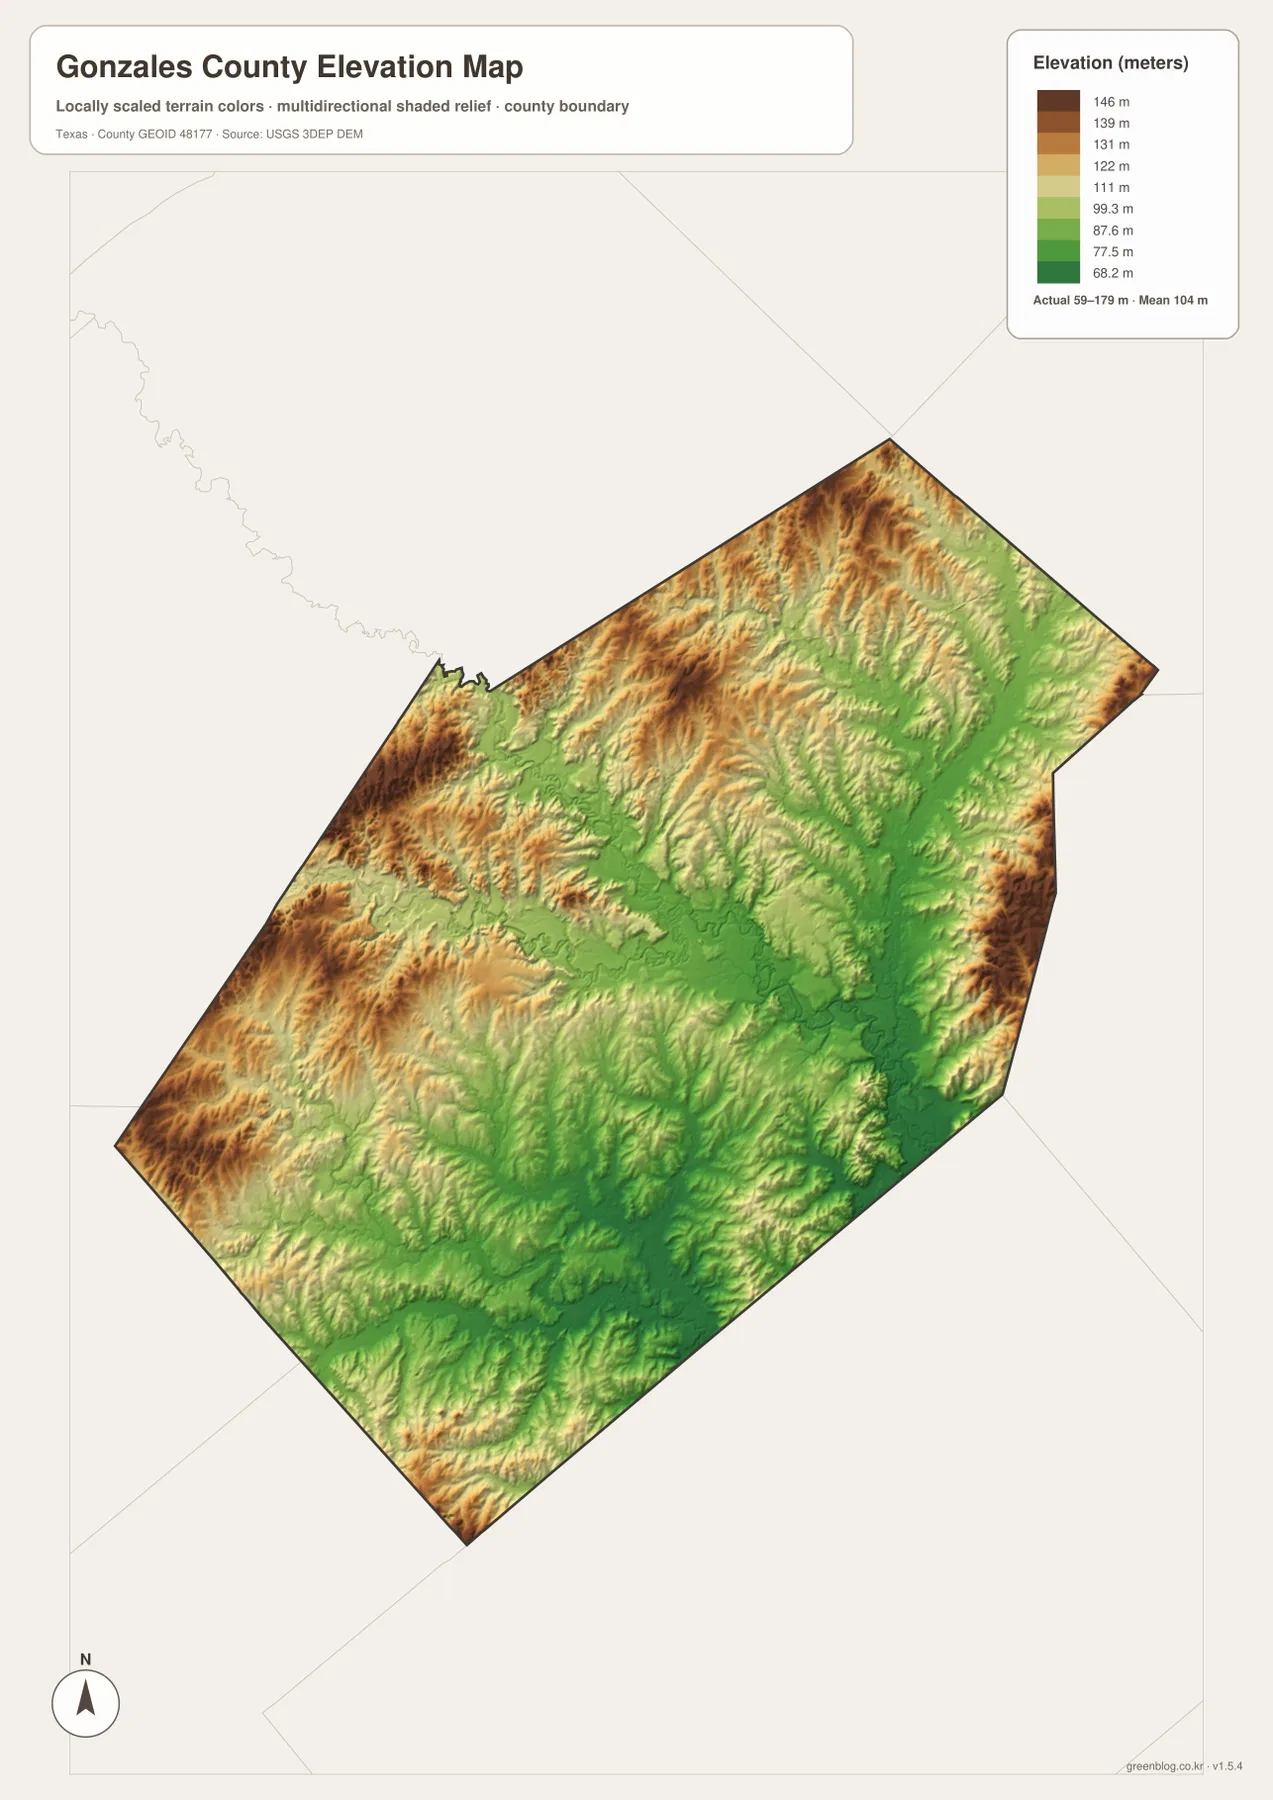
The broad green area near the center and southeast corresponds closely with the Guadalupe River corridor shown on the water map. Higher and more textured ground is especially noticeable toward the northern and western sides and along parts of the eastern edge. The shaded relief also reveals many narrow tributary valleys cutting into those higher surfaces. Viewing the two maps together is useful because the water map names the channels while the elevation map shows the landform those channels occupy.
This elevation layer is a generalized terrain surface based on USGS 3D Elevation Program data. It should not be treated as a survey-grade measurement for a particular parcel, building site, drainage project, or engineering decision. Its strength is regional comparison: readers can see where the county is lower, where rolling ridges are more common, and why the main river corridor forms such a strong visual feature through the center of the county.
The terrain also helps connect the map to the county’s broader landscape. The Handbook of Texas describes Gonzales County as a meeting area of several land-resource regions and notes substantial variation in soils, vegetation, and geology. The elevation map does not classify those soils or vegetation types, but its mix of ridges, valleys, and lower river land is consistent with a county that changes noticeably from one part to another rather than presenting one uniform surface.
Choosing the map that fits roads, communities, water, or terrain
For basic orientation, start with the general county map. It is the best choice when the question involves a road, a town, the county outline, or the direction toward nearby places such as Luling, Lockhart, Yoakum, or Cuero. If the goal is simply to compare where Waelder, Harwood, Nixon, and Smiley sit relative to Gonzales, the city-connections map is less cluttered and gives a quick distance reference without requiring the reader to trace every highway.
Use the water map when a river, creek, lake, or river-side location is the main concern. It is especially useful around Gonzales because the San Marcos and Guadalupe rivers meet nearby and because several named lakes and tributaries are otherwise easy to miss. The elevation map is the better companion when the question changes from “where is the water?” to “how does the land rise away from the water?” Together they show that the county’s central river corridor is generally lower than many surrounding ridges.
For printed material, keeping each map as a separate file avoids squeezing several kinds of information onto one page. A road-focused handout can use the county map, a lesson about community distribution can use the city map, and a physical-geography comparison can pair the water and elevation versions. The WebP images in the article are optimized for on-screen viewing; the ZIP below contains four matching high-resolution JPG files that are more suitable when a larger image or print copy is needed.
Frequently Asked Questions
Why are the San Marcos and Guadalupe rivers so important on a Gonzales County map?
The San Marcos River reaches the central county and joins the Guadalupe River near Gonzales. That puts the county seat next to the most prominent river junction in the map set, so locating the two rivers helps explain both the city’s position and the broad low corridor visible on the elevation map.
Are the distances on the city-connections map driving distances?
No. The labels show straight-line distance from Gonzales to the selected communities. The actual road distance can be longer because highways and local roads curve, cross rivers, and may approach a town from a different direction. Use the values for orientation, then check current routing information for travel planning.
What is the most noticeable feature on the Gonzales County elevation map?
The strongest contrast is between the lower green river corridor through the central and southeastern county and the higher, more strongly textured ridges around parts of the north, west, and outer edges. The map’s displayed range is about 59 to 179 meters, but it is intended for regional terrain comparison rather than parcel-level surveying.
Map File Information
Download the Gonzales County road and place map, city-connections map, water map, and elevation map as high-resolution A3 JPG files in one ZIP archive.
- File Type: ZIP containing 4 JPG files
Related Maps
- Wilson County Texas map
- Bastrop County Texas map
- Travis County Texas map
- Victoria County Texas map
- Austin County Texas map
Sources and References
- Gonzales County, Texas official website — county government and local information
- Handbook of Texas: Gonzales County — county geography, history, communities, and river background
- Texas Parks & Wildlife Department: Palmetto State Park — San Marcos River and park landscape information
- U.S. Census Bureau QuickFacts: Gonzales County — county statistics
- USGS National Hydrography — river and stream data information
- USGS 3D Elevation Program — elevation data information
Green Map creates custom-edited map images using open geographic data sources such as geoBoundaries, Natural Earth, OpenStreetMap, and government open data.
These maps are edited visual materials, not raw data files, and are provided for education, documents, presentations, and graphic reference.