A Rains County Map makes the county’s layout easy to understand because its main places, roads, and large bodies of water sit close together. Emory is the central road hub, Point is northwest of it, and East Tawakoni lies on the western side near Lake Tawakoni. Water is a strong part of the county’s geography: the Sabine River system is prominent on the west, while the Lake Fork side and its tributaries shape the east and northeast. Those features give a small county a surprisingly detailed map.
This page brings together the county reference map, a city-connections view, a terrain-and-water map, and an elevation map. They can be used on screen to compare communities, highways, creeks, lakes, and relief. A ZIP containing four high-resolution A3 JPG files is also available in the map file box below, so visitors who need larger images for printing, classroom use, or editing do not have to rely on the smaller web previews.
Table of Contents
Emory sits where the county’s main road directions meet
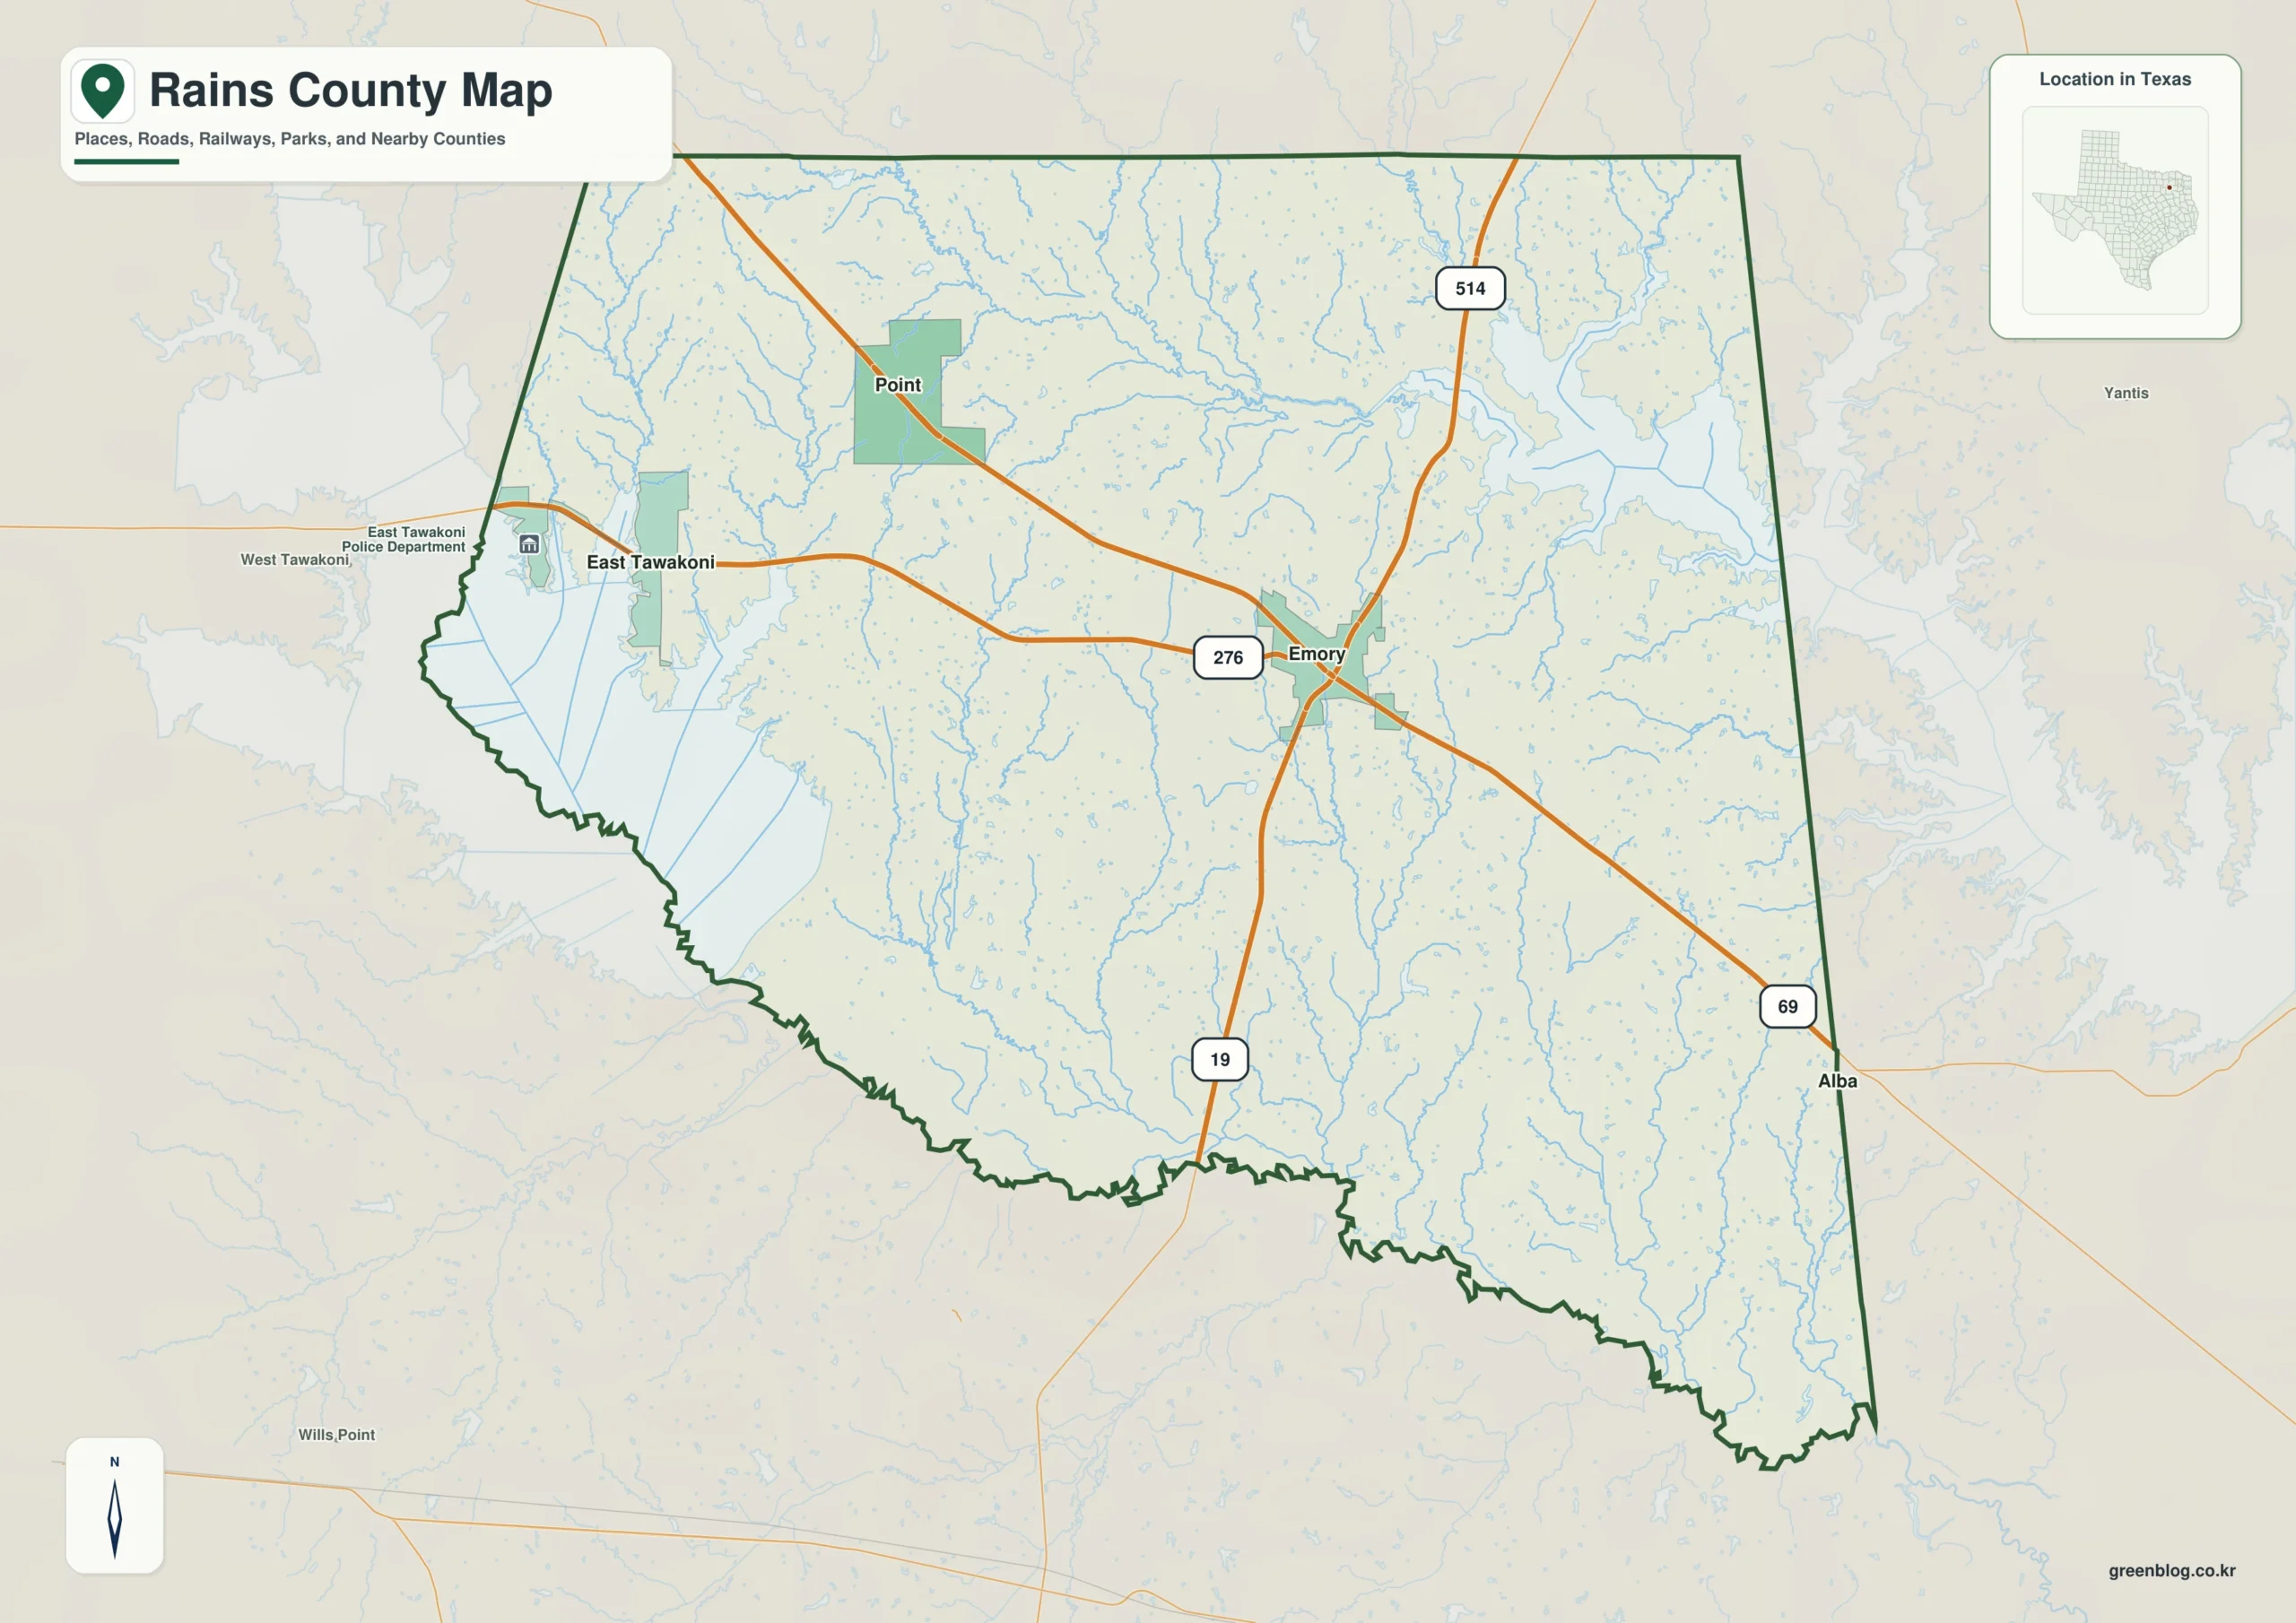
The county reference map places Emory slightly east of the geographic center, at a point where several routes converge. U.S. 69 runs through the Emory area on a northwest-to-southeast line, linking the direction of Point with the route toward Alba beyond the eastern side. State Highway 19 runs north and south through Emory, while Highway 276 reaches west toward East Tawakoni and the Lake Tawakoni shore. Route 514 is visible north of Emory. Together, these roads make Emory the easiest starting point for understanding the rest of the map.

The western edge looks different from the more regular northern and eastern boundaries because the Lake Tawakoni side is cut by broad water and shoreline. East Tawakoni is positioned against that western lake margin. Point sits farther north and inland, while Emory occupies the interior between the Lake Tawakoni side and the waters associated with Lake Fork to the east. This relationship is useful when a map reader wants to separate shoreline communities from the county’s interior road network.
Emory, Point, and East Tawakoni form a compact three-place pattern
The city-connections map simplifies the road detail and emphasizes the relative positions of the three mapped places. Emory is marked as the hub. Point is shown about 7 miles to the northwest, while East Tawakoni is about 9 miles to the west. Those distances are short enough that the three places appear as one compact cluster, but their directions are distinct: Point follows the northwest route, whereas East Tawakoni pulls toward the Lake Tawakoni shore.

The same preview also labels Hunt County to the northwestern side, Hopkins County to the north, Wood County to the east, and Van Zandt County to the west. Those surrounding labels make the county easier to orient without adding a dense regional road network. For someone comparing neighboring counties, the view gives a quick sense of where Rains County sits relative to larger surrounding areas while keeping Emory and its two nearby communities as the focus.
The Sabine side and Lake Fork side are connected by many smaller waterways
Water becomes the dominant feature on the terrain-and-water map. On the west, the Sabine River enters the broad Lake Tawakoni area, where Wichita Bay and Waco Bay are labeled outside and beside the county edge. The large water surface explains why the western boundary is irregular and why East Tawakoni is closely associated with the lakeshore. Rather than treating the lake as a background feature, this map shows how strongly it shapes the western side of the county.

Across the northern and eastern half, Lake Fork Creek is one of the clearest named channels and runs toward the large water body on the east. Smaller streams extend through the interior, including Shilling Creek, Rocker Creek, Burns Creek, Snider Creek, and Frank Creek. The map also identifies Montgomery Lake, Highland Lake, Greenes Lake, and Cass Lake. These smaller waters are useful because they show that drainage inside Rains County is not limited to the two large reservoirs at its edges.
The pattern of tributaries is especially noticeable south of Emory’s general area. Narrow channels run through a series of shallow valleys and then join larger watercourses. When this map is compared with the road map, it becomes clear that transportation lines and drainage lines often cross the county in different directions. That distinction matters for readers who are trying to understand why a short straight-line distance between two places does not always correspond to a simple landscape.
A 101–174 meter elevation range reveals ridges and shallow valleys
The elevation map gives an actual range of about 101 to 174 meters, with a mean elevation of 135 meters. Those numbers are modest compared with mountainous parts of Texas, yet the shaded relief shows that Rains County is not a featureless flat surface. Higher ground is more common across the northwest and parts of the western interior, while lower areas follow the southern edge and many stream valleys. The effect is a repeating pattern of low ridges separated by narrow drainage corridors.

The lowest green tones line up with several of the same valleys seen on the water map. In contrast, the warmer brown and tan areas occupy higher ridges between those channels. This makes the elevation view particularly useful when read after the water map: the tributaries are easier to place within the surrounding terrain, and the county’s many small creeks no longer look like isolated blue lines. They follow the lower parts of a gently rolling landscape.
Choosing the map view that matches the question
For basic orientation, the county reference map is the best place to begin. It combines the boundary, Emory, Point, East Tawakoni, major roads, nearby places, and many streams without removing the broader geographic context. It works well for answering practical questions such as whether Point is north or west of Emory, which road runs toward East Tawakoni, or where U.S. 69 crosses the county.
The city-connections map is more useful when the goal is simply to compare communities. Its hub-and-distance design makes the Emory-to-Point and Emory-to-East-Tawakoni relationship obvious at a glance. The water map should be used when lakes, rivers, creek names, or shoreline shape are the main concern. Because it removes much of the road emphasis, smaller tributaries and local lakes are easier to follow from one side of the county to the other.
The elevation map adds the final layer by showing why the stream network has so many branching valleys. With a range of 101–174 meters, Rains County does not have dramatic mountain relief, but the shaded terrain reveals enough vertical difference to separate ridges from low drainage corridors. Using the water and elevation maps together is therefore more informative than relying on either one alone when the purpose is to understand physical geography rather than just place names.
Frequently Asked Questions
Where is Emory on the Rains County map?
Emory is slightly east of the county’s center and sits where several important road directions come together. U.S. 69 crosses the area, State Highway 19 runs north and south, and Highway 276 heads west toward East Tawakoni and the Lake Tawakoni side.
Which water features stand out in Rains County?
The western side is dominated by Lake Tawakoni and the Sabine River system, while the eastern side is influenced by Lake Fork and Lake Fork Creek. The water map also labels several smaller creeks and lakes within the county.
What elevation range is shown for Rains County?
The elevation map shows an actual range of approximately 101 to 174 meters and a mean of 135 meters. Higher ridges are most visible in the northwestern and western interior, while lower terrain follows many southern and stream-valley areas.
Map File Information
The ZIP contains high-resolution A3 JPG versions of the Rains County reference map, city map, terrain-and-water map, and elevation map. Use these larger files when the web previews are not sufficient for printing or editing.
- Included Files: County map, city map, water map, elevation map
Related Maps
Map data and reference sources
Readers who want to check the underlying types of public geographic data can use the U.S. Census Bureau TIGER/Line Shapefiles for boundaries and transportation features, USGS National Hydrography for rivers, streams, and water features, and the USGS 3D Elevation Program for elevation data.
Green Map creates custom-edited map images using open geographic data sources such as geoBoundaries, Natural Earth, OpenStreetMap, and government open data.
These maps are edited visual materials, not raw data files, and are provided for education, documents, presentations, and graphic reference.