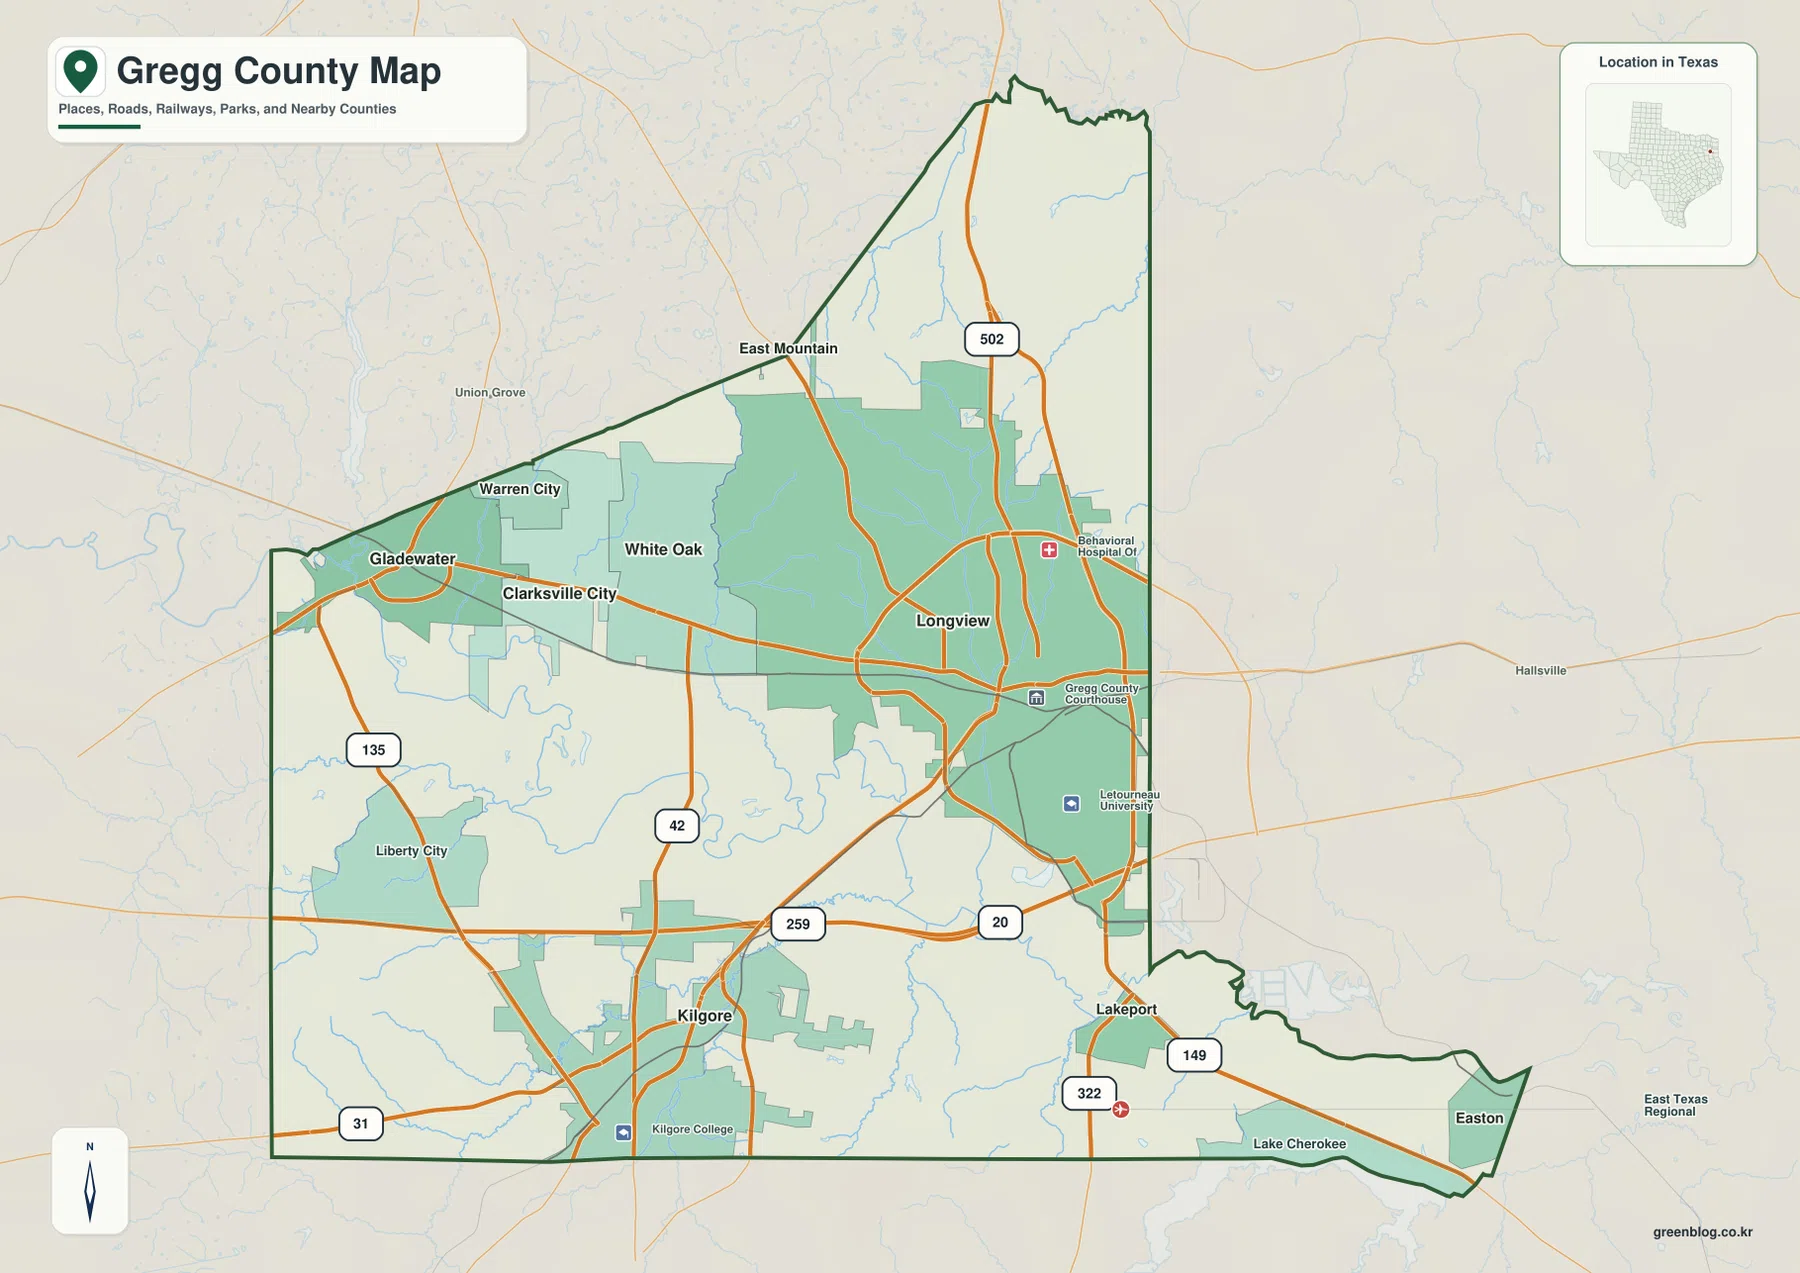
Gregg County is a compact East Texas county where Longview, Kilgore, White Oak, Gladewater, and several smaller communities sit close enough to compare on one county-scale map. The maps on this page show more than municipal labels: they also include major road routes, the county outline, the Sabine River and named creeks and lakes, plus a locally scaled elevation view. High-resolution JPG versions of all four map types are available in a ZIP download farther down the page.
The county’s shape makes orientation important. Longview sits in the eastern half, Kilgore is farther south, and Gladewater is near the western side, while a narrow northern extension reaches well beyond the main east-west cluster of cities. Reading the road map first gives a practical frame for the county; the water and elevation maps then show why the land does not look uniformly flat even though there are no dramatic mountains in the map.
The package contains a county map, a ranked city map, a terrain-and-water map, and an elevation map. Because all four use the same Gregg County boundary, a place found on one image can be checked against the others without changing geographic scale. The descriptions below stay with names, route numbers, waterways, and elevation values that are visible in the supplied maps.
Table of Contents
Use Longview and the main roads as the first reference points
Longview is the easiest place to locate on the general county map. The Gregg County Courthouse is marked there, and LeTourneau University appears just to the southeast. From Longview, the urban pattern extends west through White Oak and Clarksville City toward Gladewater, while Kilgore forms a separate southern center. Warren City and East Mountain are shown in the northwest and north, Liberty City is in the southwest, and Lakeport and Easton sit toward the southeastern edge.
Several numbered routes make the relationships between these places clear. The map labels 20 across the southern part of the county and 259 on the north-south connection between the Longview area and Kilgore. Routes 42, 135, and 31 help define the western and southern side, while 149 and 322 are useful around Lakeport and the southeastern extension. Route 502 appears north of Longview. Instead of treating those numbers as a list to memorize, use them to see which communities share the same travel direction.
Features outside the county line also help with orientation. Union Grove is labeled to the west, Hallsville to the east, and Lake Cherokee appears near the lower-right side of the map. These labels make the boundary easier to interpret because the edge of the county is not the edge of the surrounding road network. Longview is relatively close to the eastern boundary, whereas Gladewater sits close to the western side, so cross-county connections are visible even at this scale.
The ranked city map separates the main centers from smaller communities
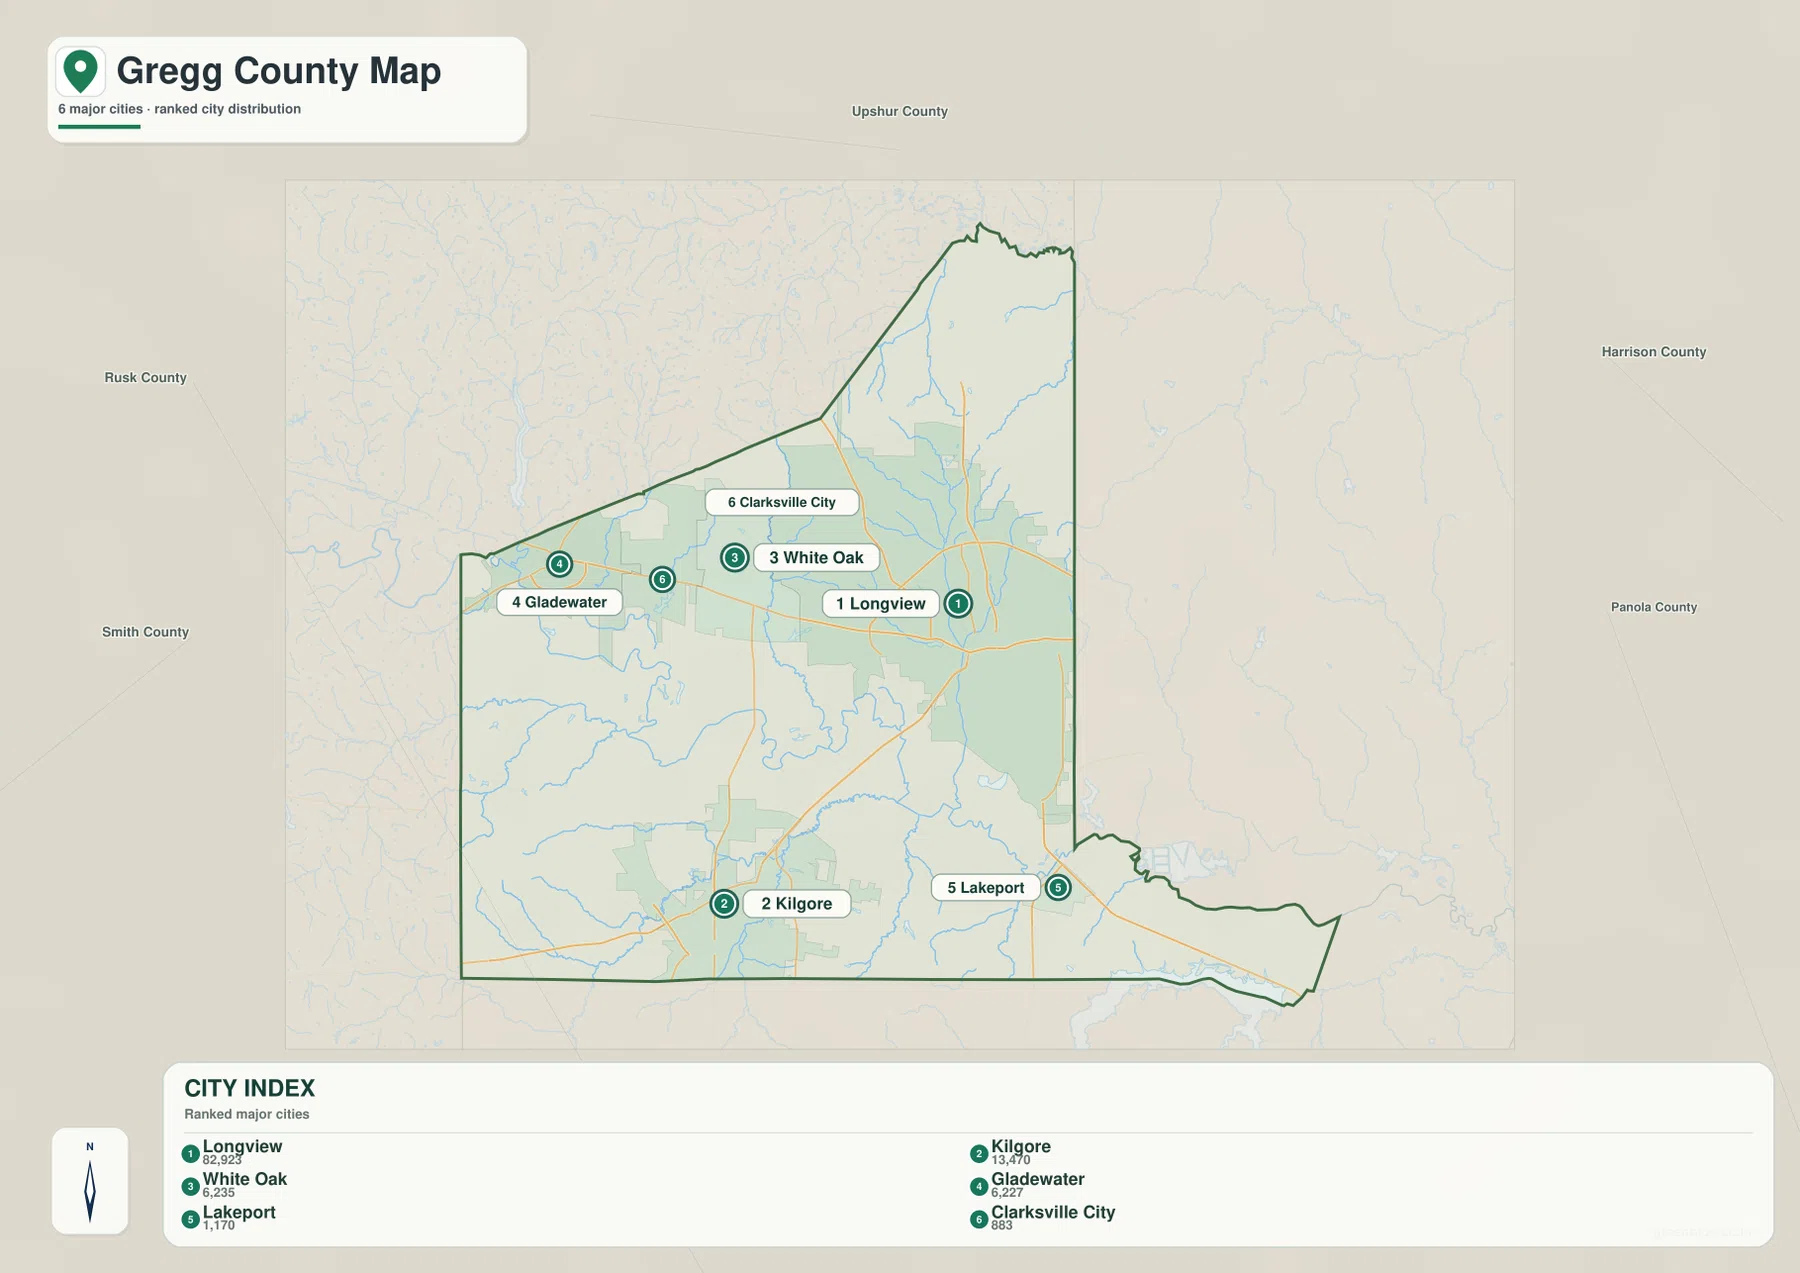
The city map ranks six places within Gregg County. Longview is marked first and Kilgore second, followed by White Oak, Gladewater, Lakeport, and Clarksville City. That ranking adds context that a plain place-name map cannot provide: the largest centers are immediately distinguishable from smaller communities, while their positions still remain visible inside the county outline.
The distribution is not centered on one point. Longview, White Oak, Clarksville City, and Gladewater form a relatively close east-west group across the middle of the county. Kilgore is farther south, and Lakeport is near the southeastern boundary. The northern extension has no ranked city marker, which makes the contrast between the more urbanized middle-southern area and the less densely labeled north easy to see without relying on a separate statistical table.
Neighboring counties are labeled around the city map: Upshur County to the north, Harrison County to the east, Panola County farther southeast, Rusk County to the south and southwest, and Smith County to the west. Those names are useful when a city is close to the edge of Gregg County. Gladewater, for example, is near the western side, while Longview is much closer to the eastern boundary. The map therefore works well for readers who want both an internal city hierarchy and a quick sense of which neighboring county lies beyond each edge.
Follow the Sabine River before tracing the smaller creeks
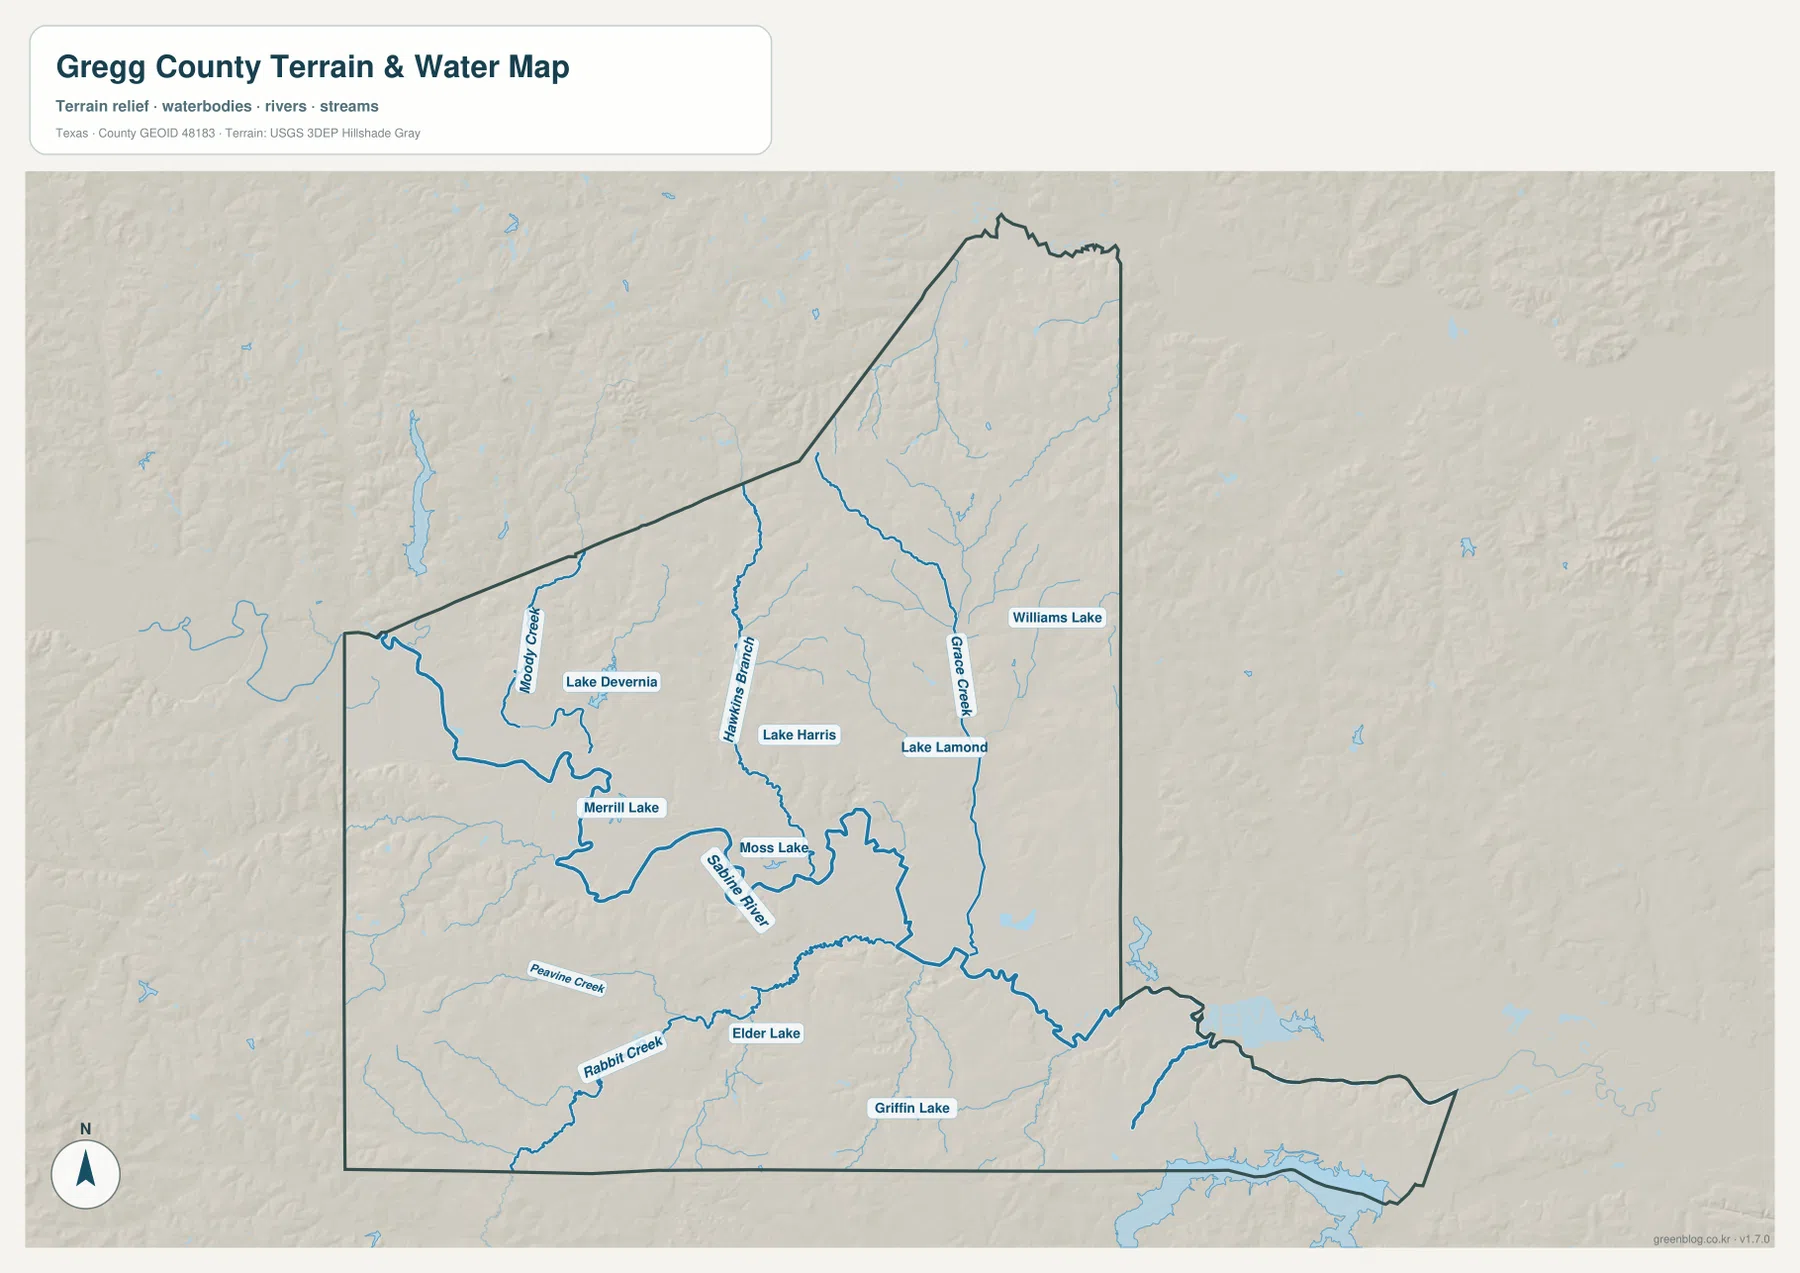
The terrain-and-water map has one especially strong reference feature: the Sabine River. It crosses the county below the middle from west toward east and is drawn more prominently than the smaller streams that feed into the local drainage network. Once the Sabine is located, several named tributary areas become easier to place. Moody Creek is labeled in the northwest, Hawkins Branch near the north-central area, and Grace Creek farther east.
The map also names a series of small lakes. Lake Devernia lies toward the northwest, Lake Harris and Moss Lake are nearer the center, and Merrill Lake is west of the central river corridor. Lake Lamond and Williams Lake appear in the eastern and northeastern portion, while Elder Lake and Griffin Lake are shown in the south. Peavine Creek and Rabbit Creek add more detail to the southwestern side. These features are useful because they turn a broad county outline into a recognizable network of individual water features.
For practical map reading, it is usually better to start with the Sabine River and then work outward rather than trying to identify every creek at once. Compare the river with Longview and Kilgore on the general map, then note which smaller streams occupy the space between the cities and the county boundary. This approach makes the water map useful for local geography lessons, trip planning around named water features, or simply understanding why the county contains many narrow valleys instead of one uniform surface.
Elevation ranges from about 70 to 165 meters
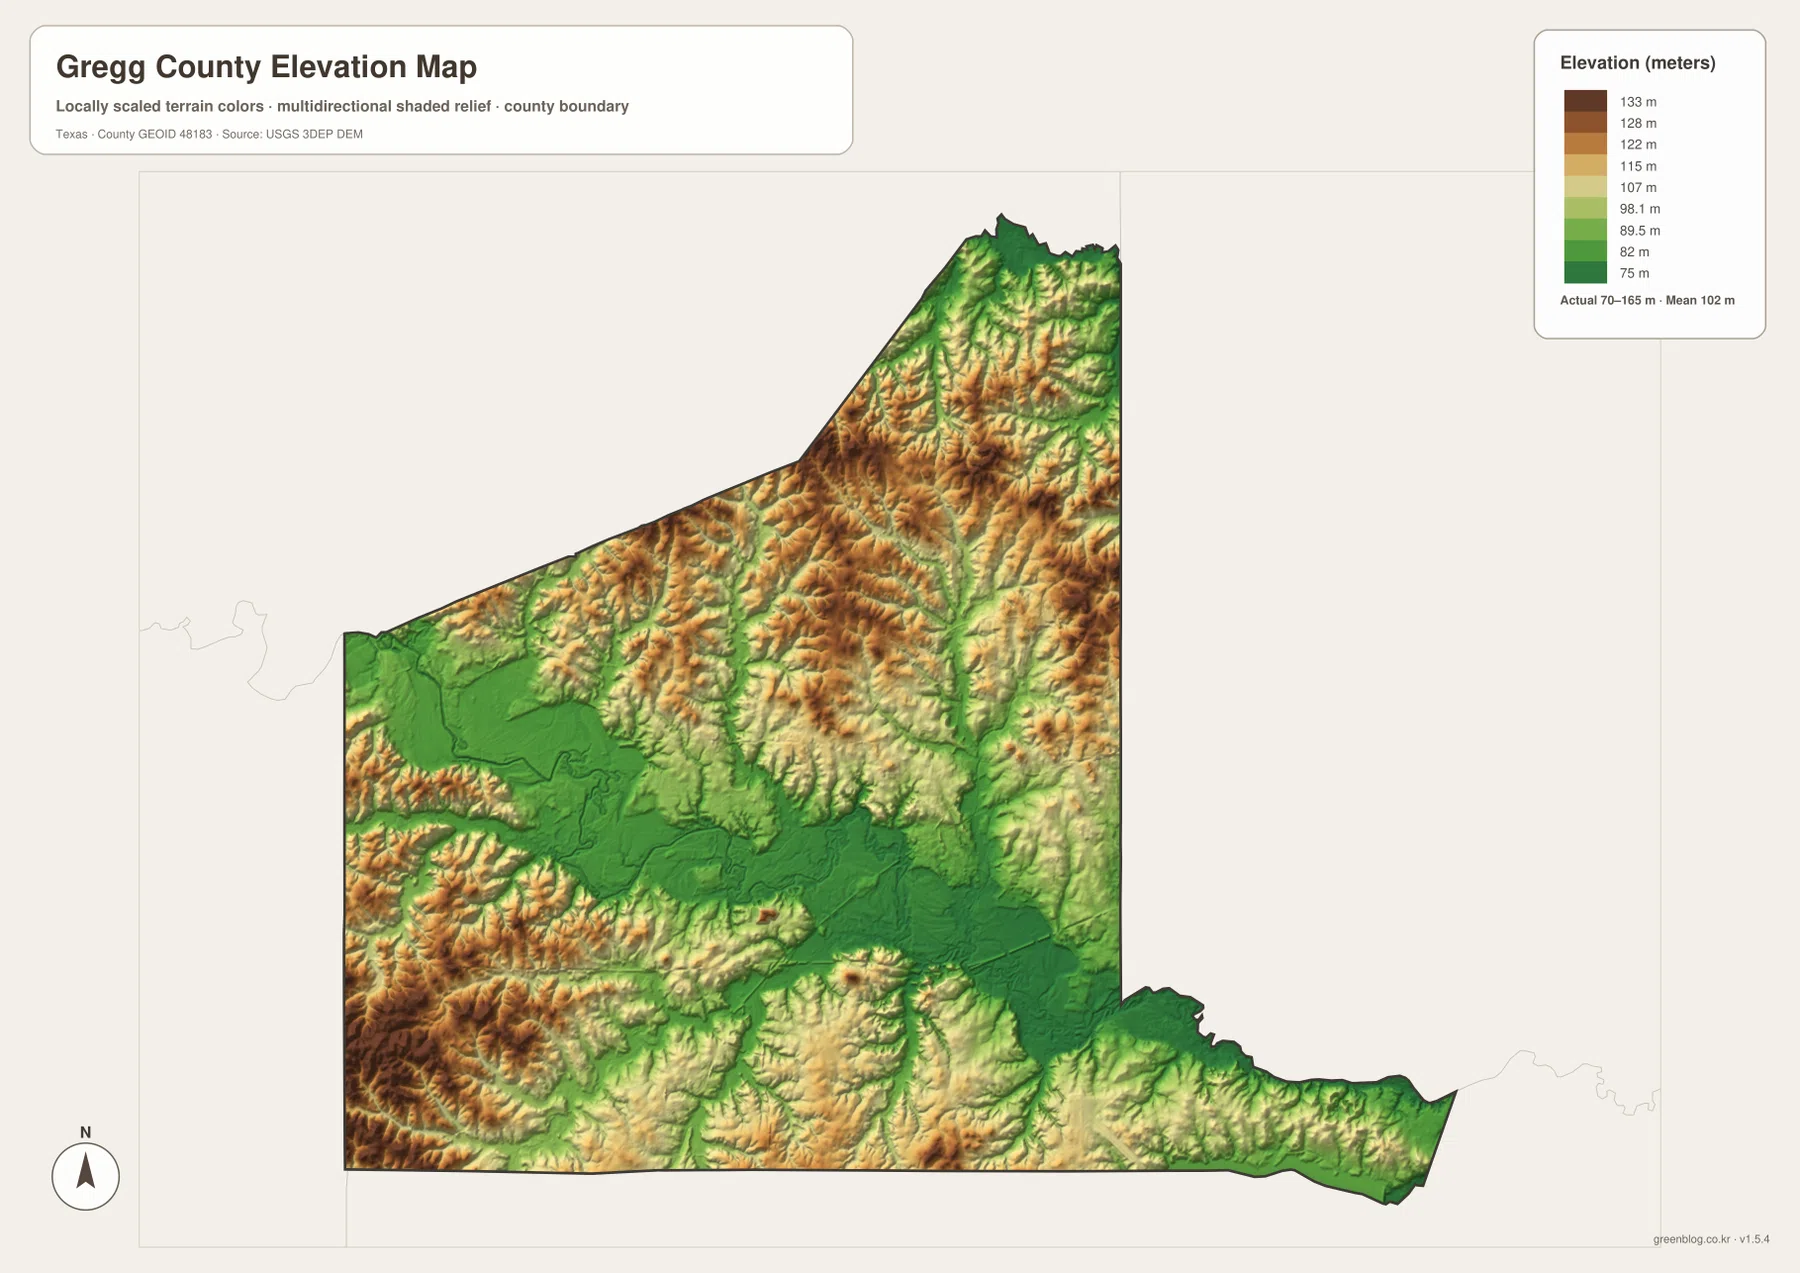
The elevation map gives an actual county range of about 70 to 165 meters and a mean elevation of about 102 meters. Greens indicate the lower parts of the locally scaled surface, while yellow, tan, and brown show progressively higher ground. The strongest low corridor runs across the middle-lower portion of the county and lines up well with the Sabine River area shown on the water map.
Higher ridges appear as broken bands rather than as one large upland block. The southwest has several pronounced higher ridges, and the north-central part also shows many narrow rises divided by green stream valleys. In the long northern extension, the surface is similarly dissected, with lower drainage lines cutting between higher slopes. The southeastern tail stays relatively low overall but still contains small ridges and channels.
This map is most informative when used as a companion to the water image. A green valley can be checked against the location of the Sabine River or a named creek, while a brown or tan ridge shows higher ground between drainage lines. The roughly 95-meter difference between the lowest and highest actual values is enough to create visible local relief, even though the county is not a mountainous landscape.
Pick the map that matches the question you are asking
If the goal is to find a town, road, college, courthouse, or the county line, the general map is the quickest starting point. The ranked city map is better when the question is about which communities stand out and how they are distributed. For rivers, creeks, and lakes, the water map removes much of the road detail and makes named water features easier to follow. The elevation map is the clearest choice when the concern is relative height, valleys, and the location of higher ridges.
The four maps become more useful when compared by location. Find Kilgore on the county map, for example, then look at the water and elevation images to see the lower river corridor north and east of the city. Do the same with Longview and the east-central part of the county. Because the boundary is consistent, there is no need to estimate a new position each time. This makes the set practical for school work, local reference, presentation slides, and printed handouts where different layers of geographic information are needed.
Readers who only need one task do not have to use every image. A road-oriented reference can rely on the county map alone, while a natural-geography explanation may pair the water and elevation maps. The ranked city map adds a compact visual summary when a full statistical discussion is unnecessary. Keeping these purposes separate helps avoid clutter and makes each map easier to read.
The download archive contains four high-resolution A3 JPG files matching the maps presented on this page: the general county map, ranked city map, terrain-and-water map, and elevation map. Use the web images for quick viewing, then download the ZIP when you need larger files for printing, offline reference, classroom material, or a document that requires more image detail.
Before printing, check the paper size, margins, and scaling options in the print dialog so that labels are not reduced more than necessary. The maps are intended as geographic reference graphics rather than legal survey documents. When an exact legal boundary, official hydrographic record, or source elevation dataset is required, use the official data references listed at the end of the page.
Frequently Asked Questions
Which place is the easiest starting point on a Gregg County map?
Longview is the most convenient starting point. The general map marks the Gregg County Courthouse there, and the ranked city map places Longview first. After locating Longview, move south to Kilgore and west toward White Oak and Gladewater to establish the county’s main city pattern.
Where does the Sabine River appear in the county?
On the supplied water map, the Sabine River crosses the county below the middle from west toward east. Smaller named features such as Hawkins Branch, Grace Creek, Moody Creek, Peavine Creek, and Rabbit Creek appear around the larger river corridor, along with several named lakes.
What elevation range is shown on the Gregg County elevation map?
The legend states an actual range of about 70 to 165 meters with a mean near 102 meters. Lower green valleys are common along drainage lines, while yellow, tan, and brown areas mark relatively higher ridges between them.
Map File Information
One ZIP contains the JPG versions of the county, city, water, and elevation maps shown above.
- File Type: JPG
Related Maps
- Rusk County Texas map
- Smith County Texas map
- Upshur County Texas map
- Panola County Texas map
- Morris County Texas map
Data references
For local government and county-office information, use the official Gregg County website. County-boundary and road-reference data are available from the U.S. Census Bureau TIGER/Line Shapefiles. The article itself prioritizes the place names, routes, and map features visible in the supplied Gregg County package.
Official water-reference resources are available through USGS National Hydrography, and source elevation data can be checked through the USGS 3D Elevation Program. The USGS The National Map Viewer is also useful for comparing multiple federal map layers.
Green Map creates custom-edited map images using open geographic data sources such as geoBoundaries, Natural Earth, OpenStreetMap, and government open data.
These maps are edited visual materials, not raw data files, and are provided for education, documents, presentations, and graphic reference.