This US East Coast map shows 16 states in a continuous portrait view from Maine to Florida. Fourteen of them touch the Atlantic Ocean, while Vermont and Pennsylvania are included to give the Northeast more geographic context. That scope is more precise than simply calling every state in the eastern half of the country part of the same coastal region.
The labeled images identify Maine, New Hampshire, Vermont, Massachusetts, Rhode Island, Connecticut, New York, Pennsylvania, New Jersey, Delaware, Maryland, Virginia, North Carolina, South Carolina, Georgia, and Florida. They also name the North Atlantic Ocean and Gulf of Mexico. Washington, D.C. is not drawn or labeled as a separate unit, and inland states beyond the displayed frame remain gray background rather than part of the highlighted set.
Three 1200 by 1378 pixel WebP previews share the same state geometry. The color edition separates states with muted fills, the black-and-white edition retains names and boundary lines, and the blank outline removes all geographic labels. Together they support regional orientation, state-labeling lessons, document graphics, presentation slides, and custom route or data overlays.
“East Coast” is a practical regional term, not a federally fixed administrative boundary. The U.S. Geological Survey explains that regional extents are defined case by case according to the purpose of a map or organization. Readers should therefore treat this page as a clearly documented 16-state map set, not as the only possible definition of the eastern seaboard.
Table of Contents
US East Coast map Overview
The map is arranged around a long north-to-south sequence. Maine anchors the upper right, New England’s smaller states require external labels and leader lines, and New York and Pennsylvania create a wider middle tier. From Maryland and Virginia southward, the coastline opens into the Carolinas, Georgia, and the Florida peninsula. The portrait layout keeps that full span visible without shrinking the Northeast into an unreadable cluster.
Large water shapes provide orientation beyond the state borders. Portions of the Great Lakes appear near New York and Pennsylvania, the North Atlantic fills the right side, and the Gulf of Mexico sits west of Florida. The labeled versions name the two ocean areas but do not identify individual Great Lakes, bays, rivers, or sounds.
This US East Coast map is a state-level reference rather than a transportation map. No cities, highways, railways, airports, state capitals, mileage scale, or compass are included. A route drawn on the outline can explain sequence and direction, but actual travel planning requires a current road or transit source.
Included Map Styles
All three files keep the same coastline, state borders, surrounding gray land, water shapes, and bottom-right page title. The visual treatment changes according to the amount of guidance a reader needs:
- Color reference: state names, ocean labels, and separate muted fills
- Monochrome reference: the same names and boundaries without state color
- Blank outline: state boundaries without place or water labels
Because the boundary base does not change, readers can move from recognition to recall. A teacher might present the color map first, distribute the outline for labeling, and use the monochrome version as an answer reference. An editor can likewise compare a finished regional graphic with an unmarked working base without introducing different state shapes.
Color US East Coast States Map
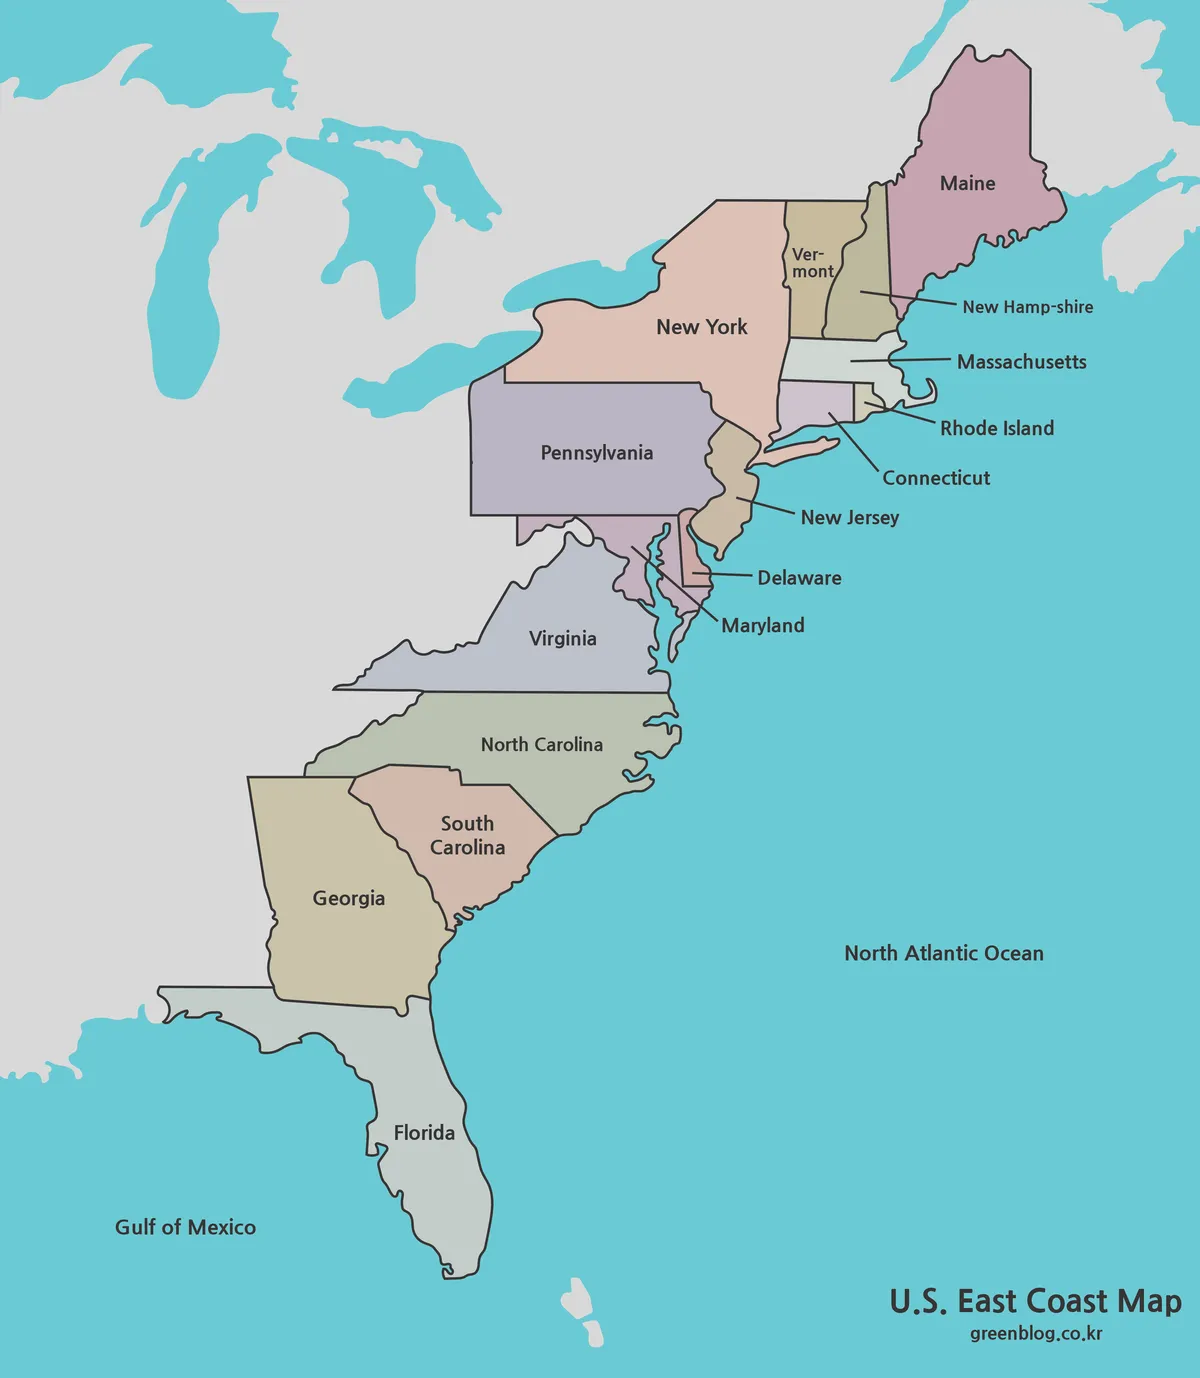
The color US East Coast map makes state adjacency easiest to scan. Separate fills clarify the narrow New England sequence, the small Mid-Atlantic states, and the larger shapes farther south. Vermont and Pennsylvania are colored like the coastal states, so their inclusion in this particular 16-state frame is visually explicit.
Leader lines connect several compact northeastern states to labels positioned over the Atlantic. Rhode Island, Connecticut, Massachusetts, and New Hampshire would be difficult to label at the same scale without that treatment. Vermont is broken across two text lines inside its narrow shape, while Delaware and Maryland use labels placed to the right of their small polygons.
The palette is decorative, not thematic. It does not represent population, political affiliation, climate, time zones, or travel regions. Use the color edition for orientation and presentation hierarchy, then add a separate legend only when an external dataset is being shown.
Black and White Printable Version
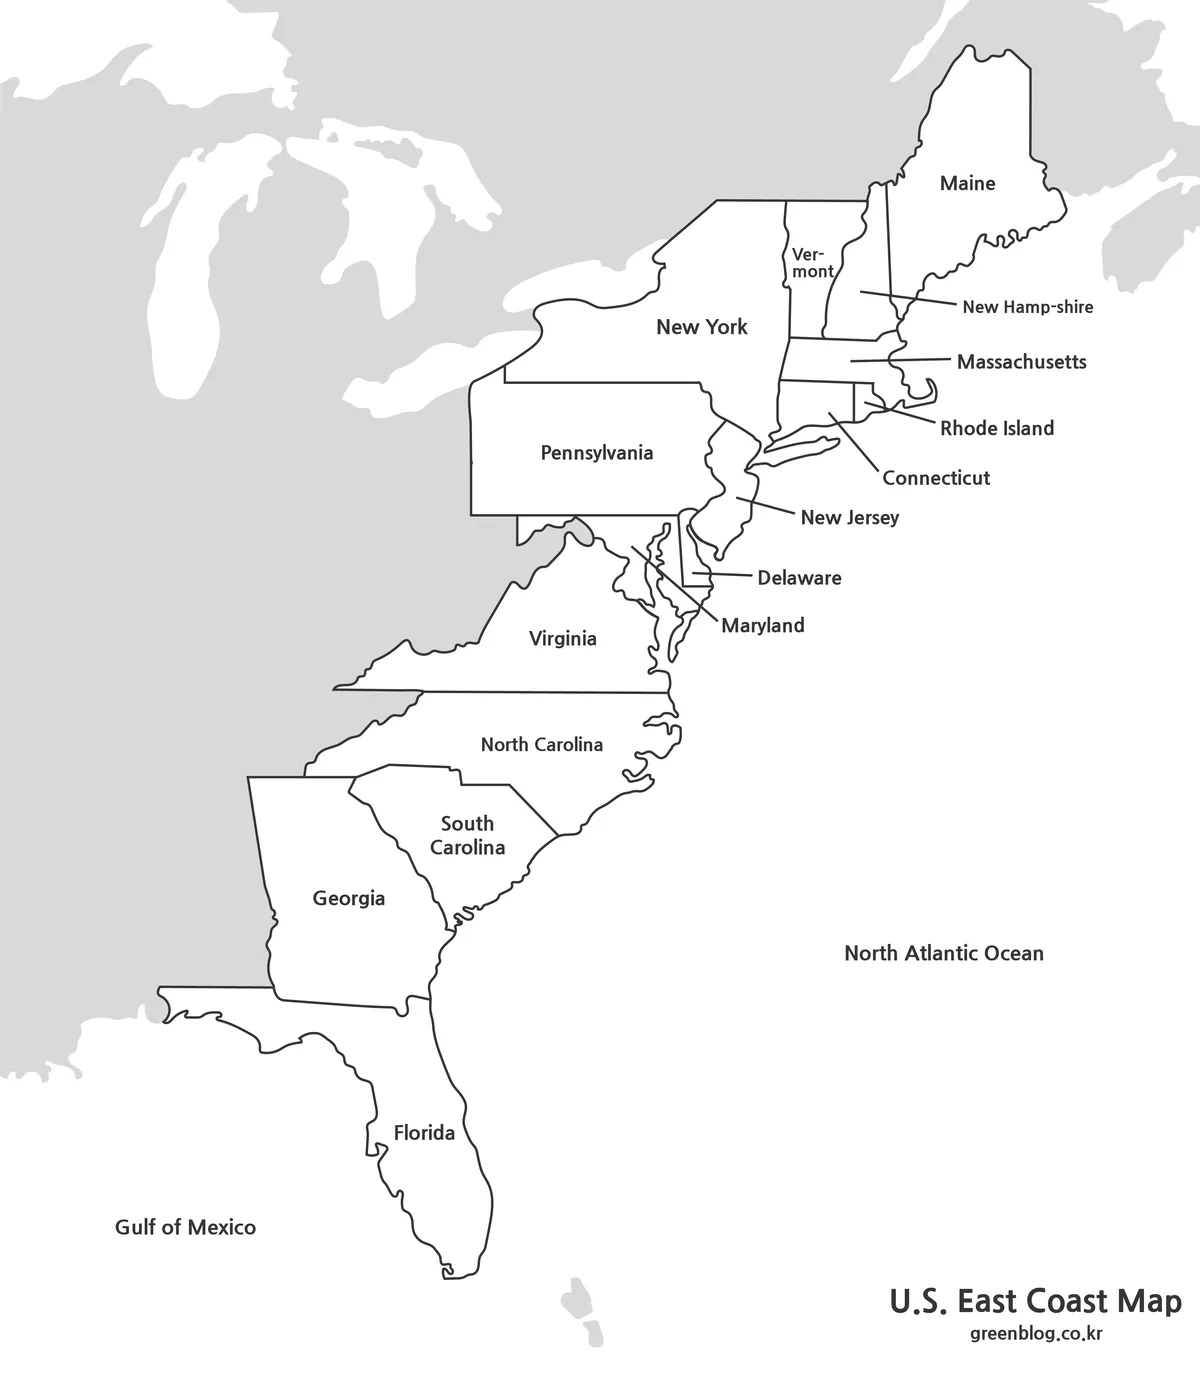
The monochrome version preserves all state and water labels while removing the colored fills. That makes the outlines more prominent in reports, study sheets, and documents where nearby charts already use color. It remains a completed reference, not a blank quiz, because every one of the 16 state names is printed.
Before printing a large batch, inspect the cluster from New Hampshire through Delaware at the intended size. The label leaders, Long Island, Cape Cod, Chesapeake-area shorelines, and small state boundaries carry more detail than the broad southern shapes. Excessive photocopier contrast may thicken those lines or reduce the white gaps between them.
A useful worksheet can ask students to sort the displayed states into New England, Mid-Atlantic, and southeastern working groups, provided the activity explains its chosen definitions. The map itself does not encode Census regions or any other official grouping.
Blank US East Coast Outline Map for Editing
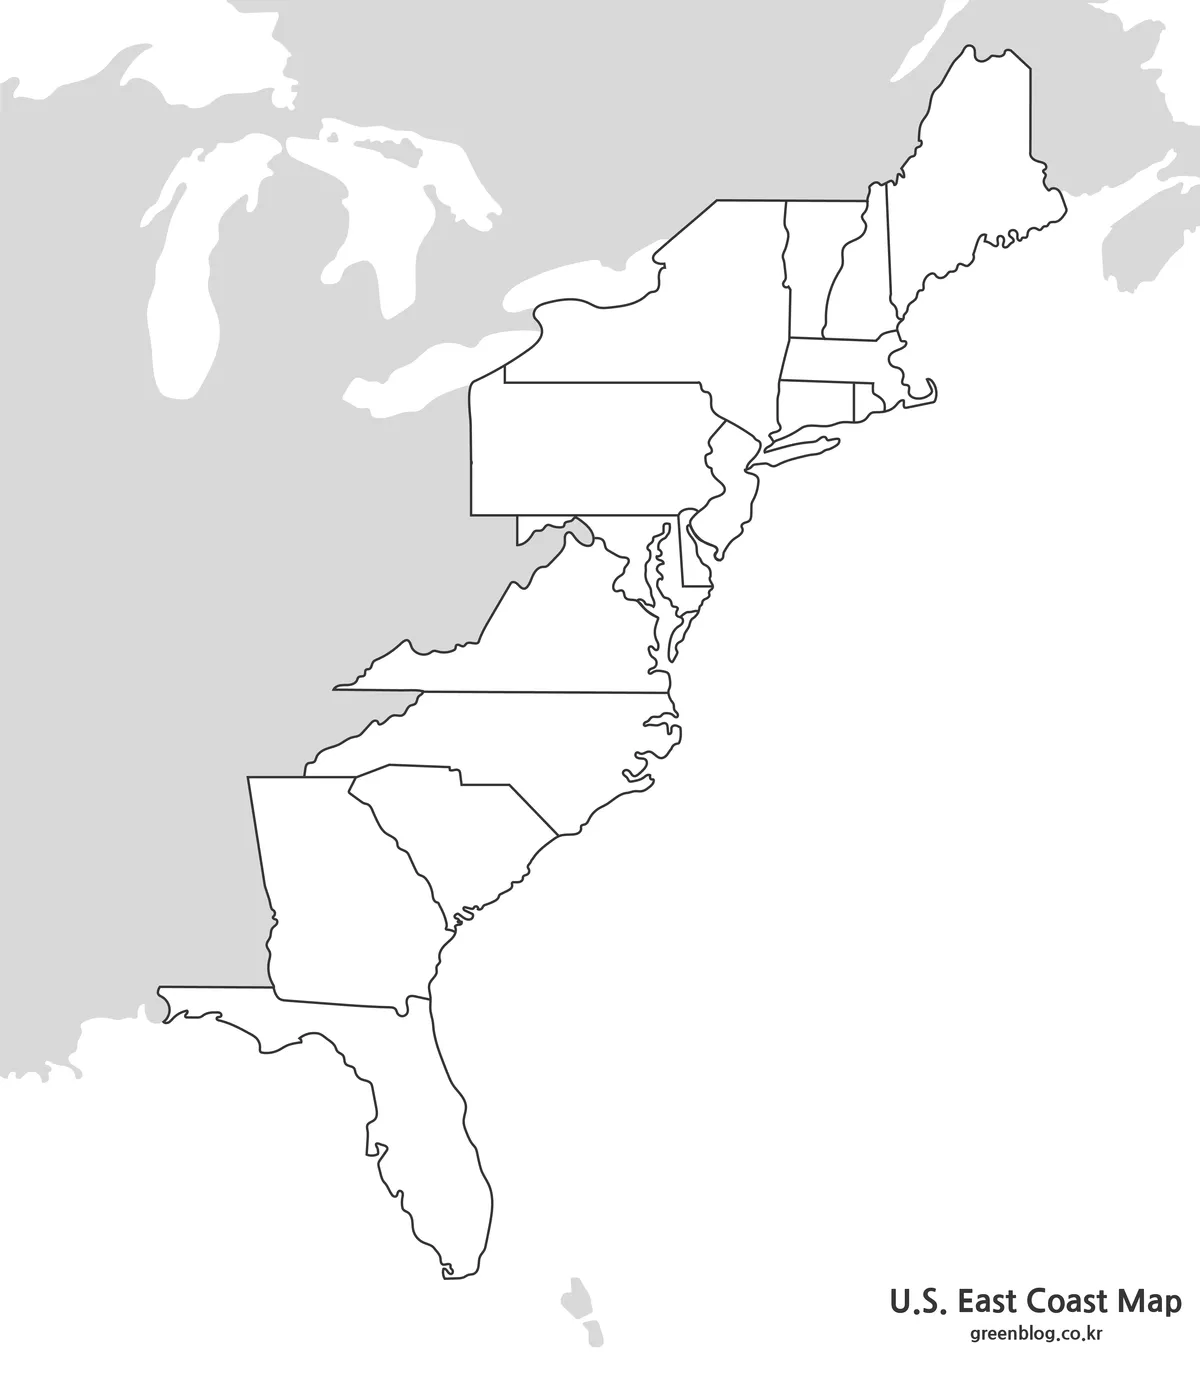
The outline US East Coast map removes state names, ocean labels, leader lines, and colored fills. It retains the 16 state polygons, coastal detail, Great Lakes context, and surrounding gray land. The page title stays in the lower right, identifying the subject even after users add their own information.
Possible additions include state abbreviations, capital markers, a north-to-south travel sequence, hurricane study zones, port locations, or data colors. Those subjects are not built into the source image, so labels and datasets must be checked separately. For classroom use, the color or monochrome edition can serve as the reference after students complete the blank copy.
The preview is a raster WebP image rather than a vector source with independently selectable state polygons. Arrows, text, and translucent fills can be overlaid in common document or graphics software, but extreme enlargement may soften small coastal details. Keep an unchanged original and work on a duplicate.
What Makes an East Coast Map Different?
An “Eastern United States” map may extend farther inland and include Ohio, West Virginia, Kentucky, Tennessee, or other states, depending on its purpose. An Atlantic shoreline list would normally exclude inland Vermont and Pennsylvania. This graphic takes a third approach: it highlights 14 Atlantic states and adds those two neighboring northeastern states, producing a 16-state regional frame.
That distinction matters when describing the download. It is accurate to call it an East Coast-oriented map from Maine to Florida, but not to claim that every colored state has Atlantic shoreline. Likewise, the absence of Washington, D.C. means the image should not be described as a complete map of every state-and-district jurisdiction along the coast.
A caption should state the scope whenever the image is reused: 16 displayed states, including Vermont and Pennsylvania for context. This small note prevents readers from assuming that the boundaries represent a universal government definition of the East Coast.
Practical Uses for the Map Collection
A US East Coast map lesson can focus on sequence, scale, and regional definitions. Students might trace the Atlantic-facing states, circle the two inland states included for context, and explain why “coast” and “eastern” do not always describe identical sets. The outline is also suitable for recalling state names from Maine south to Florida.
For a presentation, use color for the opening overview and switch to the outline when highlighting a route or dataset. In monochrome reports, the labeled version keeps geographic context without competing with colored charts. Any route, mileage, storm path, population figure, or economic category added later needs its own source and legend.
Select the US East Coast map version according to the reader’s task: color for immediate state separation, monochrome for labeled printing, and outline for annotation. None of the three replaces a current highway, weather, nautical, or emergency-management map. Their strength is a clean, consistent state-level frame.
Frequently Asked Questions
What is included in the US East Coast map collection?
The collection includes a color map, a black and white map, and an outline map.
Is a US East Coast map different from an Eastern US map?
Yes. An East Coast map focuses on the Atlantic coastal side of the United States, while an Eastern US map may include inland states as well.
Can I print the US East Coast map in A3 size?
Yes. The map is prepared for A3 high-resolution printing, making it suitable for posters, classroom handouts, reports, and presentations.
What is the outline map best for?
The outline version is best for editing, route marking, state highlighting, classroom labeling, and infographic design.
Which version should I use for a travel presentation?
The color map is usually best for quick visual explanation, while the outline map is better if you need to add a custom route or highlight specific states.
Map File Information
The archive groups the three 16-state regional map images shown above.
- Included Versions: Labeled color, labeled black-and-white, and blank outline
- Intended Use: State reference, classroom labeling, printing, slides, and annotation
Additional Resources
- USGS: Definitions of U.S. Regions — Learn why terms such as “East Coast” have application-specific rather than fixed federal boundaries.
Related Maps
Green Map creates custom-edited map images using open geographic data sources such as geoBoundaries, Natural Earth, OpenStreetMap, and government open data. These maps are edited visual materials, not raw data files, and are provided for education, documents, presentations, and graphic reference.