Forest is the defining surface across Chattahoochee County in the supplied 2025 data. It accounts for 68.09% of the county, while developed land covers 11.59% and wetlands 8.03%. This Chattahoochee County Georgia Land Cover Map set makes the contrast easy to see: broad forest surrounds several separate developed concentrations rather than one continuous urban field.
Four views are included here: 2025 land cover, forest and farmland, impervious surface, and an endpoint comparison from 1985 to 2025. The WebP images are used for on-page viewing, and the four original 2480 × 1754-pixel JPG maps are available together in one ZIP below. They work well for county profiles, classroom discussion, reports, and presentations that need a clear countywide frame.
Table of Contents
A forest baseline with development broken into separate clusters
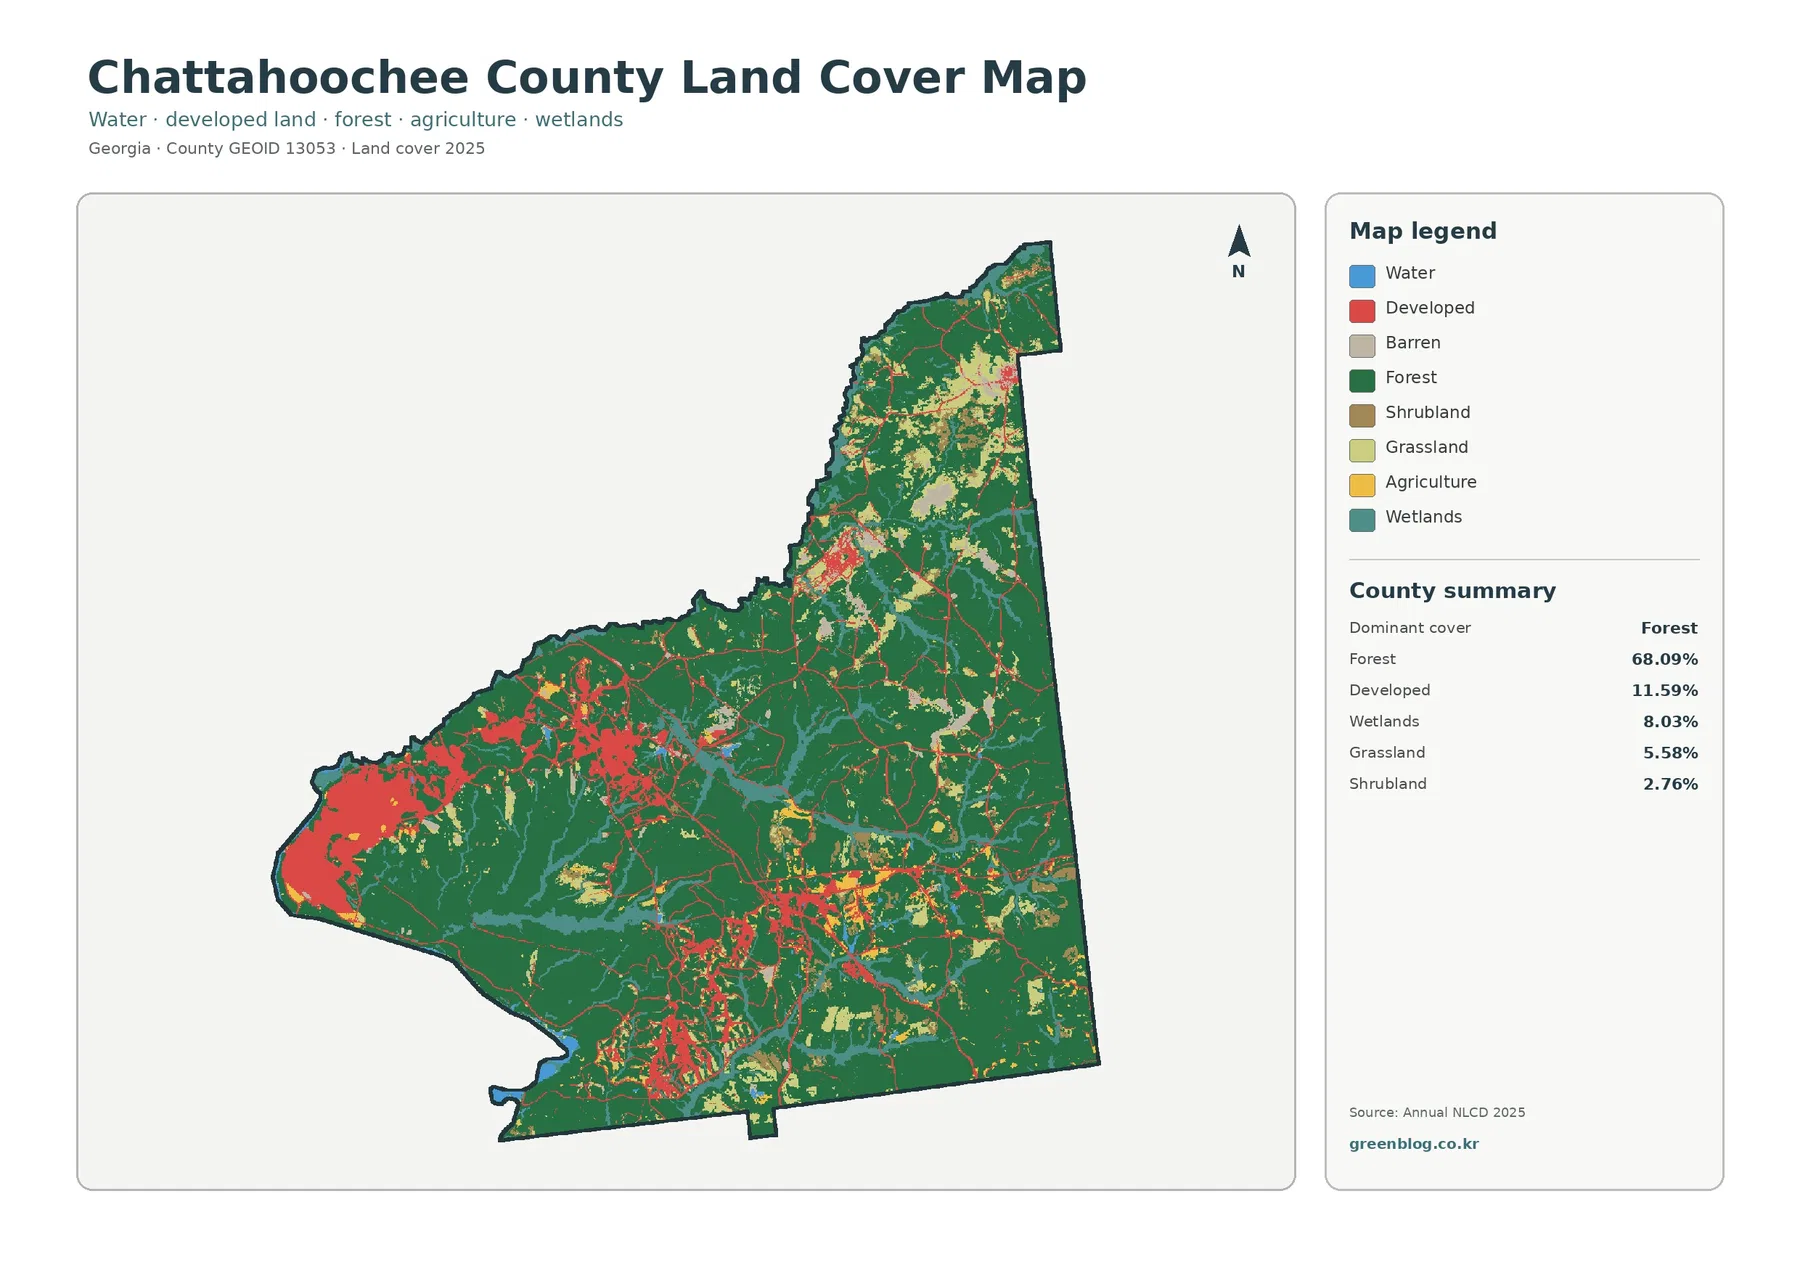
The first map is dominated by dark green. Forest extends across most of the central and eastern county and remains broad through much of the south and north. Red developed areas interrupt that forest in several places. A large concentration occupies the broad western lobe, another substantial group appears in the southern interior, and smaller developed patches occur farther north and near the center. The gaps between these concentrations remain heavily wooded, which is why the county can be strongly forested even though developed land is visually prominent in several areas.
The summary gives forest 68.09%, developed land 11.59%, wetlands 8.03%, grassland 5.58%, and shrubland 2.76%. Those figures describe a county where the dominant class is clear, but they do not imply a perfectly uniform forest. Open surfaces, wet areas, and development repeatedly interrupt the green background. Looking at those interruptions is more informative than simply reporting that roughly two-thirds of the county is forest.
Wetlands appear as irregular teal bands and pockets instead of one large block. They weave through forested areas in the interior and occur in several parts of the west and south as well. The map does not label individual streams, facilities, or wetland names, so those shapes should not be assigned to a specific creek or property from this image alone. The useful observation is the relationship between wet ground and the larger forest matrix, not a parcel-level wetland boundary.
Land cover also needs to be separated from legal land use. A forest cell says that tree cover is the predominant mapped surface; it does not establish ownership, zoning, conservation status, or whether a parcel can be developed. Likewise, a developed cell does not tell whether the underlying use is residential, institutional, commercial, transportation, or something else. The map is strongest as a countywide description of surface conditions.
Hard surfaces are concentrated rather than spread evenly
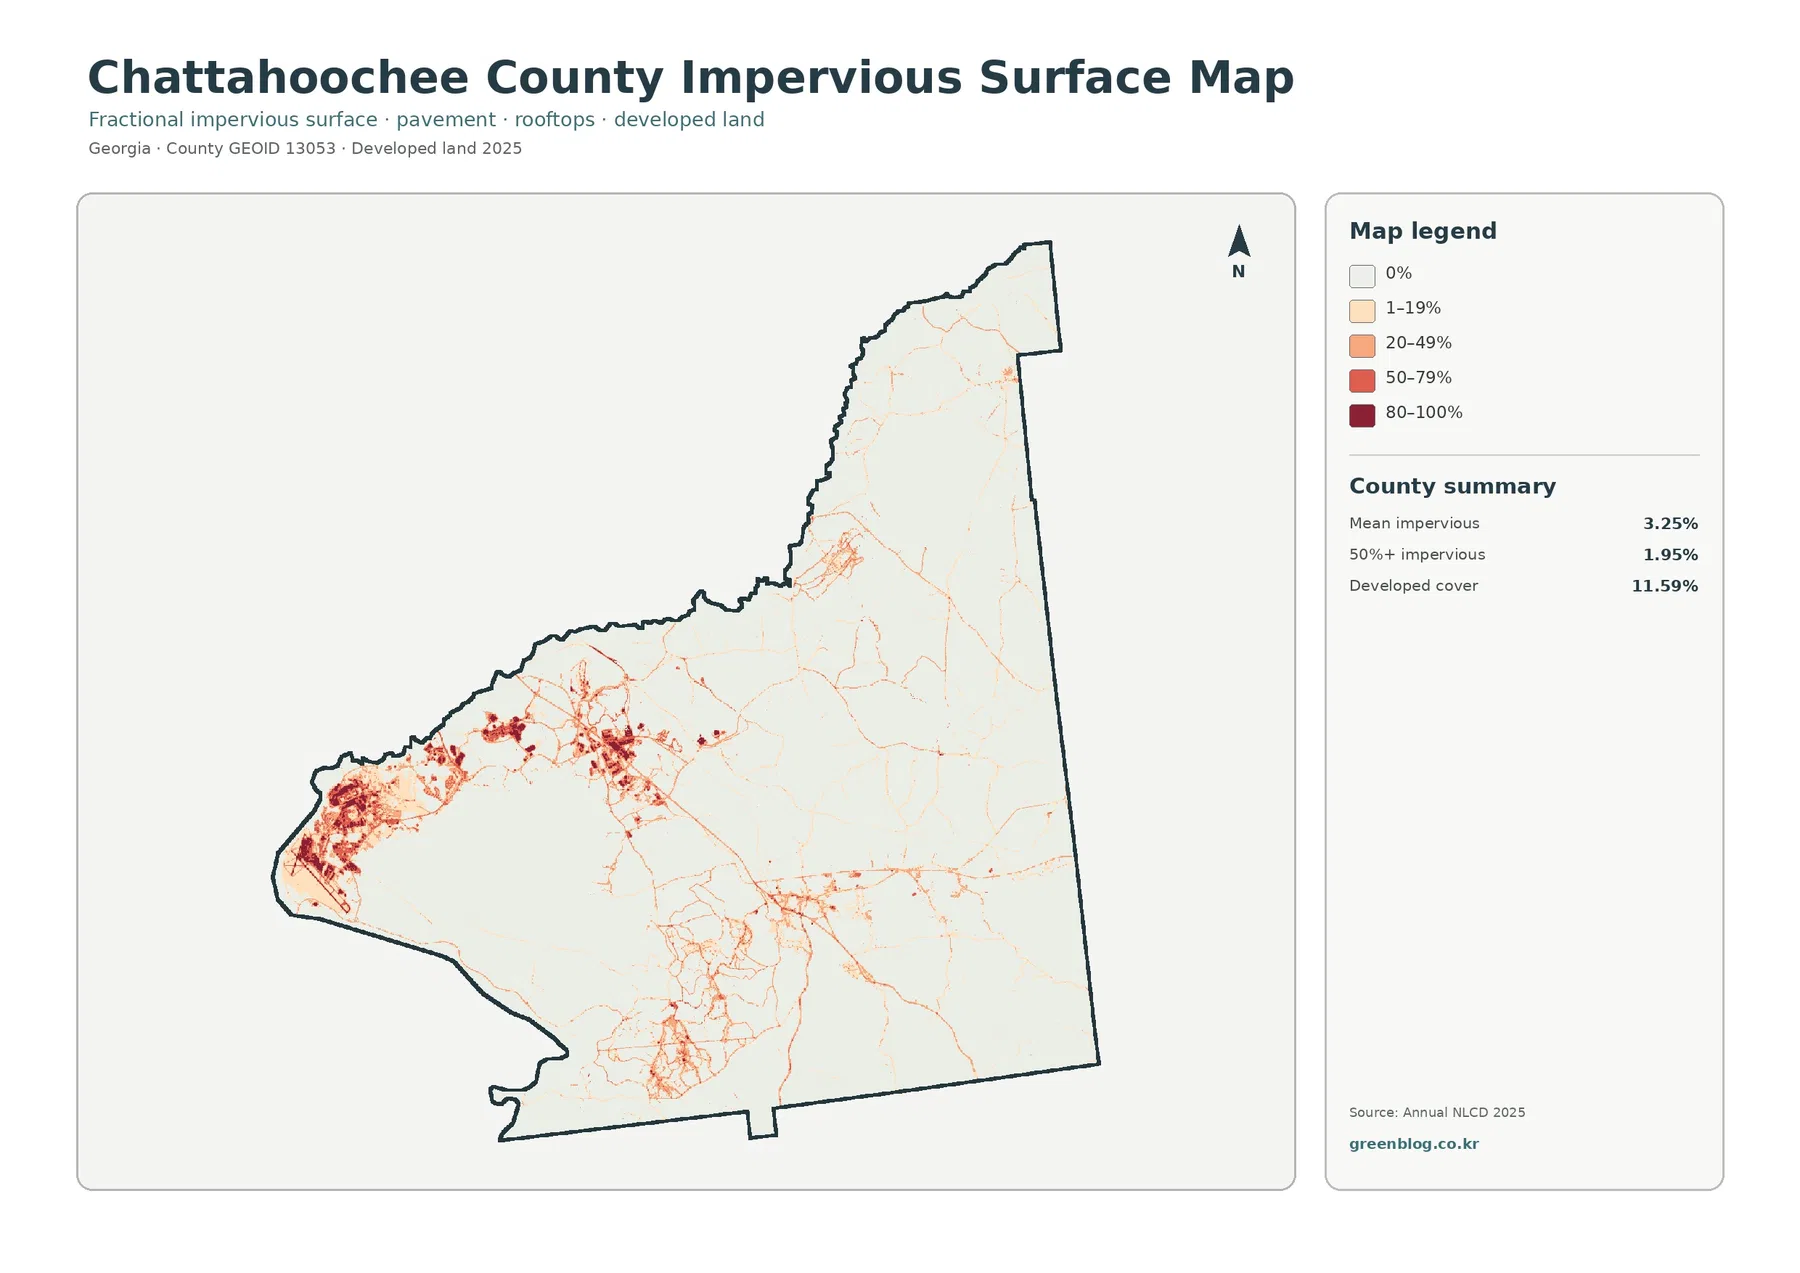
The impervious map changes the visual emphasis. Most of the county becomes very pale, while a few places carry orange and deep red values. The western lobe has the strongest concentration, and a network of higher values appears in the southern interior. A smaller cluster is visible farther north. Thin linear features connect some of these areas, while most of the central and eastern county remains close to the lowest classes.
Mean impervious cover is 3.25%, and only 1.95% of cells have at least 50% impervious surface. Both values are well below the 11.59% developed-land share in the general land-cover product. That difference is expected. A developed class can include lawns, trees, bare ground, and other permeable surfaces around buildings and roads. The impervious product isolates the share of each cell covered by harder surfaces such as pavement and rooftops.
This comparison prevents a common mistake. Eleven and a half percent developed land does not mean that the same share of the county is sealed by concrete or asphalt. The countywide mean of 3.25% shows that hard surfaces occupy a much smaller portion overall, even though they are intense within selected developed clusters. Using both maps lets a reader distinguish the geographic footprint of development from the concentration of hard cover inside it.
No road names or facility boundaries are printed on the supplied image. Some narrow high-value lines resemble transportation corridors, but the map alone cannot identify which road, installation, or neighborhood they represent. For a report that requires names, use an official transportation or local GIS layer alongside this map. Here, the reliable conclusion is simply that impervious cover is highly uneven, with strong western and southern concentrations and a much lighter forest-dominated remainder.
Agriculture is minor beside forest, grassland, and wetlands
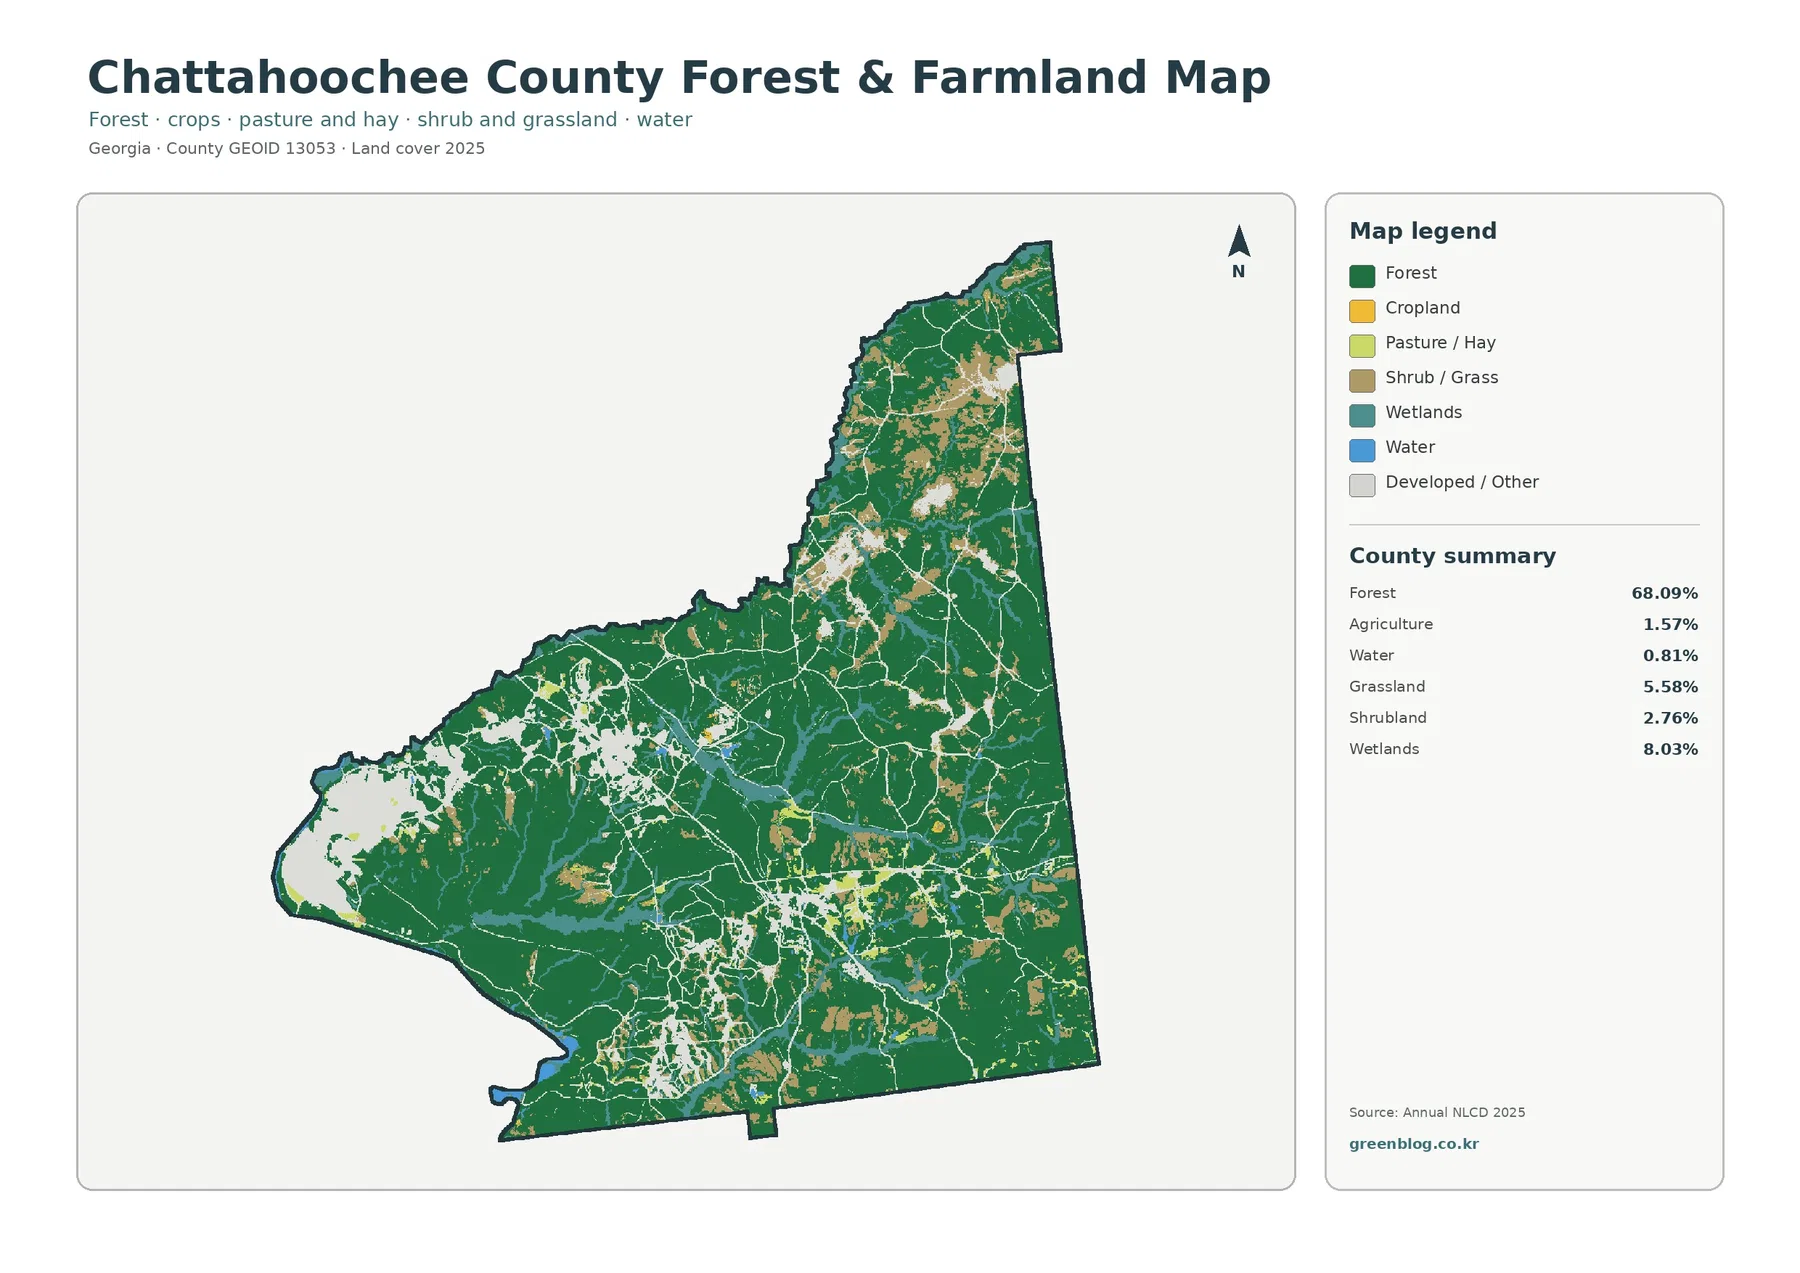
The forest-and-farmland view makes the small agricultural share especially clear. Agriculture is only 1.57% in the supplied summary. Forest remains 68.09%, while grassland accounts for 5.58%, shrubland 2.76%, wetlands 8.03%, and water 0.81%. Yellow agricultural patches occur in several places, but there is no broad farm belt comparable with counties where cropland dominates the landscape.
Grassland and shrubland matter because open-looking ground is not automatically farmland. The map separates those classes, and they occupy a larger combined share than agriculture. Beige and pale-green patches are mixed through the forest in irregular shapes, while yellow agricultural cells are smaller and more scattered. Calling every opening a field would therefore misrepresent what the supplied classification actually says.
The pale Developed / Other areas are also easy to misread. They are not missing data. This specialized map reduces the emphasis on developed surfaces so forest, agriculture, grass, wetlands, and water stand out more clearly. Comparing it with the general land-cover map helps identify why some places that were red before become pale here. The two maps use the same county boundary but answer different questions.
For an environmental lesson, this view is useful because it shows more than a forest percentage. It shows where open land interrupts the woods, where wetland patches meet forest, and how little of the county is mapped as agriculture. A reader can move from the large 68.09% forest figure to a more detailed explanation of what occupies the remaining space without inflating minor classes.
The 1985–2025 comparison is broad, mixed, and not just a development map
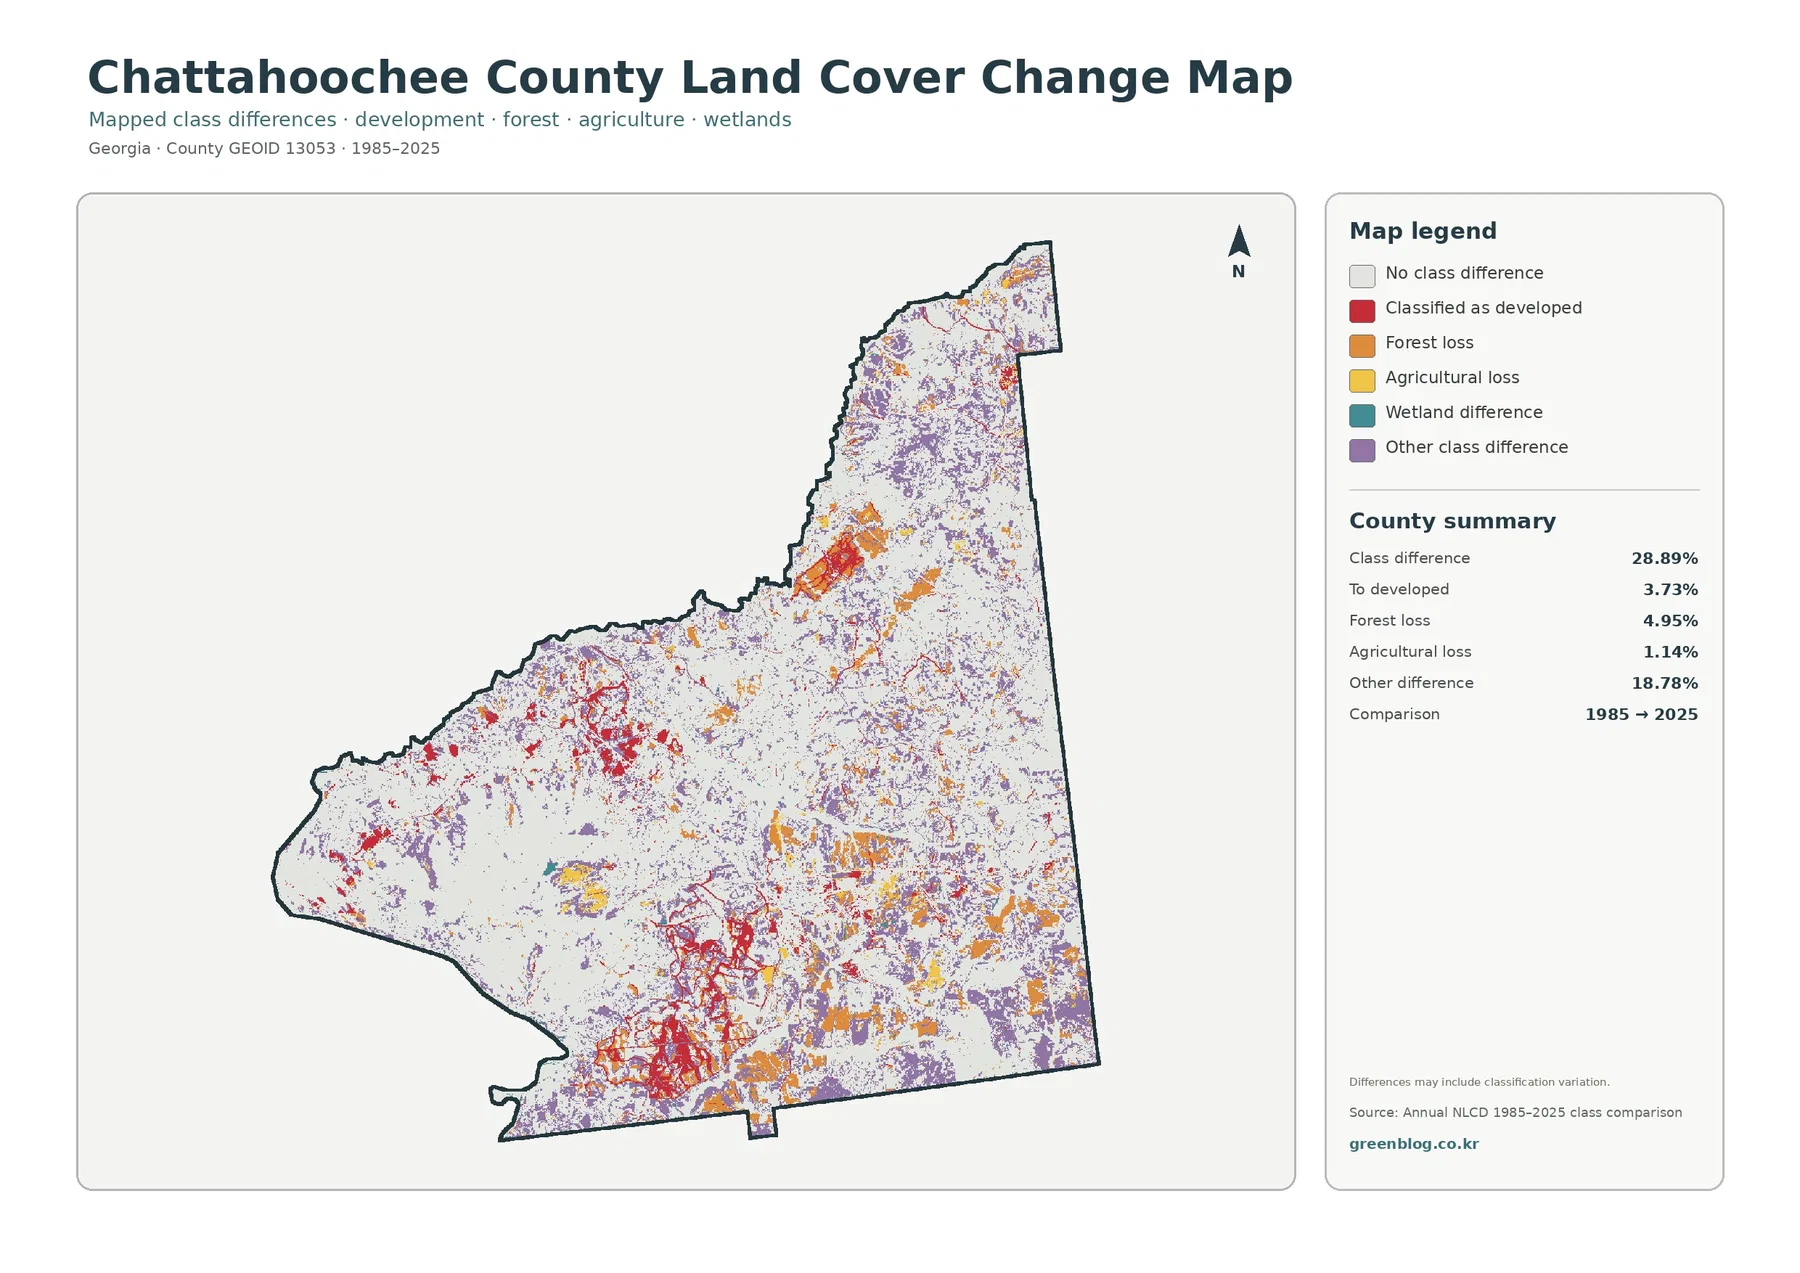
The change map reports a class difference for 28.89% of cells between the 1985 and 2025 endpoints. The largest component is not development. Other class differences account for 18.78%, compared with 4.95% categorized as forest loss, 3.73% classified as changing to developed, and 1.14% agricultural loss. That breakdown matters because a single total-change percentage can sound much more dramatic than the underlying categories justify.
Red change-to-developed cells are especially noticeable around the western developed concentration and in the southern interior. Orange forest-loss patches occur in many smaller groups across the north, east, center, and south. Purple other-difference cells are more widespread than either category and are particularly frequent over broad northern and eastern areas. Large light areas still show no endpoint class difference.
A purple or orange cell does not reveal the complete history of a place. The map compares the predominant classes at two endpoints. It does not identify the exact year of a transition, the cause, or every change that may have happened in between. Classification variation, mixed pixels, vegetation condition, and transitions among nondeveloped classes can all influence the comparison. The map itself warns that differences may include classification variation.
For that reason, the safest caption is “1985–2025 land-cover class comparison,” not “40 years of continuous change.” A project that needs to date a specific clearing or development should use intermediate Annual NLCD years, aerial photography, and local records. This map is best for screening broad patterns and deciding where a closer look may be useful.
Local planning context adds meaning without changing what the map measures
Chattahoochee County has an unusual administrative and land-use setting. The Georgia Department of Community Affairs maintains the Cusseta-Chattahoochee Unified Government comprehensive-plan page, including a 2026 plan, and the local government operates as the Unified Government of Cusseta-Chattahoochee County. Those sources provide context for local planning, infrastructure, growth, and community decisions that a land-cover image cannot supply on its own.
The county also includes a major military-installation context. U.S. Army environmental-management information for the installation discusses forest, wildlife habitat, prescribed fire, and other natural-resource responsibilities. That background helps explain why forest and managed open land are locally important topics, but it should not be used to assign a cause to individual pixels. The supplied maps do not show the installation boundary, so a particular forest or developed patch cannot be labeled as military property from these images alone.
Keeping those source types separate improves accuracy. NLCD answers a surface question: is a cell predominantly forest, developed, wetland, grass, or another cover? A comprehensive plan or zoning code answers policy and legal-use questions. They can be used together in a regional study, but the land-cover colors should never be treated as zoning districts, ownership boundaries, or permission to build.
Pair the maps according to the question
For a general county profile, begin with the 2025 land-cover map. It gives the strongest single summary of forest dominance, the separated developed clusters, and the wetland share. If the subject is habitat or open land, pair that image with the forest-and-farmland view. The second map makes the 1.57% agricultural share and the larger grassland, shrubland, and wetland components much easier to discuss.
For a built-environment topic, the better pair is the general land-cover map and the impervious map. One shows the 11.59% developed footprint, while the other shows that mean impervious surface is only 3.25% and that the hardest surfaces are concentrated in selected areas. This prevents a presentation from treating all developed land as equally paved.
Use the change image when the question specifically involves the 1985 and 2025 endpoints. Place it beside the current land-cover view rather than presenting it by itself. The large 18.78% other-difference category becomes easier to explain when readers can also see the current forest, wetlands, open land, and developed areas. The pairing makes it less tempting to interpret every colored change cell as urban expansion.
A slide or printed page usually does not need all four maps at the same size. One main map and one supporting map leave enough space for the legend and county summary to remain readable. Because the boundary is consistent among the images, switching between map pairs still preserves the same geographic frame.
Scale, classification, and print limits
Annual NLCD products use raster cells to classify broad areas consistently. A typical 30-meter cell can contain trees, grass, a road, buildings, and drainage features at the same time, but the land-cover layer assigns a predominant class. Enlarging the map will enlarge those cells; it will not reveal parcel boundaries or create detail that was not present in the source data.
The current maps represent the supplied 2025 observation year. Later construction, forest management, wildfire, vegetation recovery, seasonal wetness, or other changes may not appear. The endpoint comparison has an additional limitation because it is based on two years. Intermediate conditions can be missed, and some mapped differences may reflect classification variation rather than a straightforward physical conversion.
Wetland colors should not be used as a legal wetland delineation, and impervious percentage should not be treated as a direct flood or drainage model. Property decisions, permits, engineering, military-boundary questions, and zoning reviews require current authoritative records from the appropriate agencies. These maps are intended for county-scale reference, education, visual comparison, and preliminary screening.
Each downloadable JPG is 2480 × 1754 pixels and is preserved at the original resolution supplied in the package. The files are larger than the WebP previews used in the article, but the manifest does not mark them as meeting an A3 high-resolution reference. They are practical for screens, documents, and moderate-size printing. Test a large poster before final production to make sure labels and legend text remain sharp enough.
Files included in the Chattahoochee County download
The ZIP contains one original JPG for 2025 land cover, one for forest and farmland, one for impervious surface and developed land, and one for the 1985–2025 land-cover comparison. Together they show a county where forest is the clear baseline, agriculture is small, developed surfaces occur in distinct clusters, and the long-term endpoint comparison contains much more than one type of change.
Frequently Asked Questions
If forest covers 68.09%, is development confined to one town-sized spot?
No. Developed land is much smaller than forest overall, but the map shows several separate concentrations. The broad western lobe and the southern interior contain the strongest groups, with smaller developed patches farther north and near the center. Forest fills much of the space between them.
Why is developed land 11.59% when mean impervious surface is only 3.25%?
Developed land can contain permeable surfaces such as lawns, trees, and bare ground around buildings and roads. The impervious product measures hard surfaces more directly. Only 1.95% of cells are at least 50% impervious, so the county can have visible developed clusters while retaining a low countywide hard-surface mean.
Does the 28.89% class difference mean that nearly 29% of the county was developed or cleared?
No. The total combines several categories. Only 3.73% is classified as changing to developed, 4.95% as forest loss, 1.14% as agricultural loss, and 18.78% as other class differences. The comparison can also include classification variation, so the total should not be treated as a single measure of urbanization or physical disturbance.
Sources and Reference Data
- MRLC Annual NLCD Data – official access point for annual land-cover and comparison products
- USGS Annual NLCD Land Cover Classification – definitions and guidance for forest, developed, agricultural, wetland, and related classes
- U.S. Census Bureau TIGER/Line Shapefiles – official county-boundary reference for Chattahoochee County
- Georgia DCA – Cusseta-Chattahoochee Unified Government Comprehensive Plan – local comprehensive-plan materials, including the 2026 plan
- Unified Government of Cusseta-Chattahoochee County – official local-government information and administrative resources
- U.S. Army Environmental Management Division – official information on forest, wildlife, fire, and natural-resource management for the installation area
Map File Information
The ZIP contains four original JPG maps for comparing Chattahoochee County's forest-dominated land cover, limited agriculture, wetlands and grassland, concentrated impervious surfaces, and 1985–2025 class differences.
- Included Files: Original high-resolution map files shown in this article
- File Type: JPG images packaged in a ZIP archive
- Intended Use: Printing, education, presentations, and map-based projects
Related Maps
- Appling County Georgia Land Cover Map
- Atkinson County Georgia Land Cover Map
- Bacon County Georgia Land Cover Map
Green Map creates custom-edited map images using open geographic data sources such as geoBoundaries, Natural Earth, OpenStreetMap, and government open data. These maps are edited visual materials, not raw data files, and are provided for education, documents, presentations, and graphic reference.