The Chattooga County Georgia Land Cover Map set captures a county where forest covers most of the landscape while farms and built areas occupy narrower valleys and settlement corridors. Forest accounts for 63.28% of the 2025 summary, agriculture for 21.62%, and developed land for 7.72%. Four views on this page separate the overall pattern, forest and farmland, impervious surfaces, and mapped class differences from 1985 to 2025.
The WebP previews can be read alongside the discussion, and all four original 2480 × 1754-pixel JPG maps are available together in one ZIP download. They work well for county profiles, classroom comparison, presentations, and broad environmental reference. They are not parcel, zoning, ownership, wetland-jurisdiction, or engineering maps.
Table of Contents
A county of wooded ridges with a narrow built center
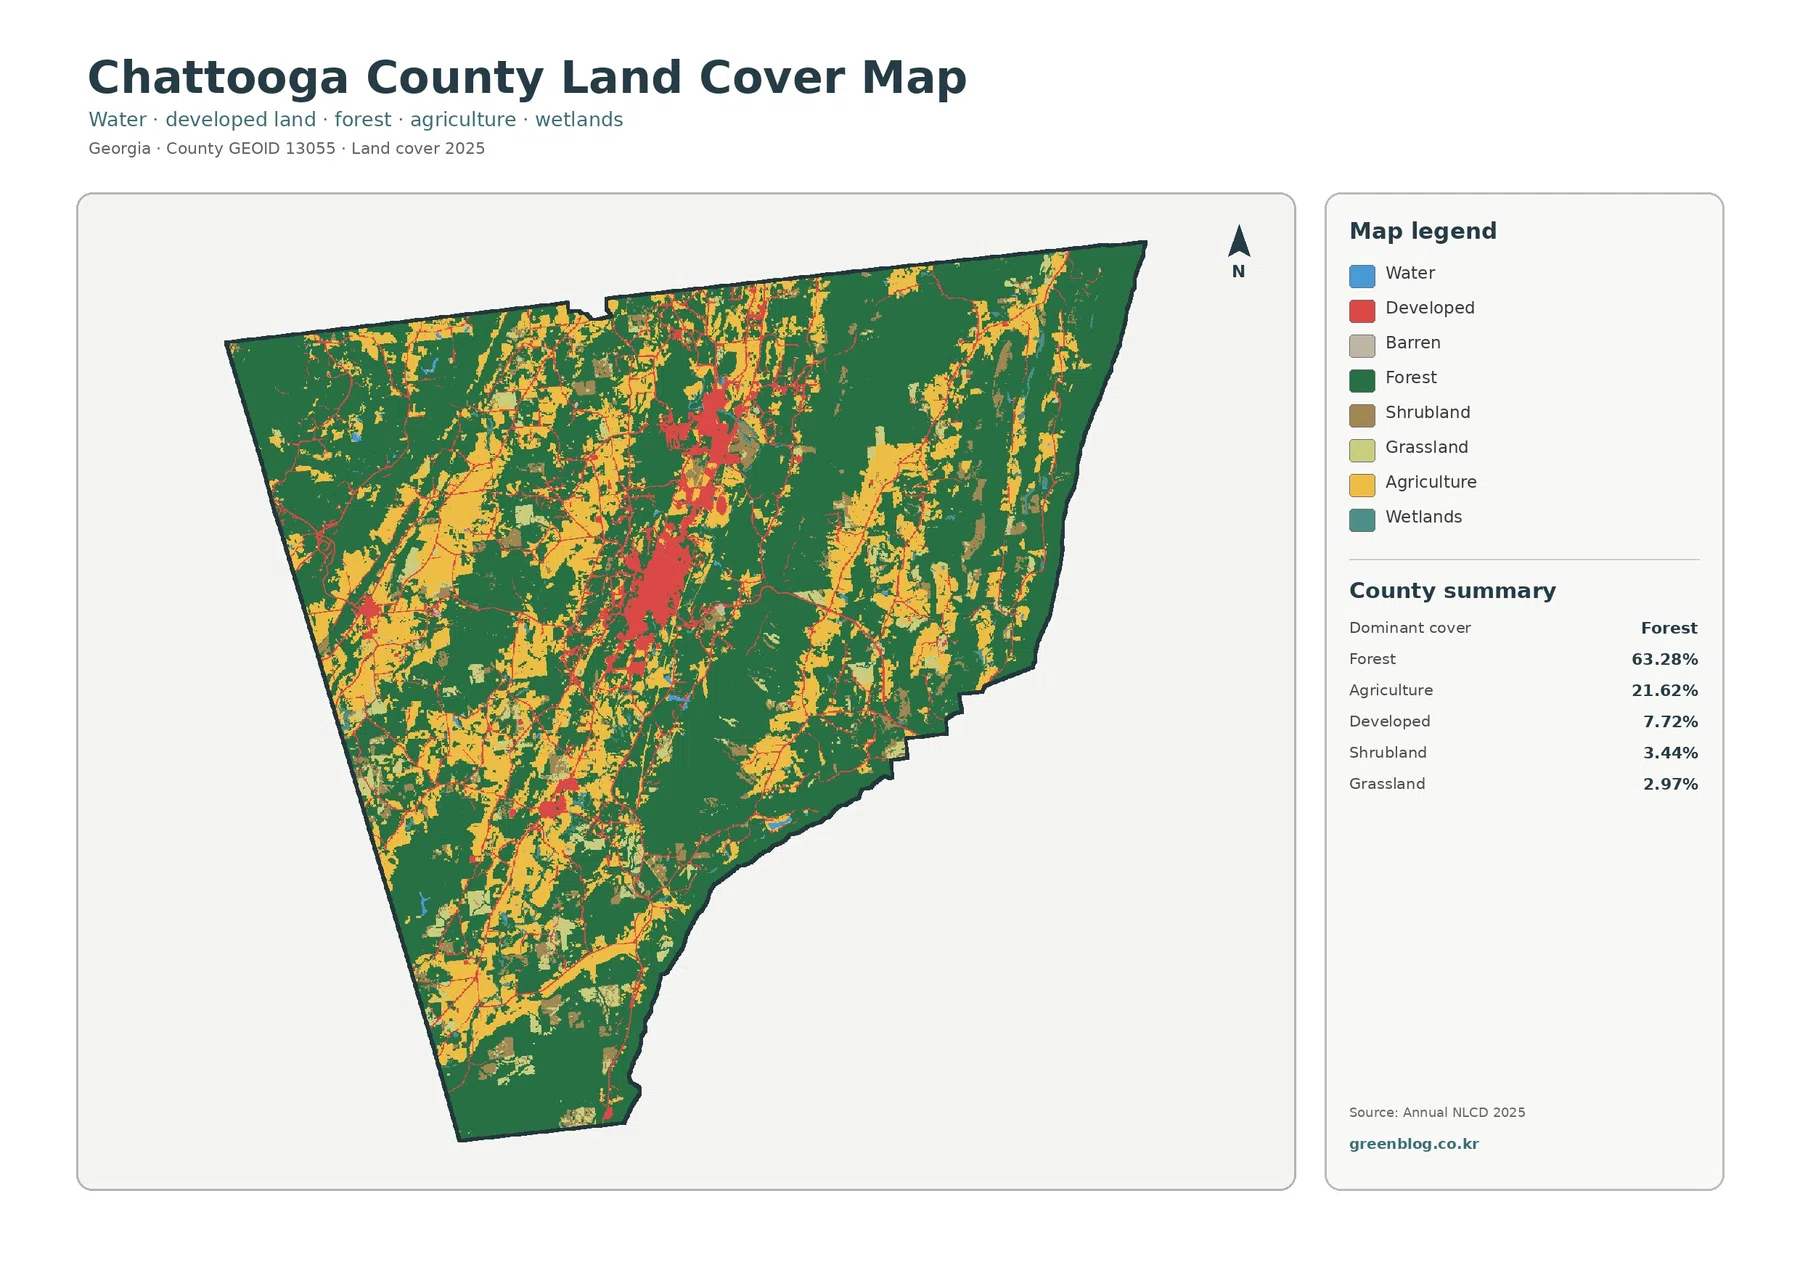
Dark green forest dominates the countywide image, especially across the eastern half and through large blocks in the south and northwest. Yellow agricultural areas interrupt that forest much more often on the western side and through the interior valleys. Developed land forms a different shape: rather than spreading evenly across the county, red areas concentrate in a north–south line near the middle, with smaller pockets elsewhere.
That central alignment makes sense when the map is compared with official local planning information. Georgia’s Department of Community Affairs describes Summerville as centrally located in the Chattooga Valley at U.S. 27 and several state highways. Trion lies about five miles north of Summerville along U.S. 27. The land-cover image does not label municipal limits or road names, so it should not be read as a city map, but the largest developed clusters line up well with that Summerville–Trion corridor.
The remaining 2025 classes reinforce the difference between a heavily wooded county and a compact settlement pattern. Shrubland accounts for 3.44% and grassland for 2.97%. Open water and wetlands occupy much smaller shares in the separate forest-and-farmland summary. The small percentages do not mean streams and wet ground are unimportant; narrow features can cover little area even when they matter greatly to drainage, habitat, or the character of a valley.
Chattooga County’s own website places the county in the rolling foothills of the Appalachian Mountains, while county planning documents discuss its Ridge and Valley setting. That terrain helps explain why the map contains long wooded bands beside more open strips rather than one uniform patchwork. A land-cover map cannot prove why a particular field or forest occupies a particular parcel, but it can show how strongly the broad surface pattern follows the county’s alternating uplands and valleys.
Farm and pasture openings break up the western forest
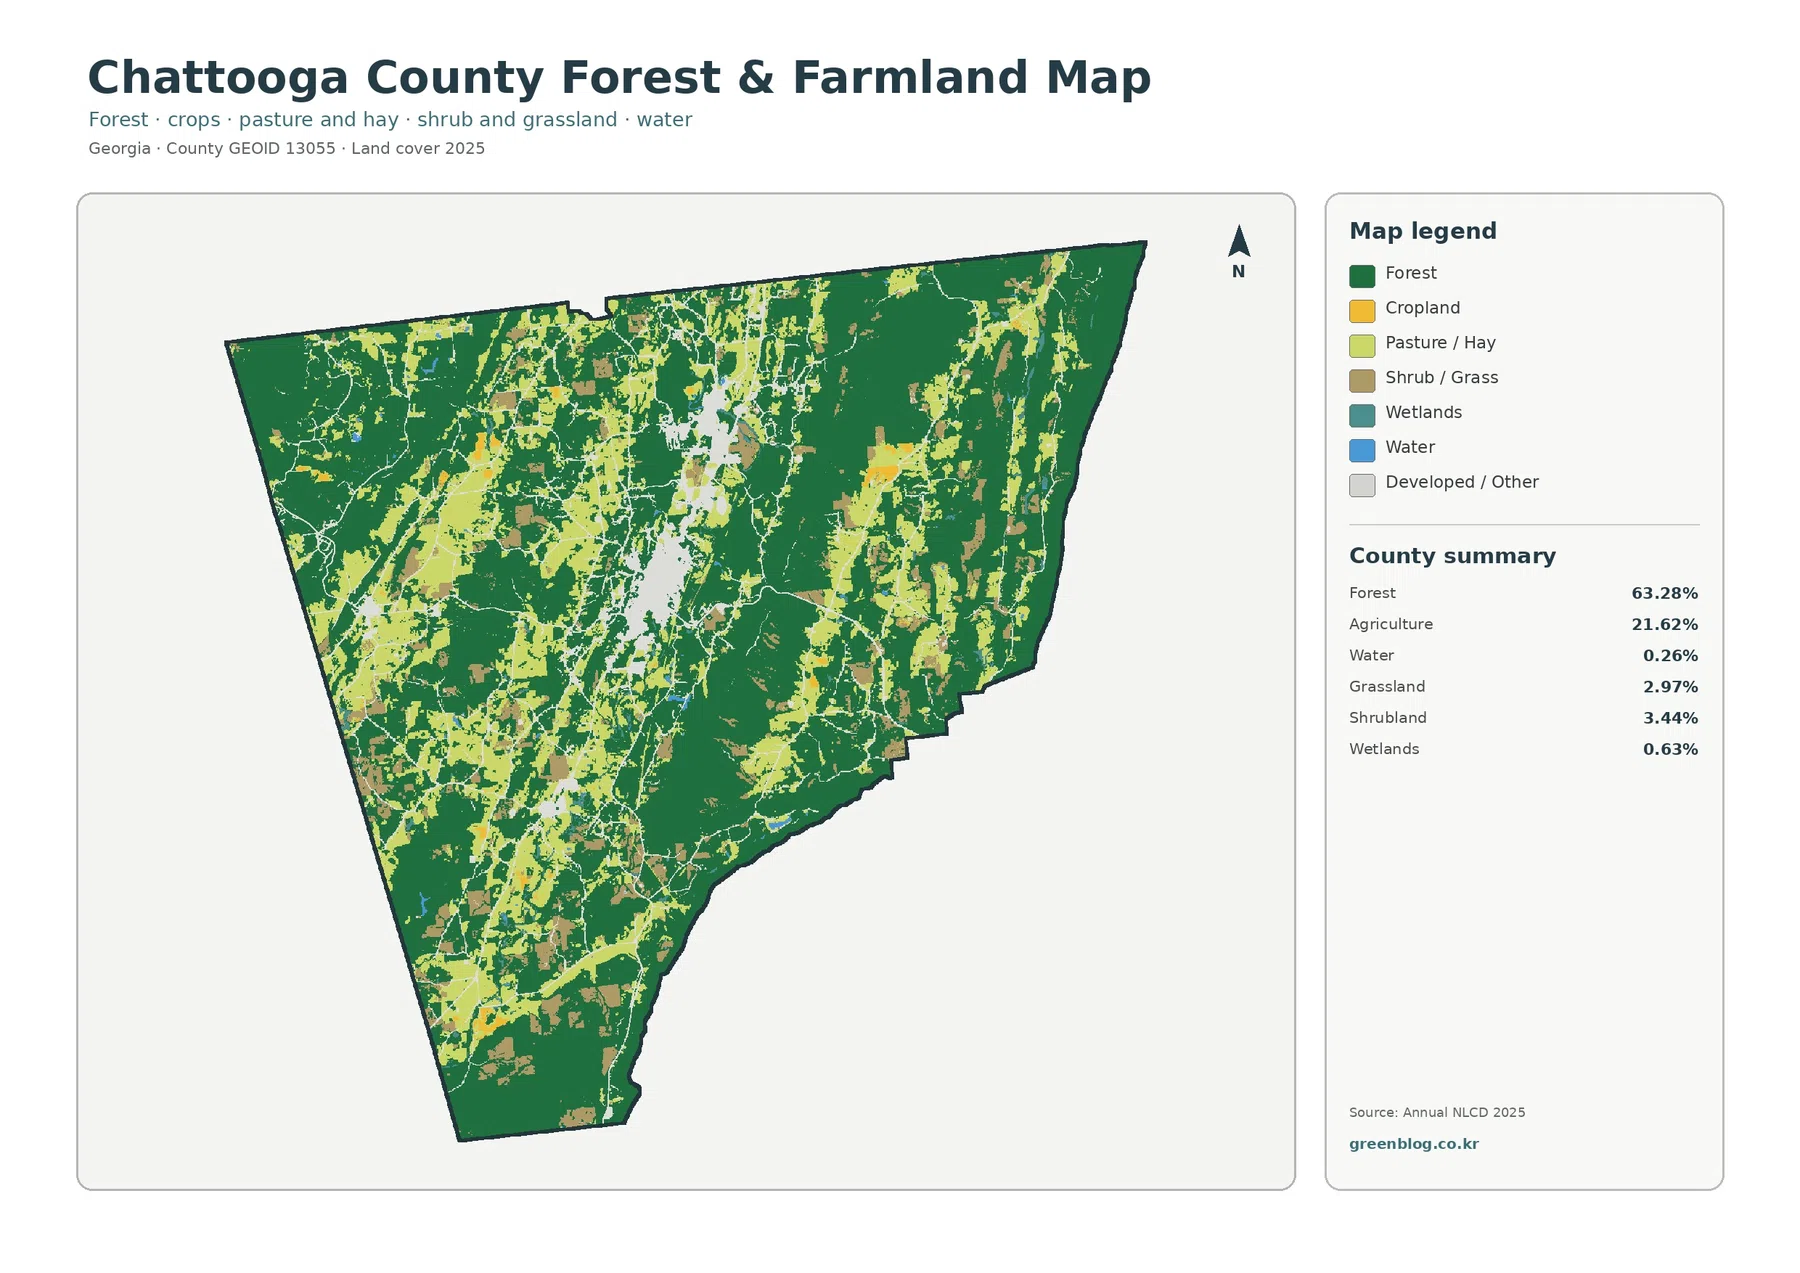
The forest-and-farmland version makes the agricultural pattern easier to follow. Forest remains the largest class at 63.28%, but agricultural land at 21.62% appears as substantial openings rather than isolated dots. Those openings are most frequent through the west, southwest, and parts of the central valley. The eastern side stays much more continuously green, although smaller clearings and nonforest strips appear there as well.
In practical terms, this view is more useful than the general map when the question is about the relationship between working land and wooded terrain. Pasture, hay, and cropland can be distinguished from the surrounding forest instead of being lost among several developed and natural classes. The result is a clearer picture of where open land is broad enough to form a recognizable belt and where it narrows into small clearings between wooded slopes.
Local context matters here. The county’s historical description refers to the fertile Chattooga Valley and its agricultural history, while the University of Georgia Extension office provides current agriculture, soil, forage, water, and natural-resource services in the county. Those sources support the importance of agriculture as a local land context, but the map itself does not identify crop type, ownership, farm productivity, or whether a field is actively managed in any particular season.
Water covers 0.26% and wetlands 0.63% in the supplied summary. The Chattooga River gives the county its name and runs through the region, yet a narrow river can occupy only a small percentage of a countywide 30-meter grid. Readers looking for stream channels, flood zones, riparian boundaries, or wetland jurisdiction should use dedicated hydrography and regulatory sources. Here the blue and wetland classes are best treated as one part of the land-cover picture rather than a complete water map.
Impervious cover isolates the roads and town centers
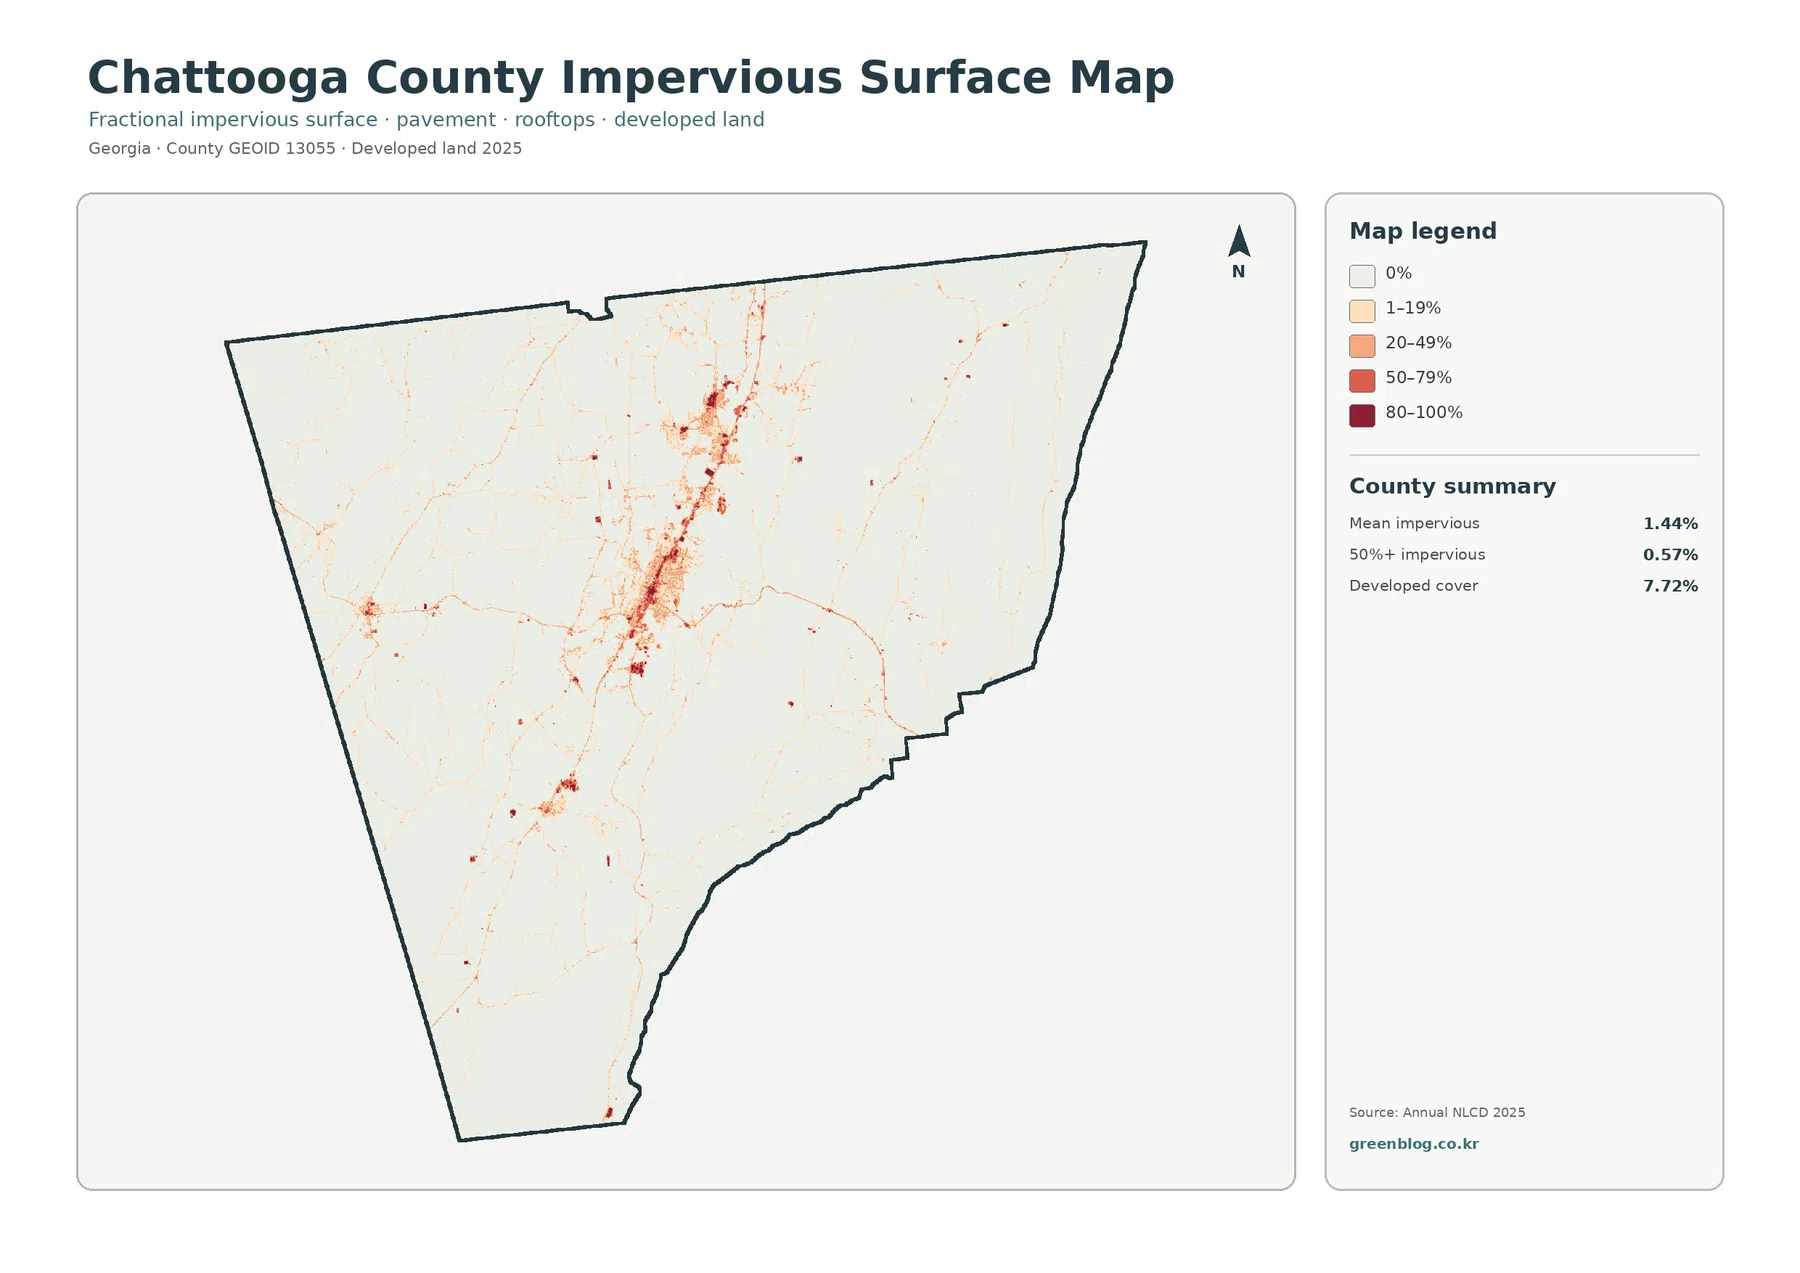
The impervious-surface image strips away most of the vegetation colors and reveals how limited the hard-surface footprint is across the county. Mean impervious cover is 1.44%, and only 0.57% of the county falls in cells that are at least 50% impervious. Those values are far below the 7.72% developed-cover figure because developed classes can contain lawns, trees, exposed soil, and other surfaces that still absorb water.
The strongest reds run through the middle of the county, where the Summerville and Trion settlement corridor is located. Small linear traces extend outward from that core and smaller clusters appear to the south and west. This pattern is useful for separating the presence of development from the intensity of pavement and rooftops. A broad developed class may include low-density residential land, while the darkest impervious values identify much harder surfaces within that broader area.
Official planning material places Summerville at the junction of U.S. 27 and several state routes and places Trion along the same highway to the north. That information helps orient the central line of hard surfaces without pretending that the land-cover map contains a transportation layer. For exact road names, municipal boundaries, or right-of-way width, a current road or local GIS map remains the better source.
Impervious cover is often used as one clue in discussions of runoff and development, but it is not a flood-risk map. Slope, soil, rainfall, drainage structures, stream location, and stormwater systems all matter. The supplied image is most defensible as a countywide comparison of where hard surfaces are concentrated and where they are sparse. Site-scale drainage or engineering decisions require finer data and field information.
The 1985–2025 comparison is mostly a mosaic of several kinds of change
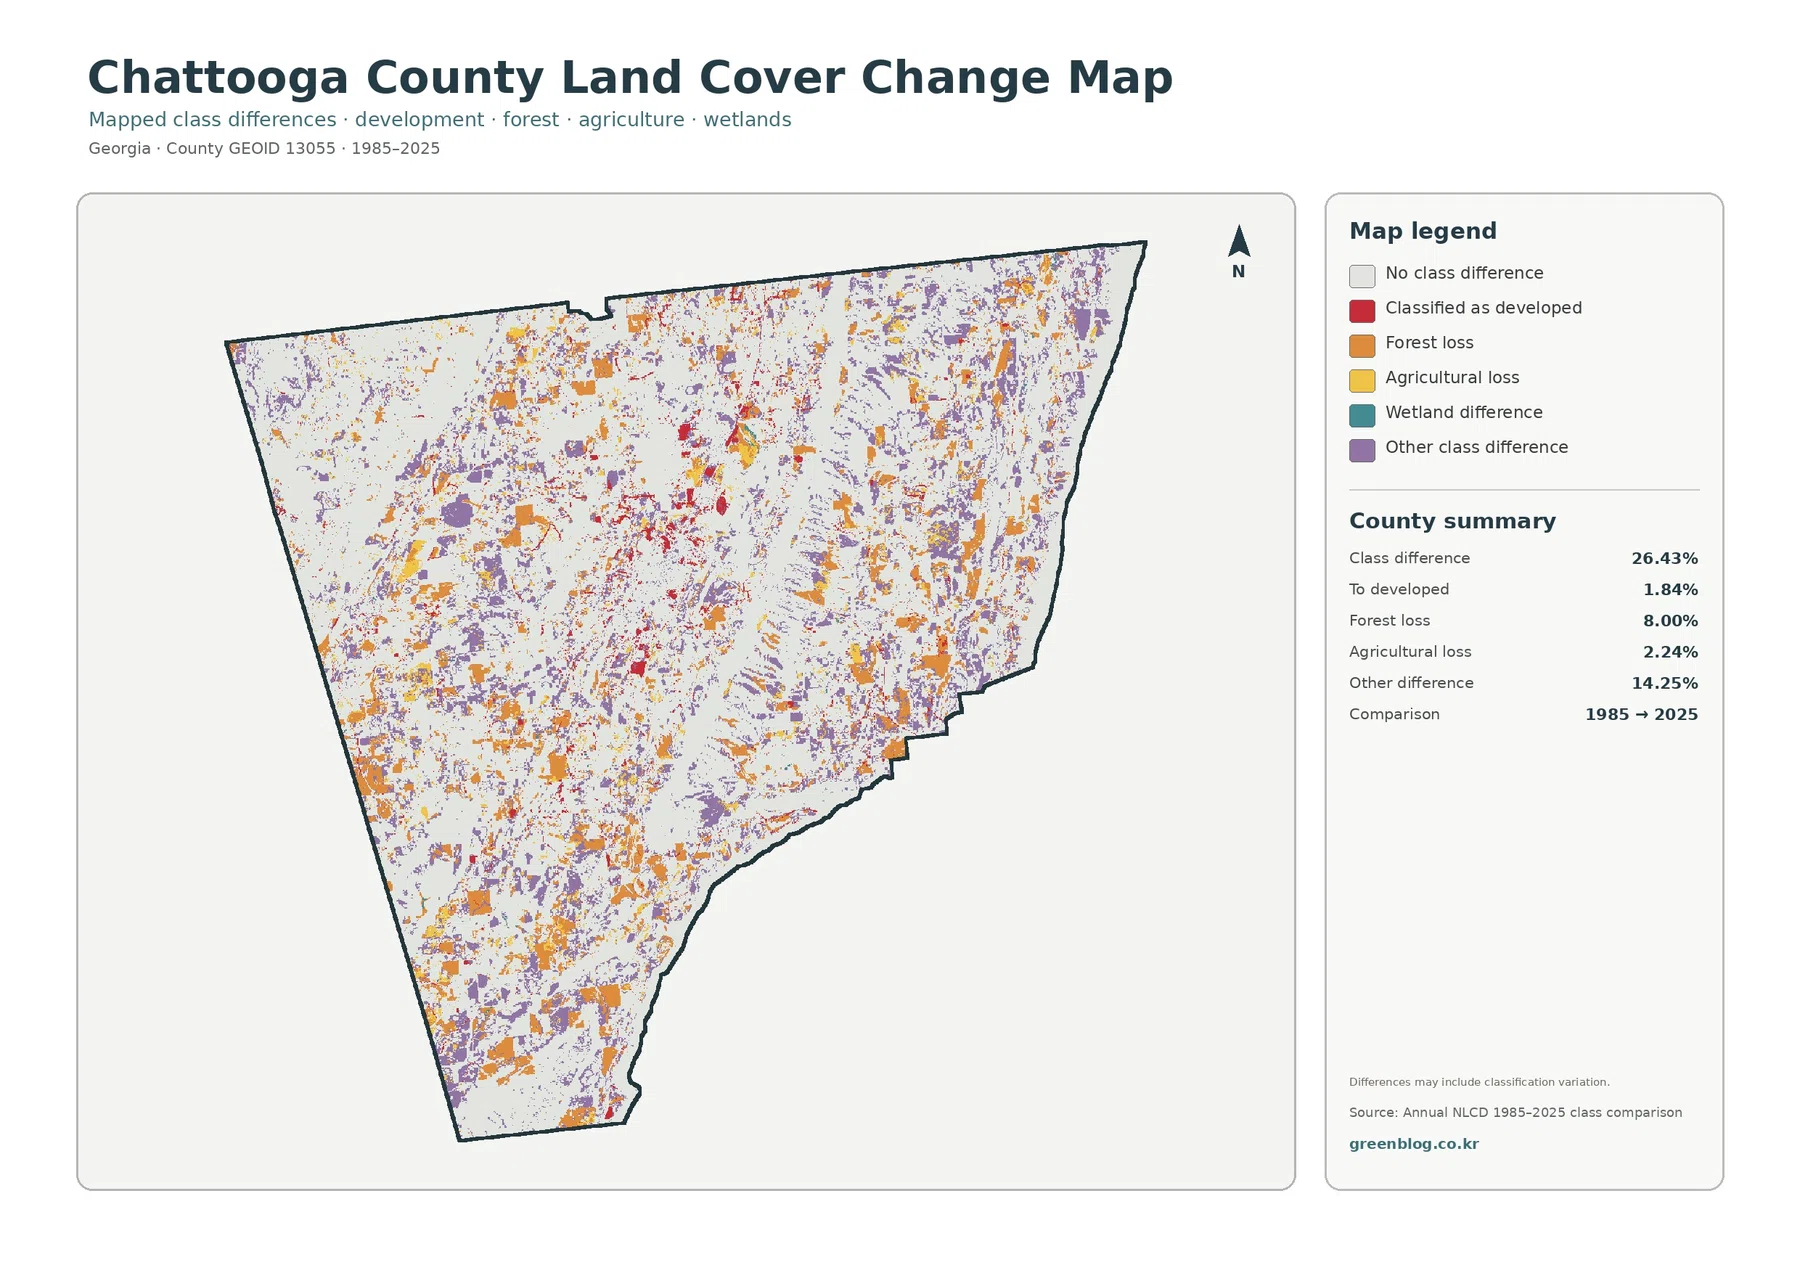
The change summary reports a class difference for 26.43% of the county between 1985 and 2025. Of the total county area, 1.84% is mapped as a change to developed, 8.00% as forest loss, 2.24% as agricultural loss, and 14.25% as other class difference. Because the “other” category is the largest named part of the changed area, the full 26.43% cannot reasonably be described as development or deforestation.
Orange forest-loss patches appear across multiple parts of the county, including both western openings and the more heavily wooded east. Red cells classified as developed are more noticeable around the existing central settlement pattern but also occur in smaller scattered locations. Purple “other difference” cells are widespread. The image therefore reads as a patchwork of several transitions rather than one simple front of urban expansion.
It is equally important to understand what this map does not say. It compares two endpoints. It does not identify the exact year of a change, prove the cause, or show whether a place changed more than once in the intervening decades. Timber harvest and regrowth, agricultural rotation, vegetation succession, construction, and classification variation can all create different endpoint classes. The supplied map itself notes that differences may include classification variation.
A careful use of the change map is to identify places that deserve a closer look. A student might compare the central developed corridor with nearby forest-loss cells, or examine why some large 2025 forest blocks still contain many orange and purple differences. A planner or researcher could then move to annual imagery, aerial photographs, local records, or higher-resolution data. The countywide comparison is a screening view, not a complete land-history record.
Frequently Asked Questions
Why does Chattooga County have 7.72% developed cover but only 1.44% mean impervious cover?
Developed land can include lawns, trees, soil, and other permeable surfaces around homes, businesses, and roads. Impervious cover focuses on hard materials such as pavement and rooftops. The broader developed class therefore covers more area than the countywide mean percentage of hard surface.
Does the 63.28% forest figure mean all of that land is protected forest?
No. The value describes surface cover classified as forest in the 2025 dataset. It does not identify ownership, public land, conservation status, timber management, or zoning. Those questions need separate property and land-management records.
Is the 26.43% 1985–2025 class difference the same as the amount of land permanently changed?
No. It is the share of cells assigned different endpoint classes. The value includes 1.84% mapped to developed, 8.00% forest loss, 2.24% agricultural loss, and 14.25% other class differences. It does not reveal the exact timing, permanence, or cause of each difference.
Scale, classification, and local-use limits
Annual NLCD products generalize the land surface into 30-meter raster cells. A cell may contain a road edge, lawn, trees, a small building, and bare ground, yet the classification still has to summarize that space. This is one reason small features can disappear or a boundary can look blocky when zoomed in. The consistent grid is valuable for countywide comparison, but it should not be mistaken for a survey.
Land cover also differs from land use. Forest color does not mean public forest, protected land, or a conservation easement. Agriculture color does not establish agricultural zoning. Developed color does not define a municipal boundary, and wetland color is not a legal wetland determination. Those questions require parcel, zoning, ownership, conservation, or regulatory datasets from the responsible agencies.
The observation year matters as well. Construction, timber activity, crop changes, vegetation recovery, storms, or other surface changes after 2025 will not appear in a 2025 layer. Chattooga County and Georgia DCA maintain current local-government and comprehensive-planning information, so any decision involving permits, future growth, roads, or land policy should start with those current records rather than this static map set.
Four original JPG maps in one download
The ZIP package contains one original JPG for 2025 land cover, forest and farmland, impervious surface and developed land, and the 1985–2025 land-cover comparison. Use one file when a narrow topic is enough, or combine the current and specialized views when a report needs both the broad county pattern and a closer look at development, farming, or change.
Map File Information
The ZIP contains four original JPG maps for comparing Chattooga County’s 2025 forest and farmland pattern, the Summerville–Trion hard-surface concentration, and mapped class differences from 1985 to 2025.
- Included Files: Four original JPG land-cover maps
- File Type: JPG files in one ZIP archive
- Intended Use: Printing, education, presentations, and map-based projects
Related Maps
- Appling County Georgia Land Cover Map
- Atkinson County Georgia Land Cover Map
- Bacon County Georgia Land Cover Map
Sources and Reference Data
- MRLC Annual NLCD Data – official access point for annual land-cover and comparison products
- USGS Annual NLCD Land Cover Classification – official class definitions and guidance for forest, agriculture, developed land, wetlands, and related categories
- U.S. Census Bureau TIGER/Line Shapefiles – official county-boundary reference data
- Georgia DCA – Chattooga County Comprehensive Plan – planning documents for Chattooga County, Menlo, Lyerly, Trion, and Summerville
- Chattooga County Official Website – county geography, history, and Summerville context
- UGA Extension – Chattooga County Agriculture & Natural Resources – local agriculture, soil, forage, water, and natural-resource information
Green Map creates custom-edited map images using open geographic data sources such as geoBoundaries, Natural Earth, OpenStreetMap, and government open data. These maps are edited visual materials, not raw data files, and are provided for education, documents, presentations, and graphic reference.