Forest still covers more than half of Cherokee County in the supplied 2025 data, but the county is far from uniformly wooded. Forest accounts for 55.67% of the mapped area and developed land for 29.49%. The largest built footprint spreads across the south and continues through the center, while broader forest blocks remain to the north and west. This Cherokee County Georgia Land Cover Map is designed to make that contrast easy to see.
The page pairs four views: 2025 land cover, forest and farmland, impervious surface, and a 1985–2025 class comparison. The WebP images are useful for reading the article, while the four original 2480 × 1754-pixel JPG maps are available together in one ZIP for county profiles, lessons, presentations, and other reference work.
Table of Contents
A forest-majority county with a large built footprint in the southern half
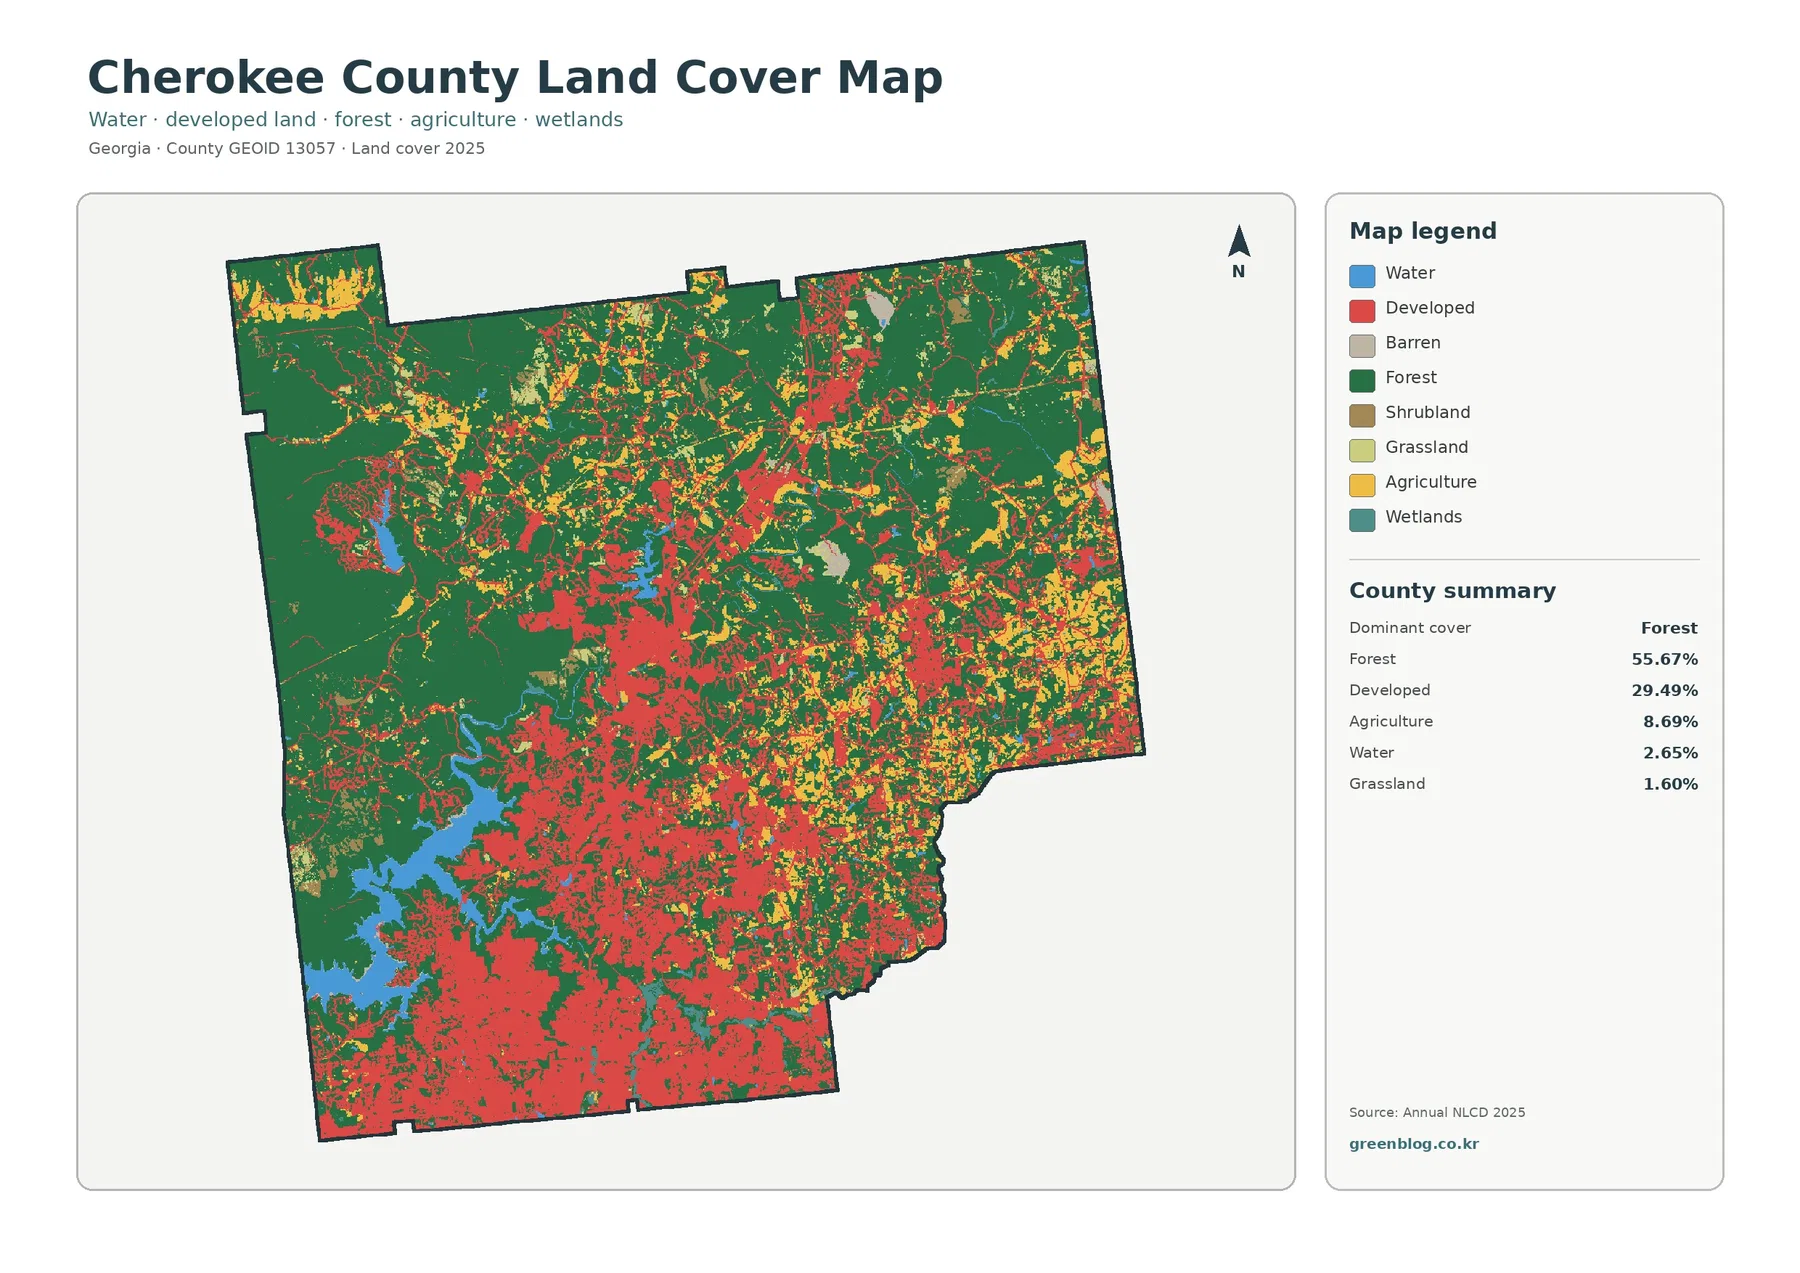
The geography of those classes matters as much as the totals. Red developed cells dominate much of the southern portion and form a broad, connected area through the south-central part of the county. A narrower string of developed cells continues north through the middle, with additional clusters in the northeast. Forest is more continuous in the northwest, along the western side, and across several northern blocks. The result is a clear south-to-north change in the amount and continuity of built land, even though development is not confined to one single center.
Hard surfaces form a connected southern-to-central pattern
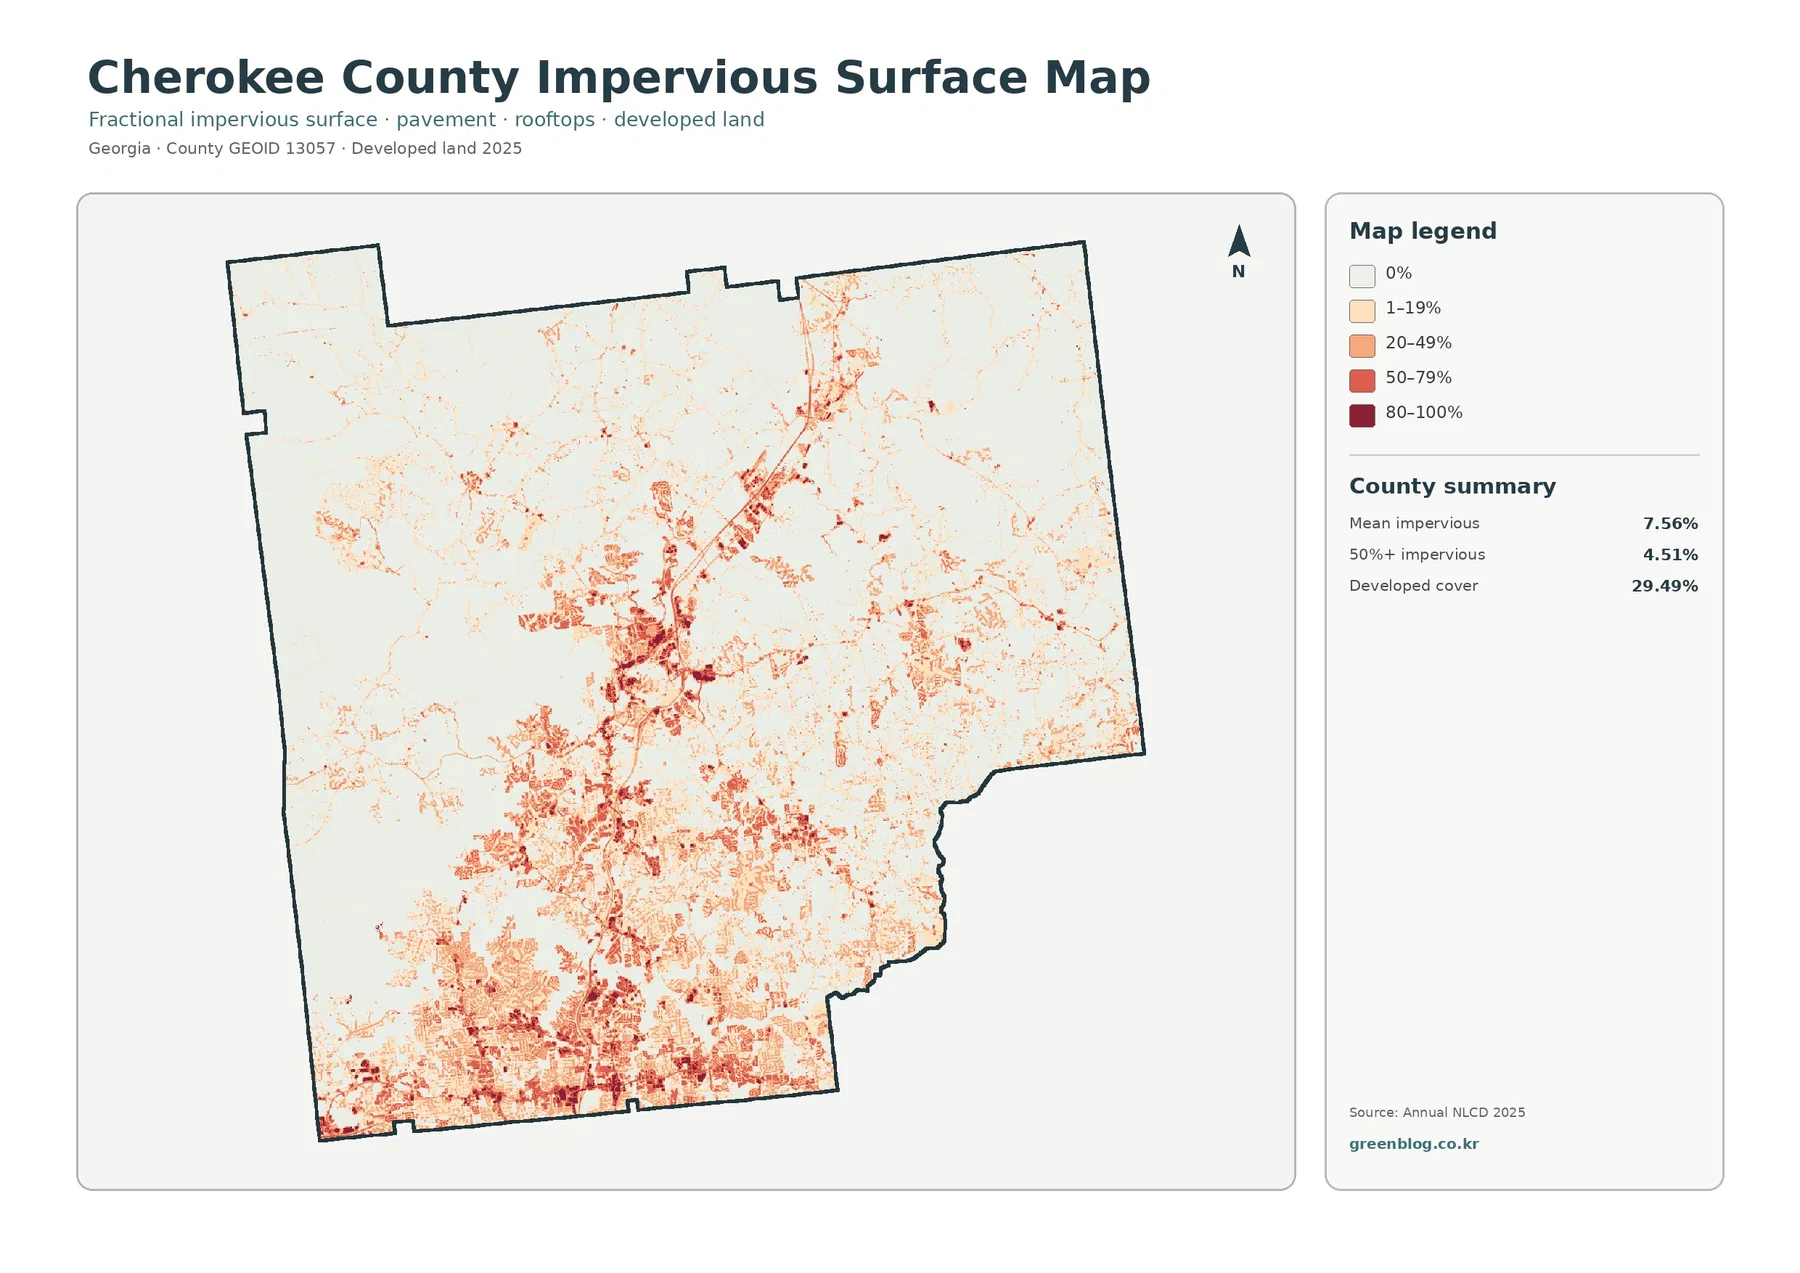
The impervious map helps explain what the 29.49% developed figure does and does not mean. Mean impervious cover is 7.56%, and 4.51% of the county is mapped with at least 50% impervious cover. Developed classes can include lawns, scattered trees, bare soil, and other permeable surfaces around buildings and streets. Impervious cover narrows the question to roofs, pavement, parking areas, and similar materials that shed water rather than absorbing it. That is why the impervious percentages are much lower than the developed-land percentage.
The darkest and most continuous hard-surface concentrations occur in the south. From there, a conspicuous north–south band runs through the central part of the county, with smaller branches and isolated clusters extending outward. The northwest is much lighter, matching the large forest blocks seen on the general land-cover map. The northeast contains scattered impervious concentrations, but they are less continuous than the large southern footprint. This map is especially useful when the question is about the intensity of built surfaces rather than the broader developed class.
Forest remains broad outside the developed south, while farmland is scattered
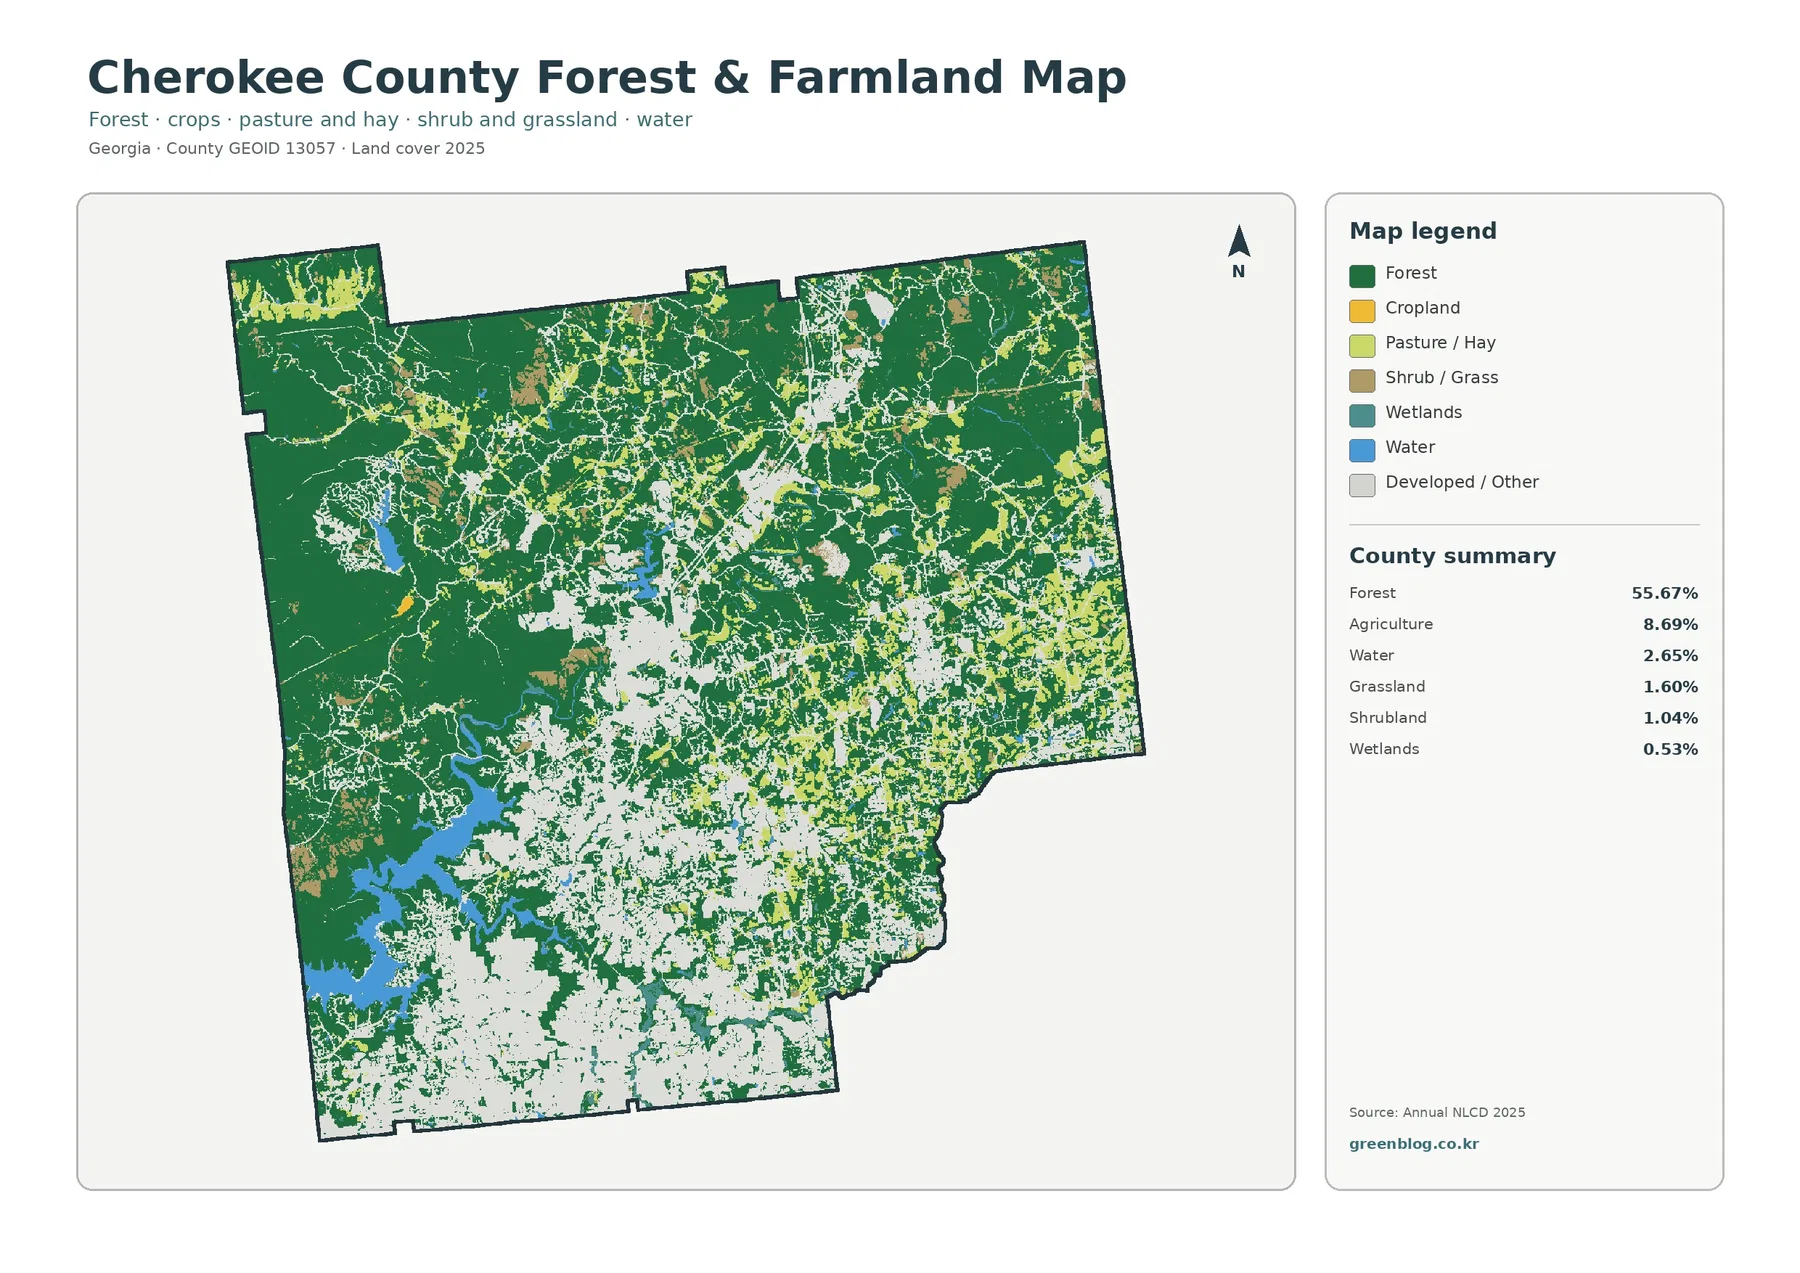
Removing the detailed developed classes makes the forest pattern easier to follow. Dark green covers much of the northwest and western side, wraps around the large southwestern water area, and remains extensive across parts of the north and northeast. In the central and southern portions, forest is more fragmented by the white developed-or-other class. The 55.67% forest total therefore represents a mix of very large outer blocks and smaller pieces threaded through more developed areas.
Agriculture accounts for 8.69% and appears mainly as scattered cropland and pasture or hay patches. These openings are frequent in the north and east and occur in smaller pieces around the middle of the county. They do not form a broad agricultural plain. In the southern developed zone, farm-colored cells become more broken and isolated. The map is useful for showing that agriculture remains part of Cherokee County’s surface pattern without being the dominant land cover.
Open water covers 2.65%, but the large southwestern concentration makes it visually important. Wetlands are much smaller at 0.53% and appear as limited teal areas near water and drainage features rather than as a continuous wetland landscape. Shrubland at 1.04% and grassland at 1.60% fill additional small gaps between forest, agriculture, and developed land. Because these minor classes occupy relatively little area, they are best interpreted in relation to nearby forest, water, and farm patches rather than discussed as major countywide zones.
Development is the largest labeled change category in the 1985–2025 comparison
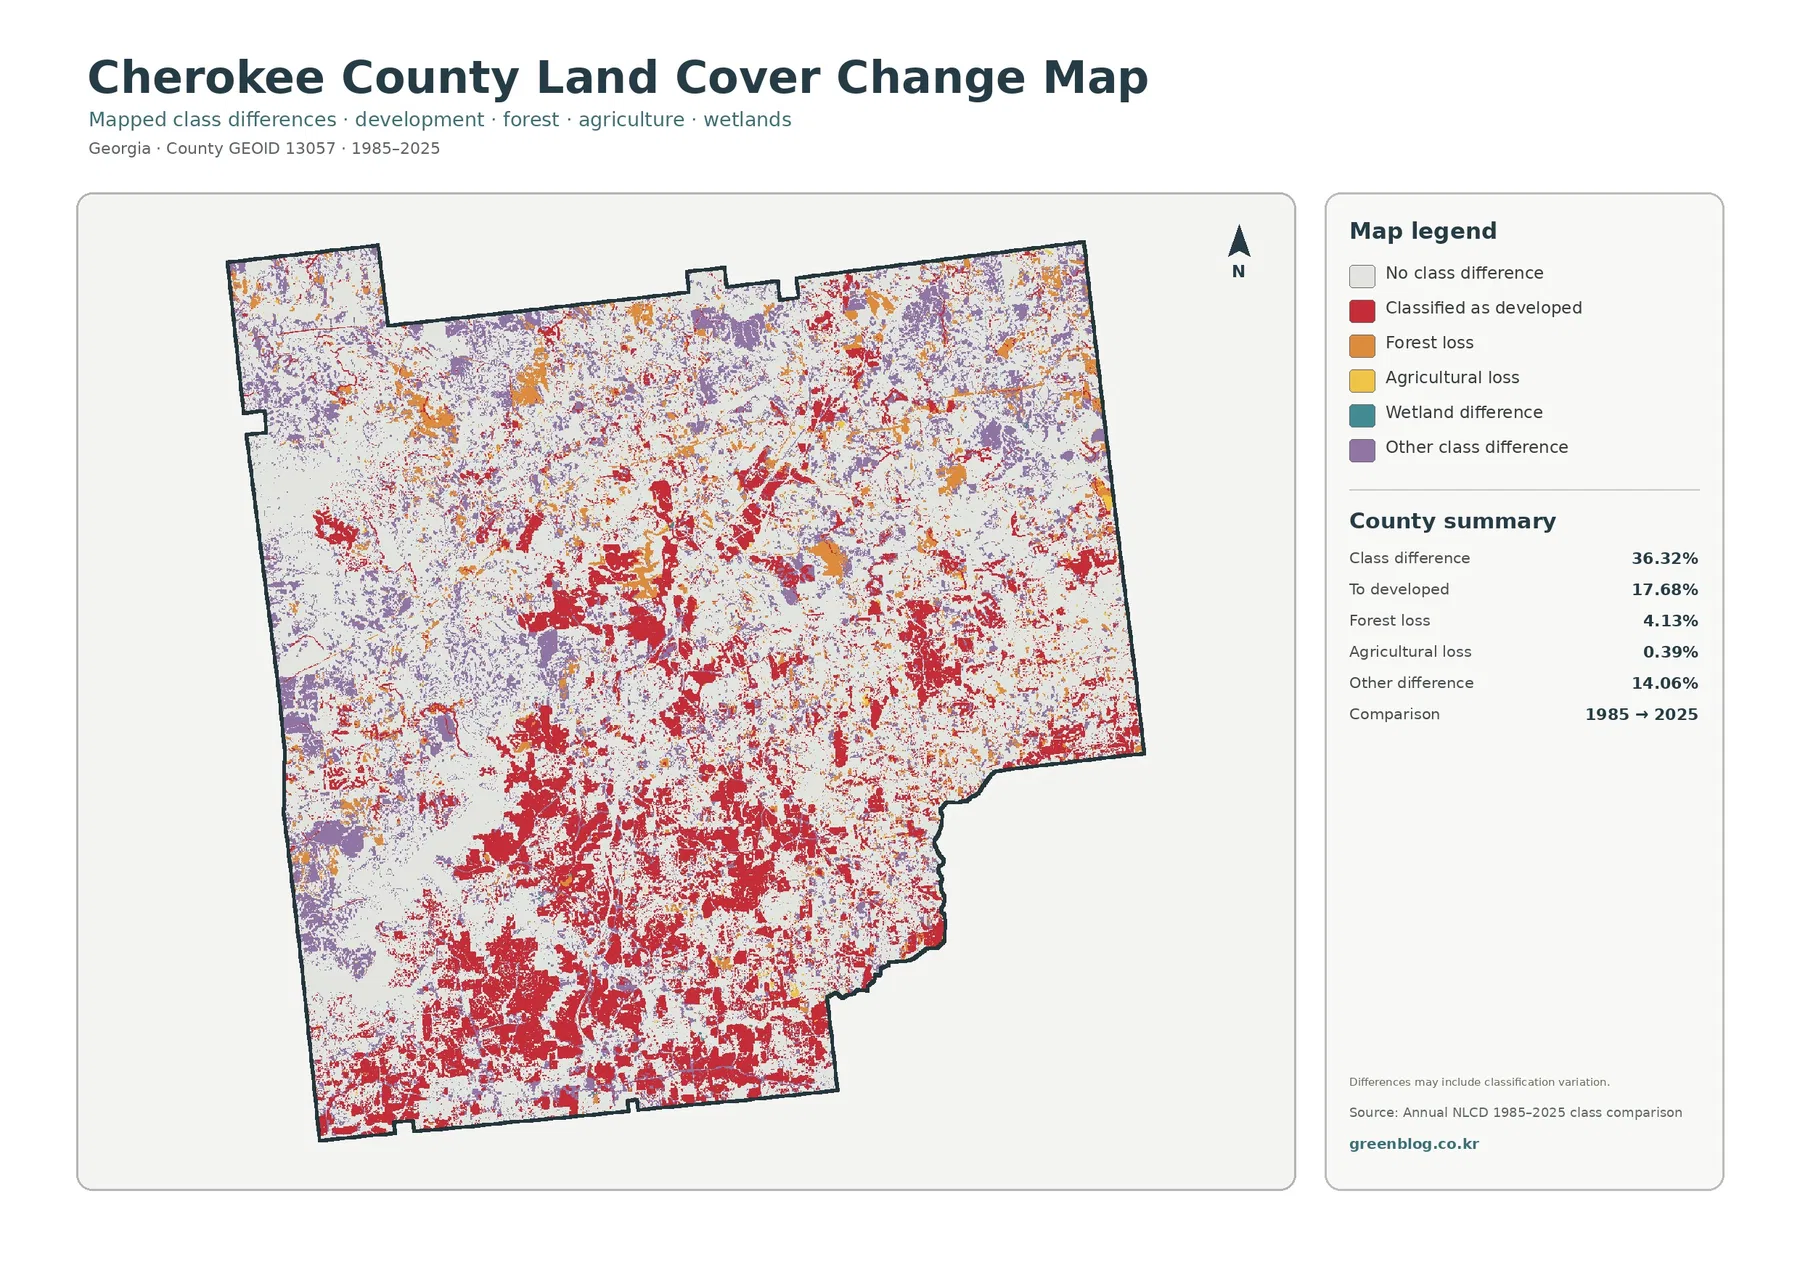
The comparison reports a class difference for 36.32% of cells between the 1985 and 2025 endpoints. Cells classified as developed in 2025 after another 1985 class account for 17.68%, making development the largest named change category in the summary. Forest loss is 4.13%, agricultural loss is 0.39%, and other class differences account for 14.06%. The map also identifies wetland differences in the legend, although the summary does not assign a separate percentage to that category.
Red development differences are especially widespread across the southern half and the central built belt. Additional red clusters appear farther north and east, while orange forest-loss patches are more scattered. Purple other-class differences occur across much of the county instead of following only the main developed areas. This distribution is important because it shows that the 36.32% overall difference is not simply a synonym for development; more than one type of endpoint difference contributes to that total.
The comparison must be read cautiously. It does not record every change that happened during forty consecutive years. It compares two classified endpoints, 1985 and 2025, and the map itself warns that differences may include classification variation. A cell can receive a different label because the surface actually changed, but imagery, seasonal conditions, or classification decisions can also affect the result. Determining the year and cause of a specific change requires intermediate imagery or local records.
Choosing the right map for a county profile, lesson, or comparison
A slide or printed handout usually reads better when one main map answers one question. A forest-focused lesson could use the forest-and-farmland map as the main figure and the general map as context. A discussion of built surfaces could use the impervious map first, then the general map to show what surrounds the hard-surface concentrations. A historical comparison can place the change image beside the 2025 image so the current southern developed footprint can be compared with the areas that changed class between the two endpoints.
Scale, classification, and administrative limits
Annual NLCD is a generalized raster product based on 30-meter cells. A cell can contain a house, lawn, trees, a driveway, and a small drainage feature while still receiving one predominant class or an impervious percentage. Enlarging the image cannot recover parcel detail that was never present in the source grid. These maps are therefore appropriate for countywide patterns and broad comparisons, not boundary surveys, property ownership, wetland jurisdiction, engineering design, or a permit decision.
The current land-cover views represent the supplied 2025 observation year. Later construction, vegetation management, farming changes, water conditions, or other surface changes may not be reflected. Cherokee County’s official GIS map collection provides separate road and future-development maps, and the county’s 2023 Comprehensive Plan guides future-development and service decisions. Those administrative sources should be used alongside, rather than replaced by, a land-cover classification. The 2480 × 1754 JPGs are not marked as meeting an A3 high-resolution reference, so test a large print before final use.
Frequently Asked Questions
Why does Cherokee County look heavily developed if forest still covers 55.67%?
The two covers are concentrated differently. Large forest blocks remain in the north and west, while developed land is strongly concentrated across the south and through the center. A dense built area attracts attention on the map even when forest is still the largest class after the whole county is totaled.
Does 29.49% developed land mean that almost a third of the county is pavement?
No. Developed classes can contain lawns, trees, soil, and other permeable surfaces around buildings and streets. Mean impervious cover is 7.56%, and 4.51% of the county is mapped at 50% or more impervious. Those measures focus more directly on hard surfaces such as pavement and rooftops.
Can the 36.32% class difference be treated as the exact amount of land that physically changed since 1985?
No. It is the share of cells assigned different classes at the two endpoints. The map notes that classification variation may be included, and only 17.68% is specifically summarized as classified to developed. Intermediate imagery and local records are needed to establish the timing and cause of a particular change.
Sources and Reference Data
- MRLC Annual NLCD Data – official access point for annual land-cover and comparison products
- USGS Annual NLCD Land Cover Classification – definitions and guidance for forest, developed land, agriculture, water, and related classes
- U.S. Census Bureau TIGER/Line Shapefiles – official county-boundary reference for Cherokee County
- Cherokee County GIS Maps – official county access to road, future-development, and other map products
- Cherokee County 2023 Comprehensive Plan – official planning page for the county’s comprehensive plan, future-development map, and community work plan
Map File Information
The ZIP contains the four original JPG maps used to compare Cherokee County's 2025 land cover, forest and farmland, impervious surfaces, and 1985–2025 endpoint class differences.
- Included Files: Four original JPG land-cover maps used in this article
- File Type: JPG images packaged in a ZIP archive
- Intended Use: Printing, education, presentations, and map-based projects
Related Maps
- Appling County Georgia Land Cover Map
- Atkinson County Georgia Land Cover Map
- Bacon County Georgia Land Cover Map
Green Map creates custom-edited map images using open geographic data sources such as geoBoundaries, Natural Earth, OpenStreetMap, and government open data. These maps are edited visual materials, not raw data files, and are provided for education, documents, presentations, and graphic reference.