Clarke County is one of the more urban land-cover profiles in Georgia, but the supplied 2025 data does not show a county covered end to end by pavement. Developed land accounts for 43.35%, while forest still covers 38.31% and agriculture adds 12.47%. This Clarke County Georgia Land Cover Map makes the contrast easy to see: Athens occupies a broad central developed area, while forest and working land become more common toward several outer edges.
Four views are included here: 2025 land cover, forest and farmland, impervious surface, and a 1985–2025 class-difference comparison. The WebP images are used for reading the patterns on the page, and the original 2480 × 1754-pixel JPG maps are available together in one ZIP. They can be used for county profiles, classroom comparisons, presentations, or as a visual starting point before consulting more detailed local GIS data.
Table of Contents
A broad Athens developed core is surrounded by a much greener outer county
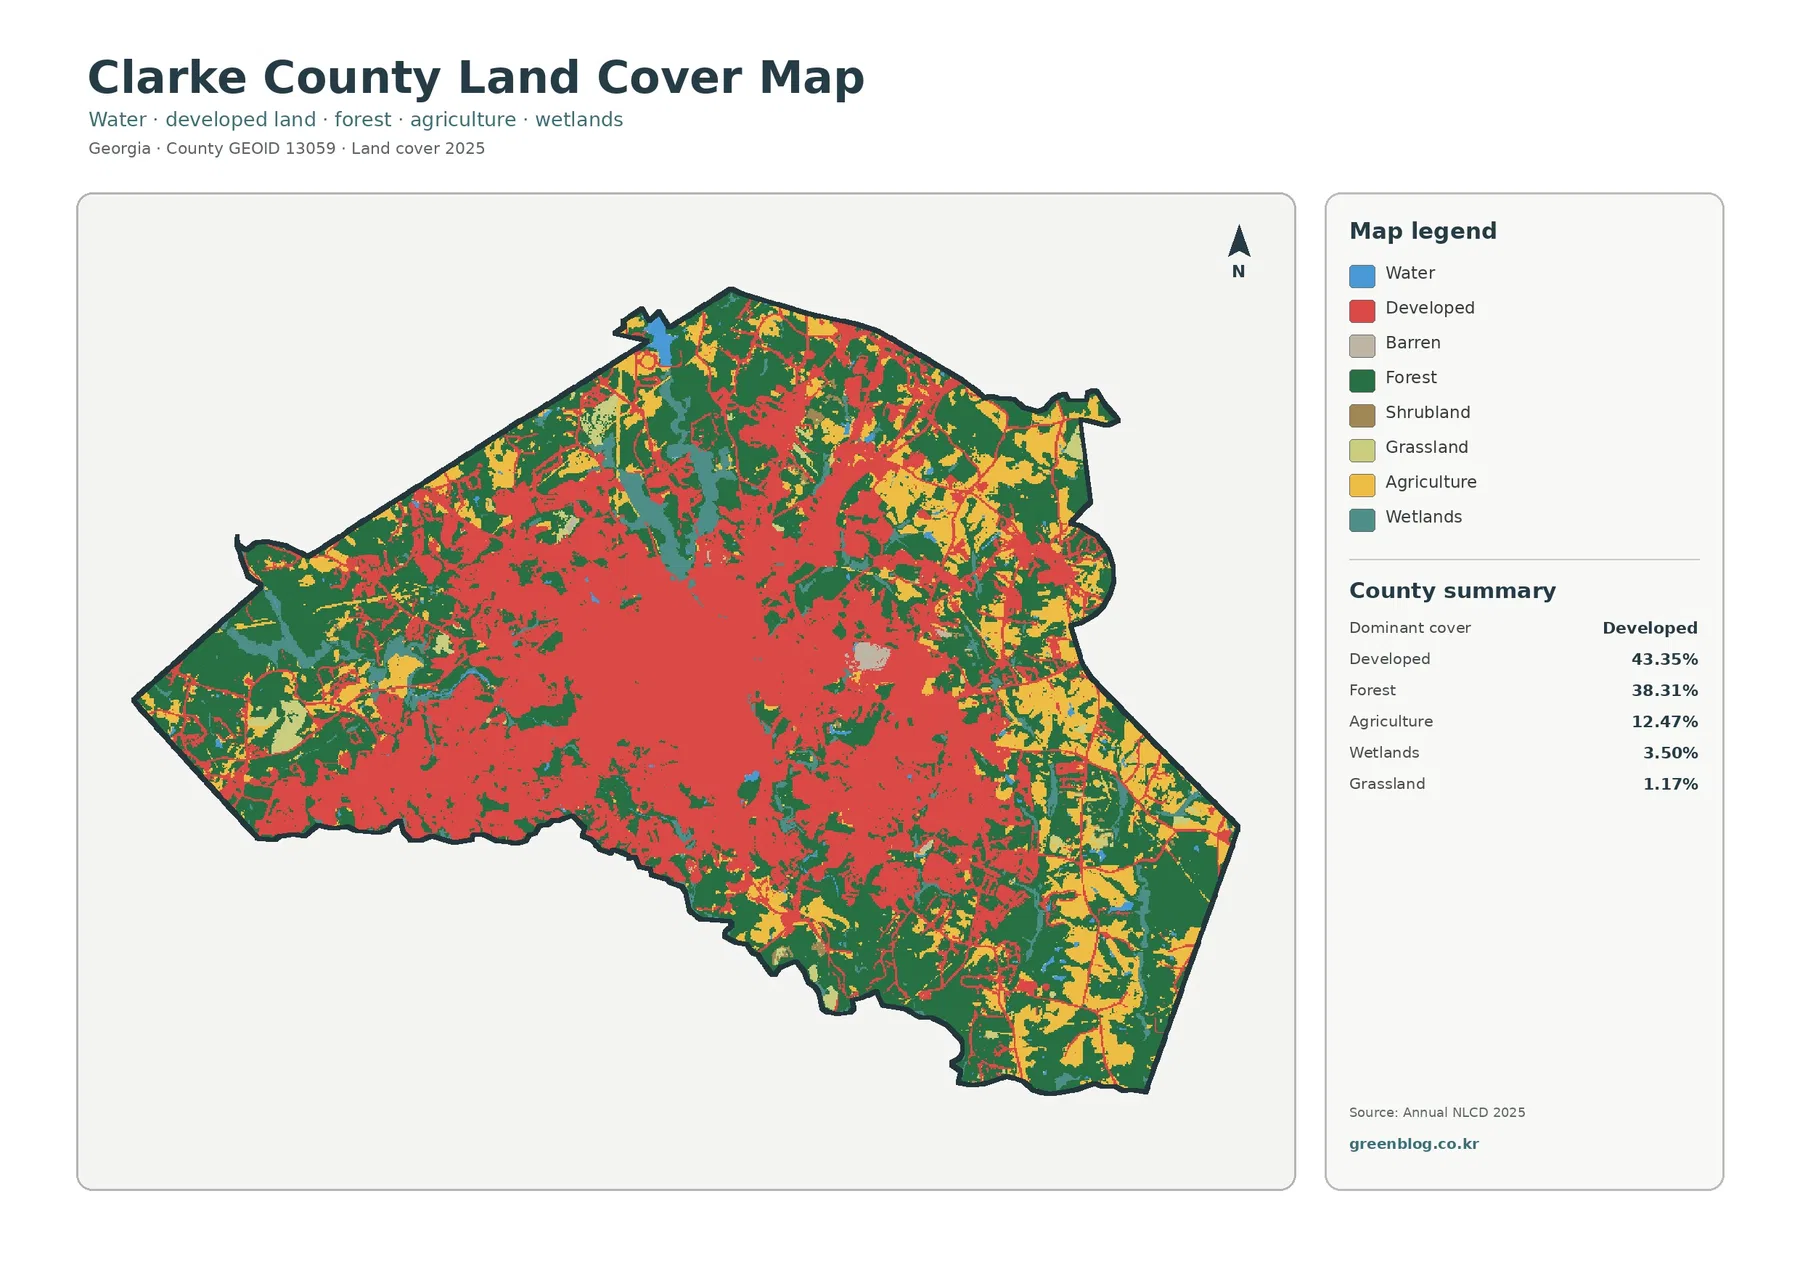
The first map is dominated visually by the red developed class through the center and much of the southwest. That concentration corresponds broadly with the Athens urban area, but the pattern becomes more broken toward the county limits. Dark-green forest occupies larger pieces along the north, west, east, and southeast edges, while yellow agricultural patches are especially noticeable on the eastern and southeastern side. The county therefore reads as an urban center with substantial forest and some farm or pasture cover still present around it, rather than as a uniformly built landscape.
The percentages reinforce that visual balance. Developed land is the largest class at 43.35%, but forest is only about five percentage points lower at 38.31%. Agriculture represents 12.47%. Smaller categories include wetlands at 3.50%, grassland at 1.17%, open water at 0.73%, and shrubland at 0.25%. Those smaller shares matter because they occur in narrow strips and scattered patches that can connect larger forest blocks or follow drainage areas, even though they do not occupy much of the county total.
Blue water and teal wetland cells are visible in several parts of the county, including within and beside developed areas. The map itself does not label waterways, so it should not be used to assign a name to every blue line or wet patch. For geographic context, the Athens-Clarke County government describes the North Oconee River and Middle Oconee River as central parts of the local greenway system, with natural corridors along the rivers and their tributaries. That official information helps explain why river and greenspace questions matter in an urban county, while the land-cover raster remains a separate, generalized surface map.
Forest and farmland stand out once the developed background is simplified
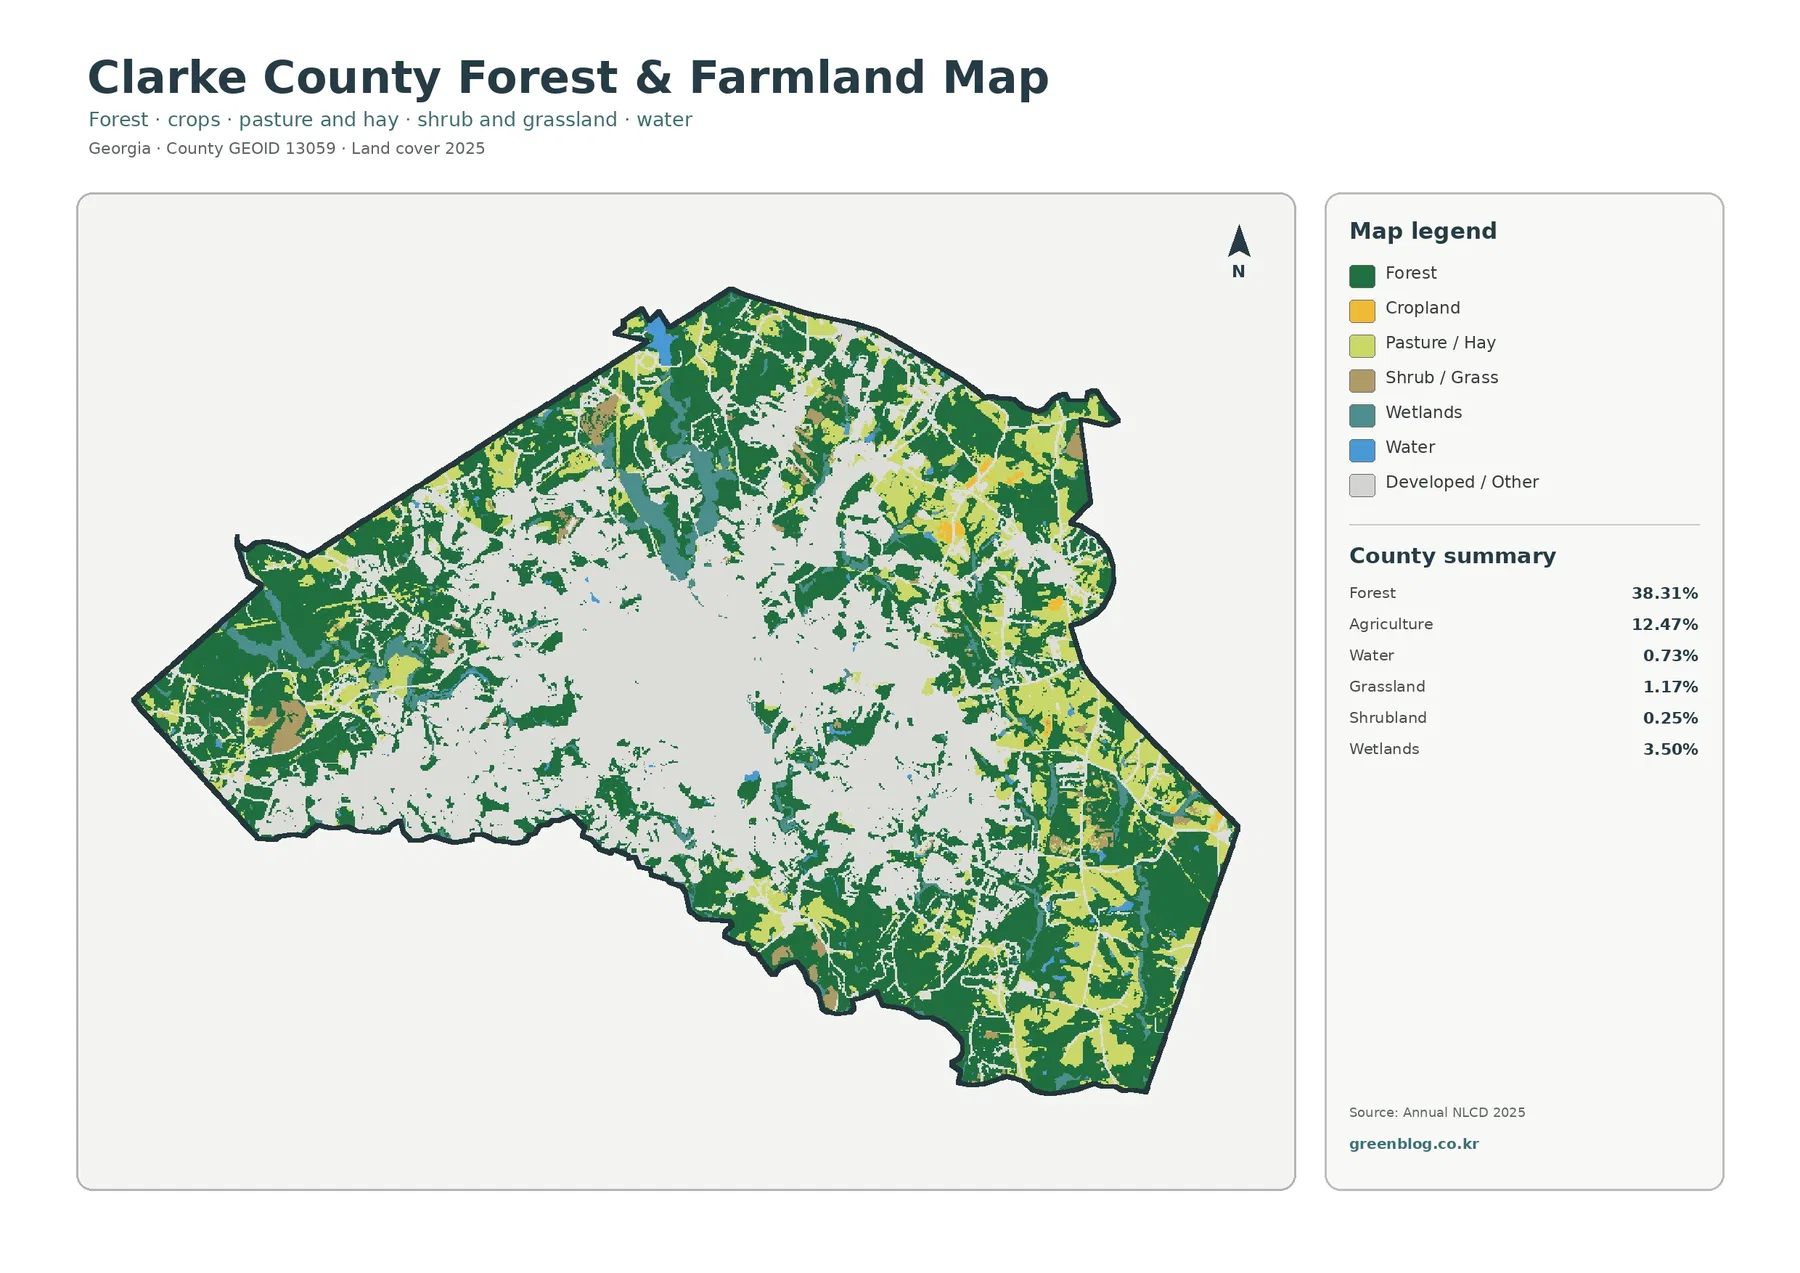
Removing the red developed class from the foreground changes the way the county looks. The center becomes a large pale area, while forest forms a clearer frame around it. The strongest green blocks appear along several outer sections, including the southeast and parts of the north and west. Smaller wooded pieces also penetrate the developed area, so the transition from Athens to the county edge is not a single clean boundary. The pattern is a mosaic of built surfaces, tree cover, fields, stream corridors, and smaller open spaces.
Agriculture covers 12.47% countywide, but its distribution is uneven. Yellow and light-green agricultural classes are more prominent on the east and southeast side, where they form repeated blocks between forest and developed or other surfaces. Smaller pieces occur elsewhere around the county. This makes the forest-and-farmland image useful when the subject is not the city itself but the remaining open and vegetated land around Athens. A general land-cover map can make these areas look secondary because the large developed core commands attention.
Wetlands and open water should also be kept separate. Wetlands can include vegetation or ground strongly influenced by water, while the water class represents exposed water surfaces. Clarke County’s summary reports 3.50% wetlands and 0.73% water. On the map, teal and blue features are narrow in many places, which is one reason a countywide percentage can look small even when the features are locally important. The Oconee Rivers Greenway system is a useful official companion source when a project needs named river corridors, trail context, or public greenspace information beyond what this raster map provides.
This image should not be treated as a farm parcel map. A cell classified as agriculture describes the observed surface category, not ownership, zoning, a conservation restriction, or permission to develop. Athens-Clarke County’s Planning Department maintains separate land-use, zoning, comprehensive-planning, and GIS resources for those questions. Using the two kinds of information together is reasonable, but substituting a land-cover class for a legal land-use designation is not.
Impervious cover reveals where the developed class is truly hard-surfaced
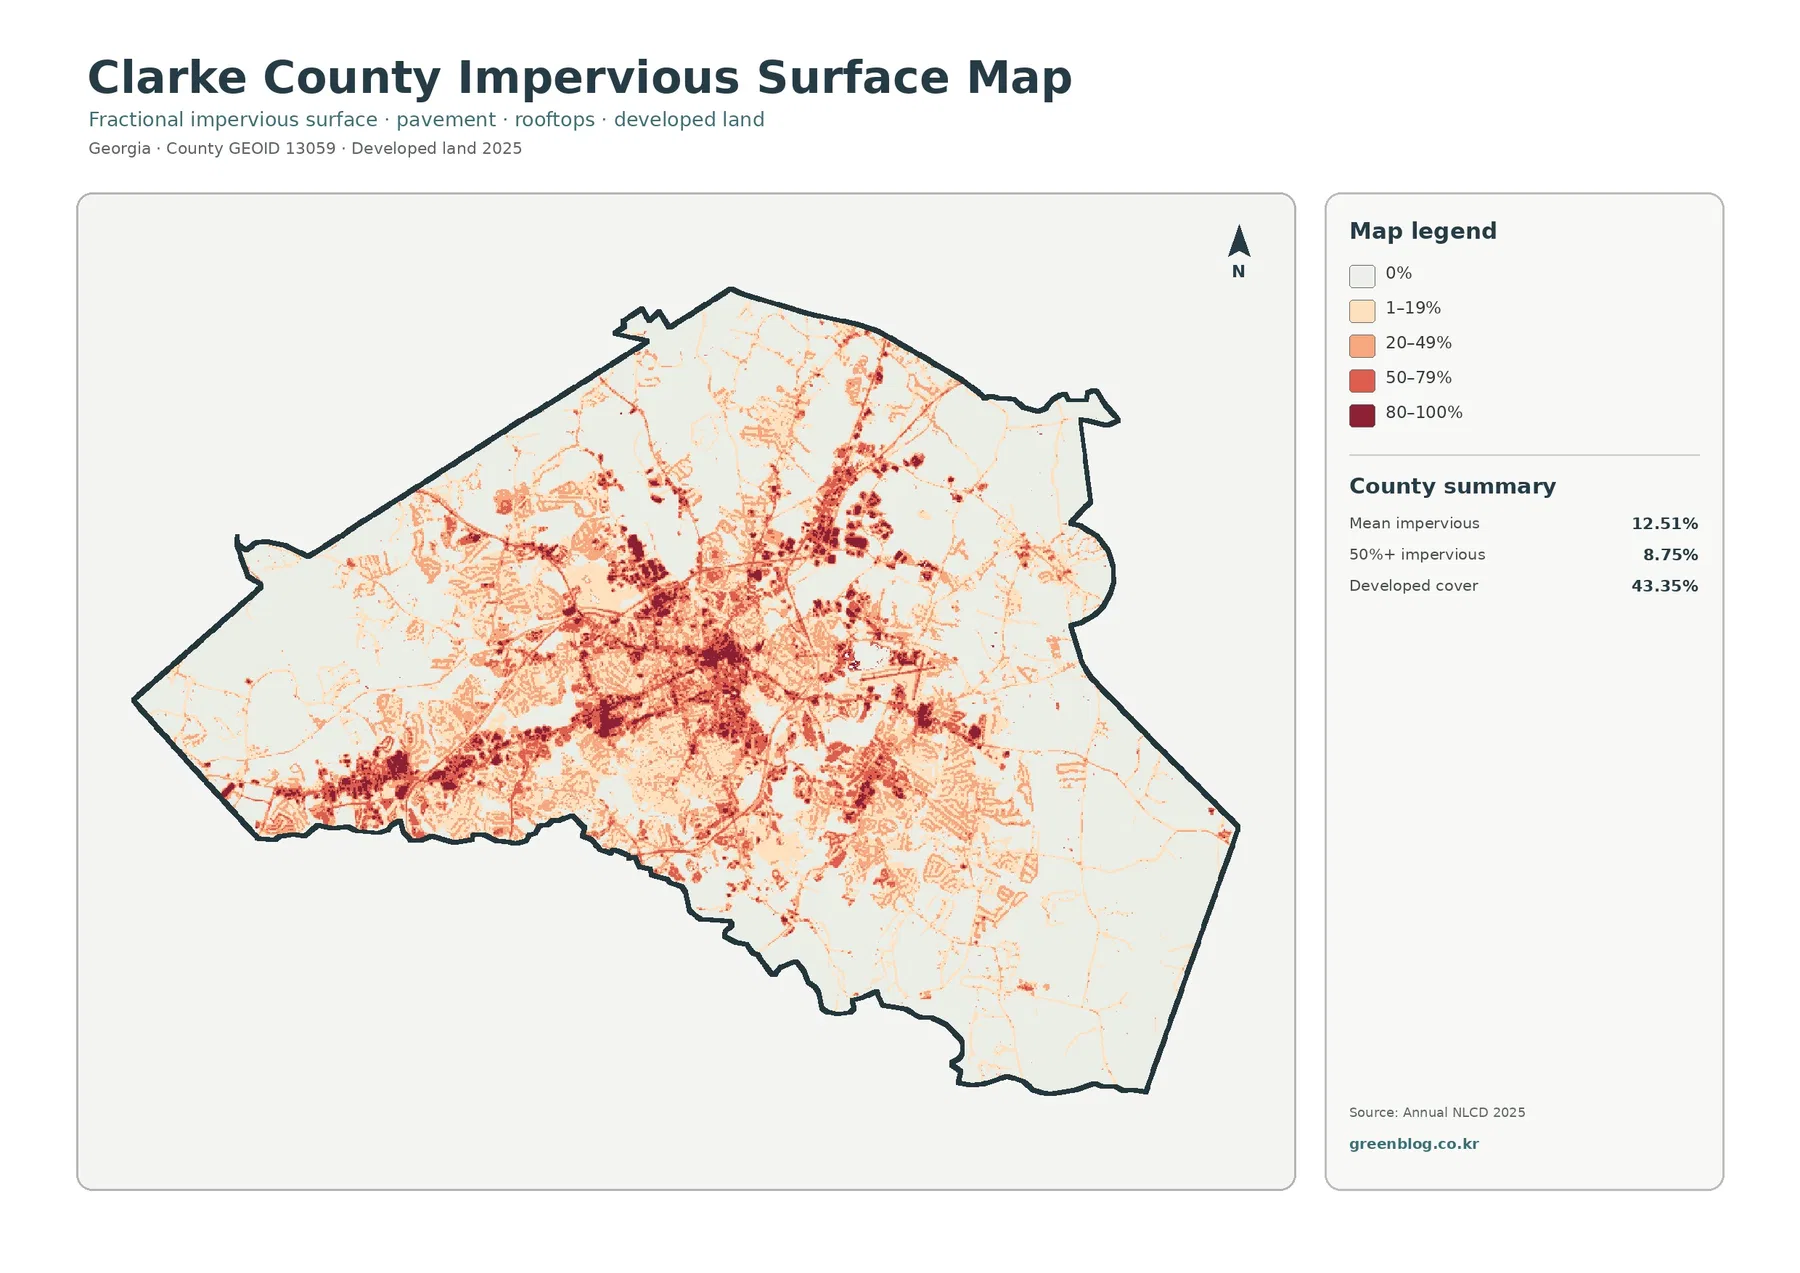
The impervious map answers a different question from the 43.35% developed figure. A developed land-cover cell may contain a house, lawn, trees, bare soil, driveway, and street together. Impervious percentage narrows the view to roofs, pavement, parking areas, and similar surfaces that do not readily absorb water. Clarke County’s mean impervious share is 12.51%, and 8.75% of the county falls in cells that are at least 50% impervious. That gap is expected because “developed” is a broader land-cover class than “hard surface.”
The darkest tones cluster in central Athens, with additional dense patches and linear traces extending away from the center. Medium and lighter tones form a larger web around those high-impervious areas. Toward the greener outer county, the darkest cells become much less common. The result is not a solid urban block but a network: a dense core, multiple built corridors and nodes, and lower-impervious areas between them.
That distinction is helpful for environmental education or a basic runoff discussion. A side-by-side comparison can show why two places classified as developed do not necessarily have the same amount of pavement. It cannot, however, predict flooding by itself. Drainage systems, topography, soils, rainfall intensity, stream levels, and many other factors affect runoff and flood behavior. For a property-level or engineering question, use current drainage, flood, elevation, and parcel information rather than inferring risk from this map.
The 1985–2025 comparison spreads change well beyond one downtown area
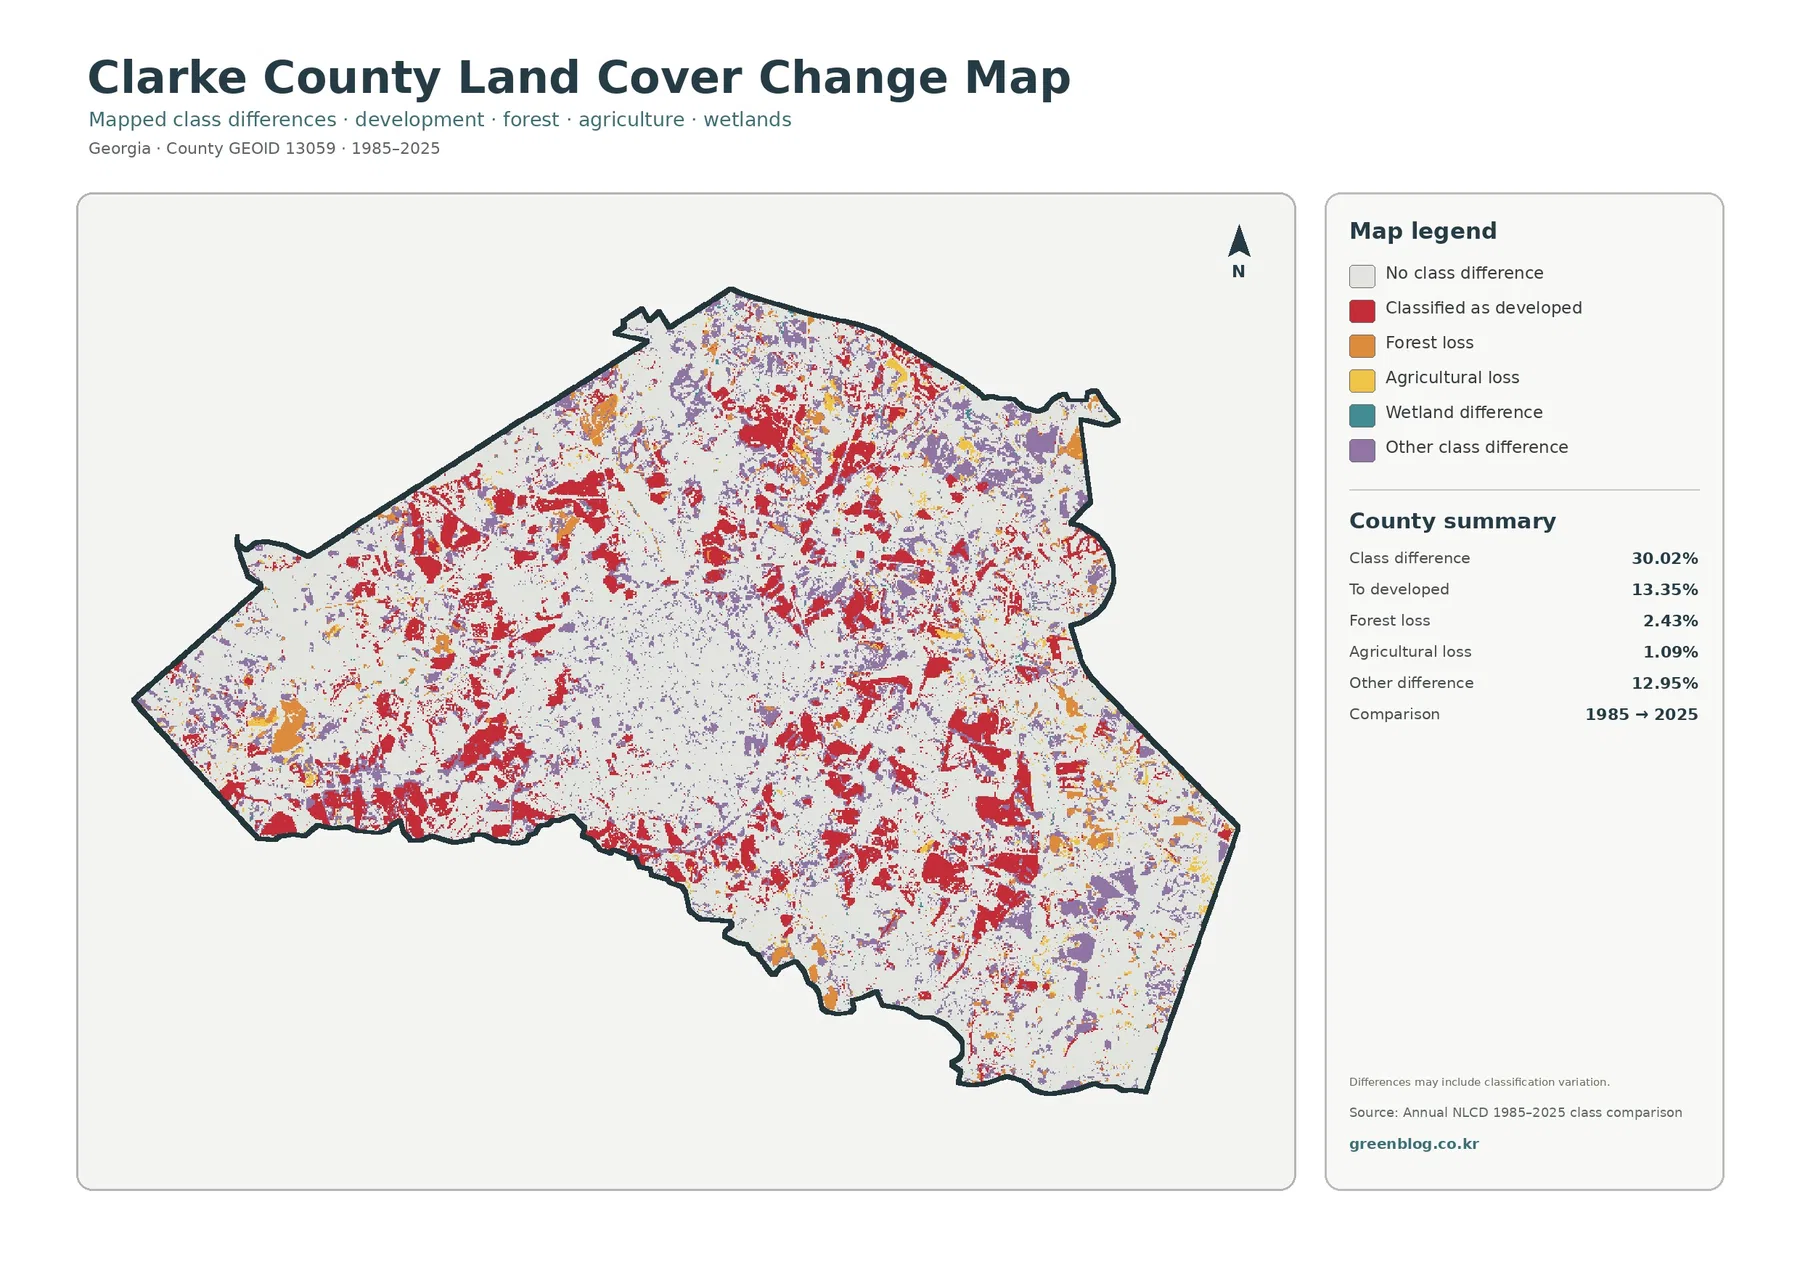
The change map reports a class difference across 30.02% of Clarke County between the 1985 and 2025 endpoints. The largest specifically identified component is 13.35% classified as developed at the 2025 endpoint after having another class in 1985. Forest loss accounts for 2.43%, agricultural loss for 1.09%, and other differences for 12.95%. Red development-related differences appear in and around the central county but also occur across northern, western, and southeastern sections.
A 30.02% class difference does not mean that 30.02% of the county was physically destroyed, paved, or newly built. It means the class assigned to those raster cells differs between the two endpoint products. Real surface change can be part of that total, but classification variation and mixed cells can contribute as well. Likewise, the 13.35% “classified as developed” figure does not provide the construction year or identify a particular subdivision, road project, or policy decision.
For historical investigation, the best use of this layer is to identify places worth checking more closely. A project could start with a cluster of red or orange cells, then compare intermediate-year imagery, older aerial photographs, or additional annual land-cover products. Local planning records may help with present-day context, but they should not be used to assign a cause to a 1985–2025 raster difference without evidence from the relevant period.
Choosing the right map depends on the question, not on which image looks busiest
For a general county profile, the 2025 land-cover map is the most efficient starting point because it shows the large Athens developed area and the surrounding forest and agriculture in one image. If the subject is tree cover, remaining open land, or the distribution of farmland, the forest-and-farmland version removes much of the urban visual weight. The impervious map is better when the difference between a developed lawn and a parking lot matters. The change layer belongs in a historical comparison because it is built around two dates rather than the current condition alone.
Two-map combinations can be especially useful. Pair the general map with the impervious view to explain why 43.35% developed land does not mean 43.35% pavement. Pair the general map with the forest-and-farmland view to show how much vegetation and agriculture remain around the city. Pair the 2025 map with the change image when the goal is to distinguish current cover from places whose class differs from 1985. Each pairing answers a different question without requiring the reader to interpret all four legends at once.
River and greenspace questions need one more layer of caution. The land-cover images contain water and wetland classes, but they do not label the North Oconee River, Middle Oconee River, individual tributaries, or park boundaries. Athens-Clarke County’s Oconee Rivers Greenway page is a better source for named corridors and public greenway information. Using that official context beside the raster can strengthen a presentation while keeping each source within its proper role.
Scale and classification limits matter in a compact, mixed urban county
Annual NLCD uses 30-meter raster cells. Each square receives a predominant class even when several surfaces share the same area on the ground. In Clarke County, where houses, lawns, tree canopy, streets, stream buffers, campus areas, commercial properties, and small wooded parcels can sit close together, mixed cells are unavoidable. Zooming in enlarges those squares but does not create parcel-level detail that was never present in the dataset.
The 2025 maps are also tied to an observation year. Construction, demolition, timber work, vegetation growth, field conversion, temporary water conditions, or restoration after that date may not appear. Anyone using the images to describe a current site should check recent aerial photography and local GIS first. The four maps are strongest as county-scale reference graphics and comparison tools, not as substitutes for surveys, engineering plans, wetland delineations, zoning maps, or title records.
Land cover and land use are related but not interchangeable. Land cover describes what the surface was classified as—forest, agriculture, water, wetland, developed land, and related categories. Land use addresses how people use or regulate land, such as residential, commercial, institutional, conservation, or other planning categories. The Athens-Clarke County Planning Department publishes planning and GIS resources for the latter questions. Keeping that distinction clear prevents a red developed cell from being mistaken for a zoning decision or a green forest cell from being treated as protected property.
What is included in the four-JPG download
The download contains one original JPG for each of the four views discussed above. Every image is 2480 × 1754 pixels. That size works well for on-screen reference, documents, many classroom handouts, and presentation slides. The package does not identify these files as meeting an A3 high-resolution reference, so a large poster should be test-printed before it is used for final production. Enlarging or re-encoding the JPG will not add source detail.
If only one file is needed, choose according to purpose rather than downloading and using the first image by default. The general map gives the broadest county overview. The forest-and-farmland map makes vegetated and agricultural areas easier to compare. The impervious layer emphasizes the hard-surface intensity within developed areas, and the change map is designed for the 1985–2025 endpoint comparison. A reader can therefore use a single image or combine two complementary views without changing the underlying county boundary.
Frequently Asked Questions
Why is developed cover 43.35% when mean impervious cover is only 12.51%?
Developed land is a broad land-cover category and may include lawns, trees, soil, and other permeable surfaces around buildings and roads. Impervious cover isolates roofs, pavement, parking areas, and similar hard surfaces. Clarke County therefore can have 43.35% developed cover while averaging 12.51% impervious surface; only 8.75% of the county is in cells that are at least 50% impervious.
Does the 30.02% class difference mean that 30.02% of Clarke County was newly developed?
No. The 30.02% figure covers every cell whose assigned class differs between the 1985 and 2025 endpoints. The map separately identifies 13.35% classified as developed, 2.43% forest loss, 1.09% agricultural loss, and 12.95% other differences. Even those categories should be checked with intermediate imagery before assigning an exact date or cause.
Can the red Athens-area land cover be used as an official city boundary or zoning map?
No. The red cells describe developed land cover in the 2025 raster. They are not legal municipal boundaries, zoning districts, parcel lines, or development approvals. Use Athens-Clarke County Planning and GIS resources when the question concerns legal land use or a specific property.
Sources and Reference Data
- MRLC Annual NLCD Data – official access to annual land-cover and comparison products
- USGS Annual NLCD Land Cover Classification – official guidance for the land-cover classes and 30-meter raster data
- U.S. Census Bureau TIGER/Line Shapefiles – official boundary reference for Clarke County
- Athens-Clarke County Planning Department – local comprehensive planning, land-use, zoning, and GIS resources
- Oconee Rivers Greenway Trails System – official local information on the North Oconee River corridor, wetlands, greenspace, and connected trails
- UGA Extension – Athens-Clarke County Agriculture & Natural Resources – county-level agriculture, soil, water, and natural-resource information
Map File Information
The ZIP contains four original JPG maps for comparing Clarke County’s 2025 developed, forest, agricultural, wetland, and water cover, impervious surfaces, and 1985–2025 class differences.
- Included Files: Four original JPG land-cover maps used in this article
- File Type: JPG images packaged in a ZIP archive
- Intended Use: Printing, education, presentations, and map-based projects
Related Maps
- Appling County Georgia Land Cover Map
- Atkinson County Georgia Land Cover Map
- Bacon County Georgia Land Cover Map
Green Map creates custom-edited map images using open geographic data sources such as geoBoundaries, Natural Earth, OpenStreetMap, and government open data.
These maps are edited visual materials, not raw data files, and are provided for education, documents, presentations, and graphic reference.