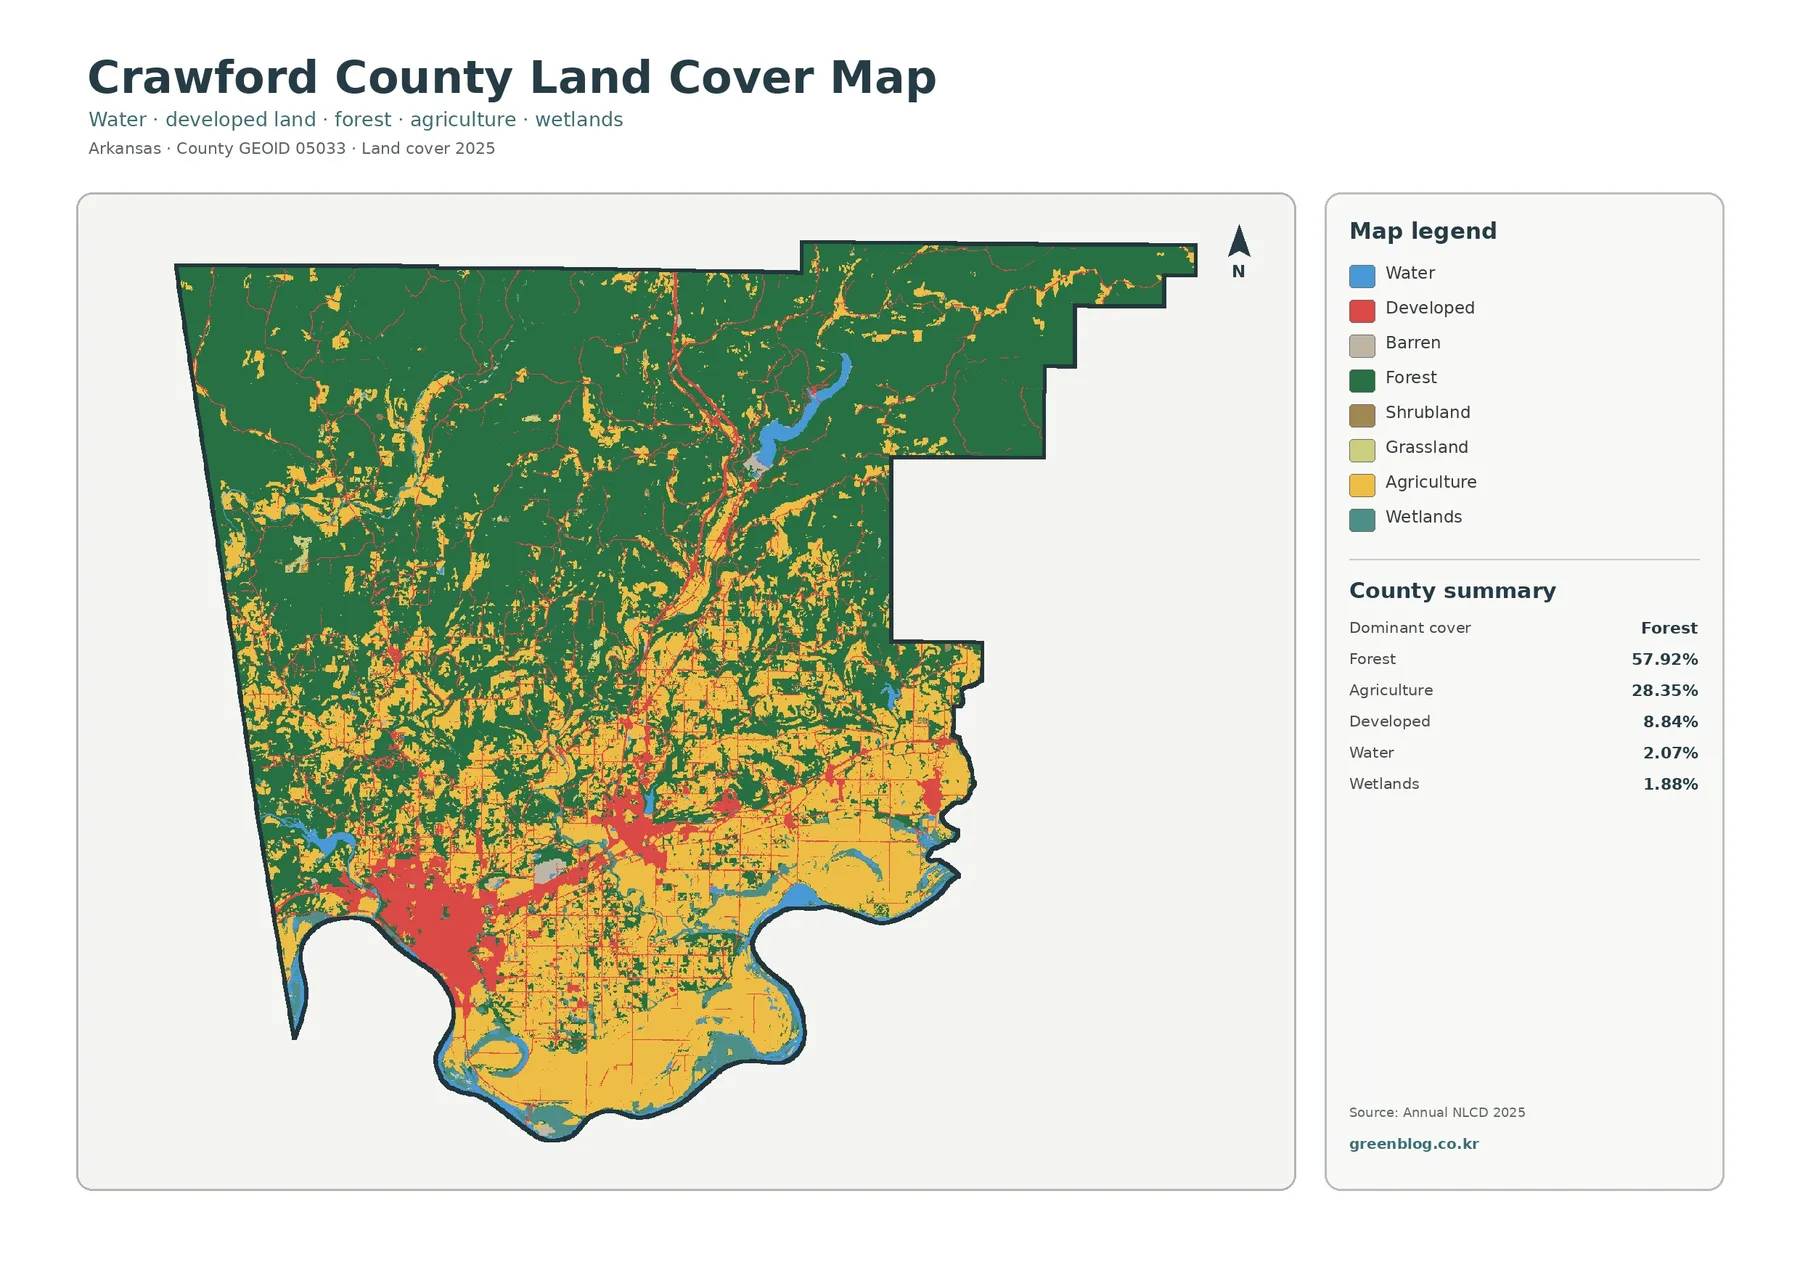
The Crawford County Arkansas Land Cover Map presents a 2025 landscape in which forest dominates the northern half while agriculture, towns, and transportation corridors become much more visible toward the Arkansas River side of the county. The supplied summary reports 57.92% forest, 28.35% agriculture, 8.84% developed cover, 2.07% water, and 1.88% wetlands.
This page pairs that broad land-cover view with a forest-and-farmland map, an impervious-surface map, and a 1985–2025 class-comparison map. The four original JPG files are available together in one download, making it practical to choose a current-cover, rural-landscape, built-surface, or historical-comparison view for a report, lesson, or presentation.
Table of Contents
Start with the north–south contrast
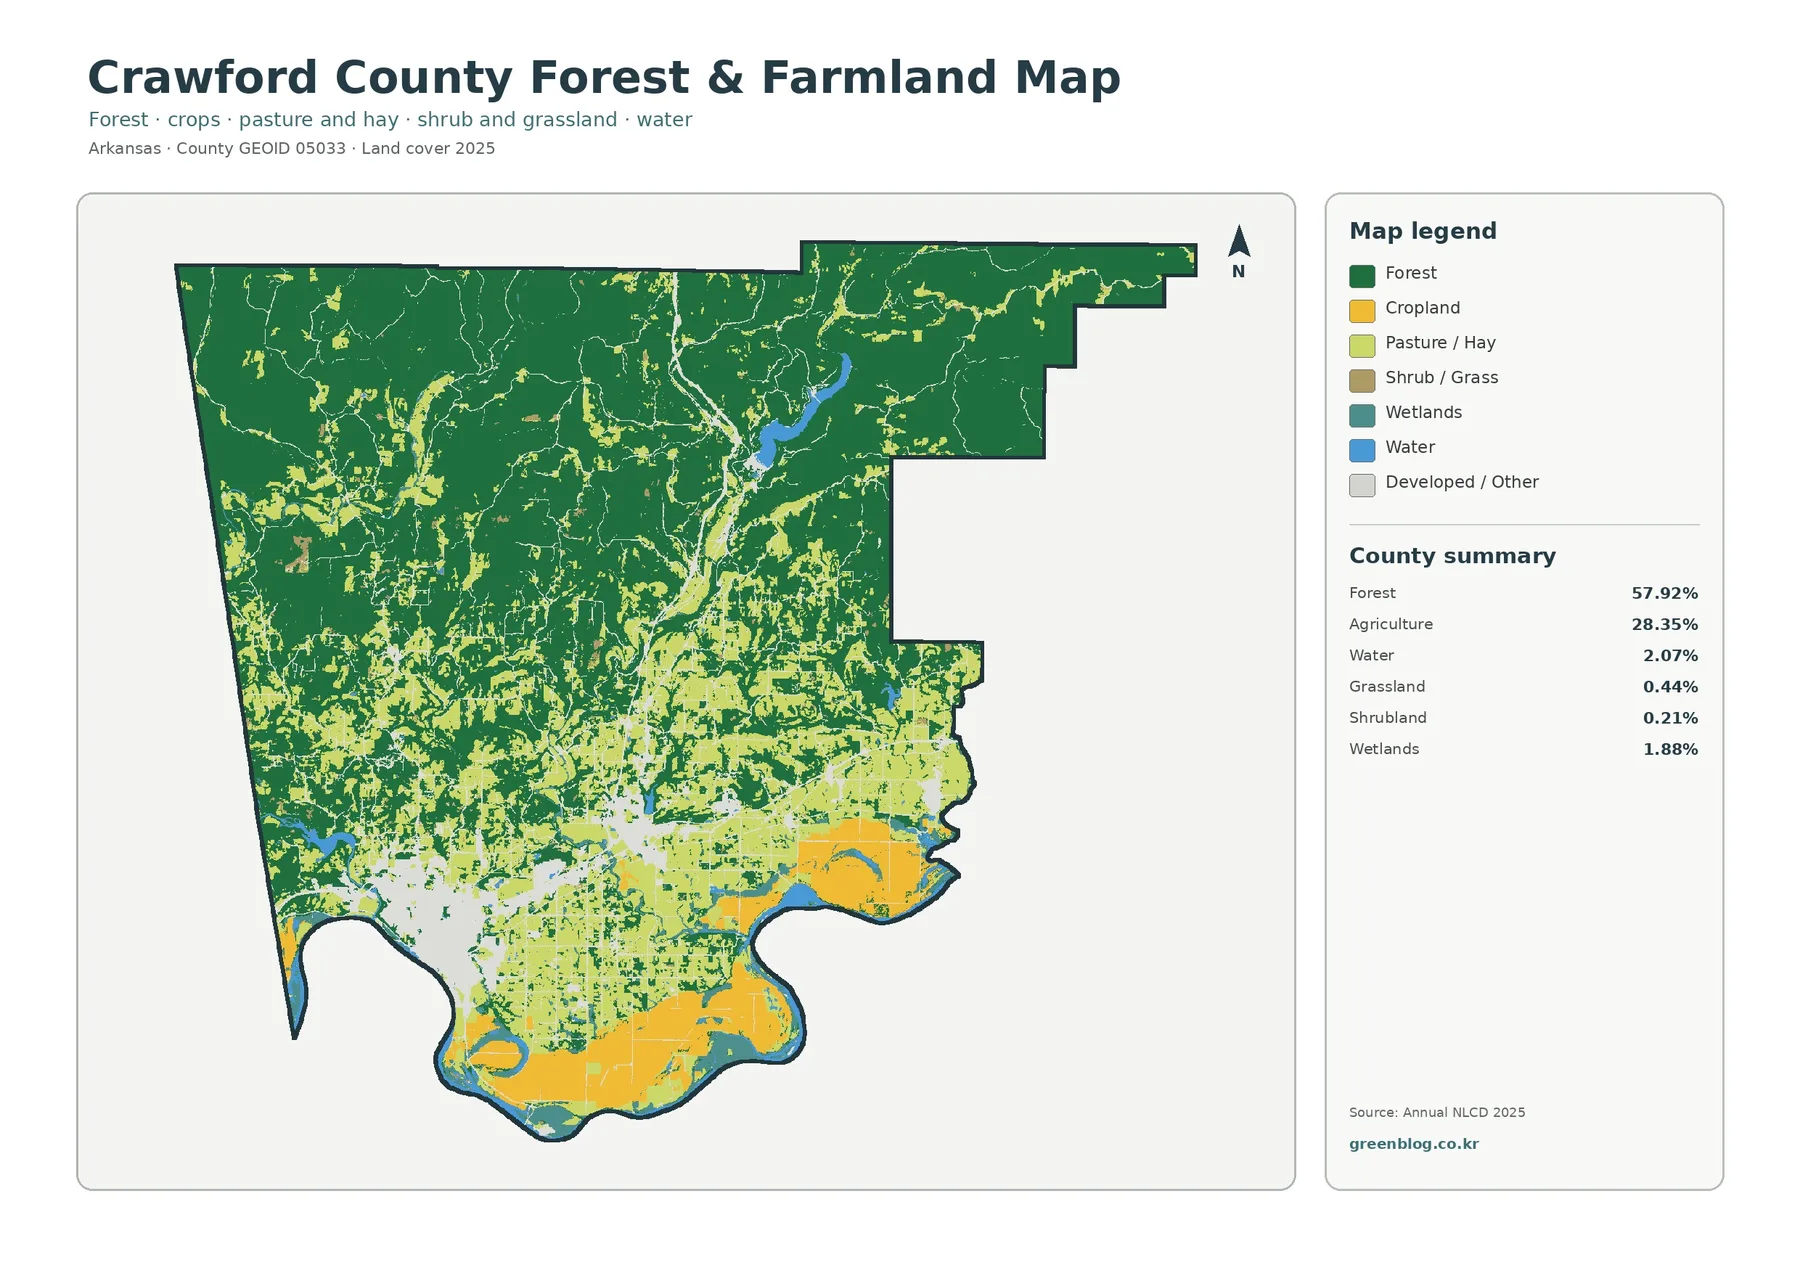
Forest is the strongest countywide signal. Dark green covers most of northern Crawford County and remains common through the west and central uplands. Moving south, the pattern becomes more mixed. Agricultural cover expands across flatter-looking southern areas, and developed cells become increasingly visible around the southwestern urban concentration and along narrow transportation-like lines. The map therefore has a clear regional contrast without a single hard boundary between wooded and open land.
The 57.92% forest share matters because it confirms that wooded land is not merely a background color. More than half of the mapped county is classified as forest in the supplied 2025 summary. Agriculture accounts for 28.35%, so open rural land is also a major part of the landscape. Developed cover is much smaller at 8.84%, yet it stands out because it is concentrated rather than evenly scattered.
Van Buren makes the built-surface pattern easy to recognize
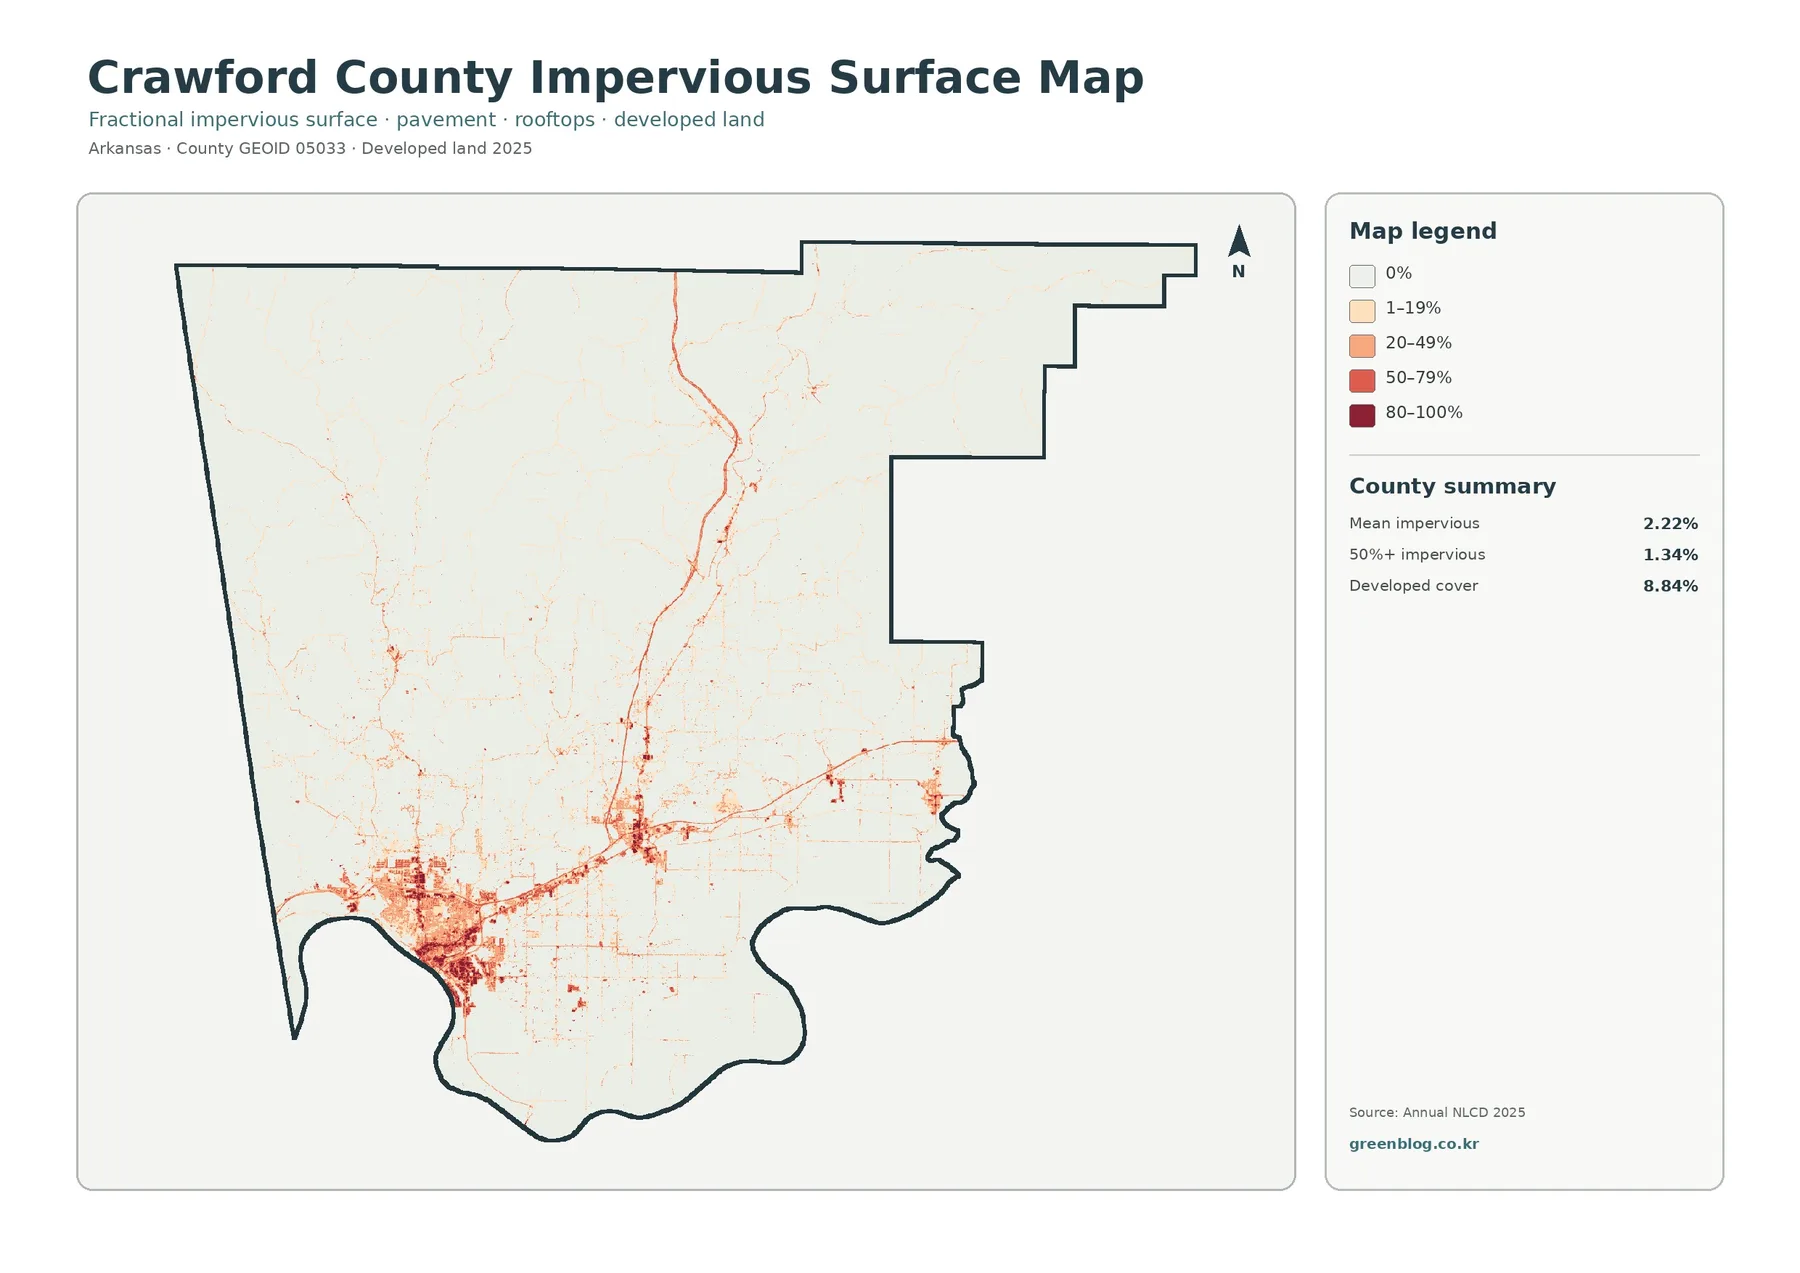
Impervious surface means pavement, rooftops, parking areas, and similar surfaces that shed most rainfall rather than letting it soak directly into the ground. Crawford County has a mean impervious value of 2.22%, while 1.34% of the county is mapped at 50% impervious or greater. Those figures are not the same as the 8.84% developed-cover share because developed land can contain lawns, trees, soil, and other permeable surfaces.
The strongest impervious cluster appears in southwestern Crawford County around Van Buren. Dense red and orange cells form a compact area near the Arkansas River side of the county, then extend eastward and northeastward in thinner lines. Smaller concentrations occur farther east and south. An Arkansas Department of Transportation project map for the I‑49/I‑40 area identifies Van Buren, Alma, and several major routes in this same southern corridor, providing useful orientation for the linear pattern.
Most of the forested north remains pale on the impervious map. Narrow roads and small settlement points are still visible, but they do not create the broad concentrations found in the south. This sharp change is useful in environmental education because it separates the location of sealed surfaces from the much broader land-cover classes shown on the general map.
Forest and farmland tell a more detailed rural story
Removing most developed classes makes the rural pattern easier to follow. Forest remains extensive across the north and west, while cropland and pasture or hay become more frequent through the center and south. The transition is irregular: agricultural openings extend into wooded areas, and forest patches persist among southern fields. This mosaic is more informative than describing the county as simply “forest in the north and farms in the south.”
Agriculture accounts for 28.35% of the county, but the forest-and-farmland map separates cropland from pasture or hay. That distinction matters in Crawford County, where open land does not all represent the same surface. Pasture and hay can appear beside cropland, while grassland and shrub/grass categories represent other open cover. The supplied summary also lists 0.44% grassland and 0.21% shrubland.
Lake Fort Smith provides a useful northern reference. Arkansas State Parks places the park near Mountainburg and describes the lake in the Ozark Mountains. On the supplied map, the northern reservoir is surrounded by extensive forest, which helps explain why water and wooded cover appear together there. This geographic reference does not change the land-cover percentages; it simply helps a reader orient a visible feature.
What changed between 1985 and 2025
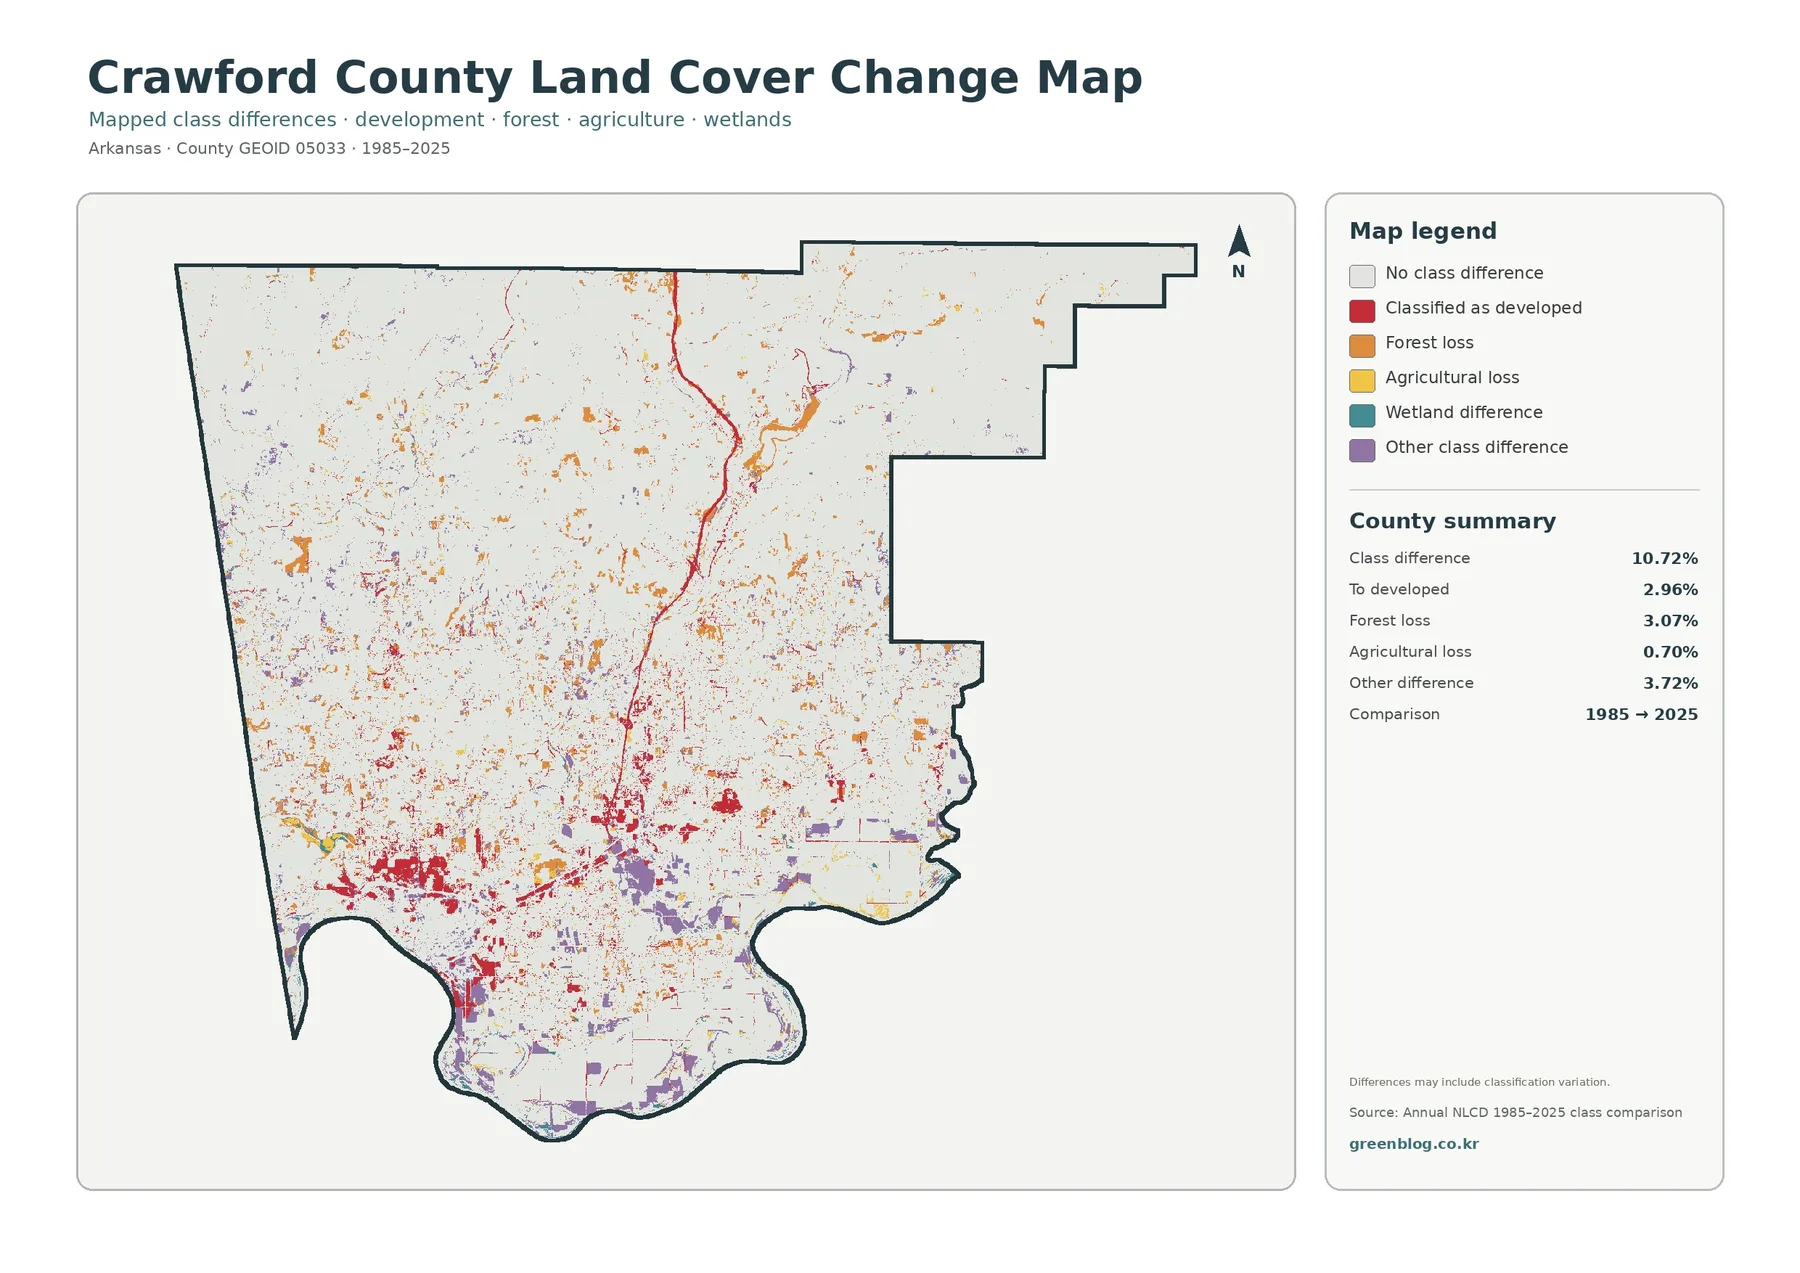
The class-comparison map marks 10.72% of the county as having a different mapped class between 1985 and 2025. That is the broad comparison figure, not a development rate. The summary separates 2.96% classified to developed, 3.07% forest loss, 0.70% agricultural loss, and 3.72% other class difference. These categories make it possible to discuss several kinds of mapped change instead of turning the entire 10.72% into one story.
Red change-to-developed cells are especially visible in the southwest and along portions of the southern corridor. Orange forest-loss marks are scattered through the north and center as well as around developed areas, while purple “other” differences appear in several southern patches. The distribution shows where the two endpoint classifications disagree, but it does not provide the date, cause, or sequence of change for an individual location.
Classification variation is an important caution. A cell can receive different labels because the surface truly changed, but mixed pixels, imagery differences, or classification uncertainty can also contribute. The map itself notes that differences may include classification variation. A claim about a specific clearing, subdivision, farm conversion, or wetland change should therefore be checked against aerial imagery, intermediate-year data, field records, or local documents.
Raster cells are useful for patterns, not parcel decisions
Annual NLCD is a raster land-cover product. In simple terms, the landscape is divided into regular grid cells and each cell receives a representative class. At the commonly used 30-meter scale, a cell may contain trees, lawn, pavement, a small building, or a stream edge at the same time. The assigned class generalizes that mixed surface so counties can be compared consistently.
Mixed pixels are especially important along roads, forest edges, narrow waterways, low-density neighborhoods, and small agricultural openings. A thin feature may be absorbed into the surrounding class, while a complicated boundary can look smoother than it does in high-resolution aerial imagery. The maps are therefore appropriate for county-scale pattern recognition, education, and regional comparison, not for drawing parcel boundaries or making legal land-use decisions.
Time is another limitation. The current maps represent the supplied 2025 classification, so later construction, clearing, crop rotation, restoration, or storm impacts are not included. The change map compares two endpoints, 1985 and 2025, and does not identify the exact year when a change happened. Current imagery and local records are necessary when a decision depends on present site conditions.
Download the four Crawford County JPG maps
The ZIP package contains the original JPG versions of the general land-cover map, forest and farmland map, impervious and developed-land map, and 1985–2025 land-cover change map. Each file retains the supplied original size of 2480 × 1754 pixels. Keeping the maps separate makes it easy to use only the view needed for a lesson, local reference, environmental discussion, report, or presentation.
Frequently Asked Questions
What is the largest 2025 land-cover class in Crawford County?
Forest is the largest at 57.92%. Agriculture follows at 28.35%, while developed cover is 8.84%. Water is 2.07% and wetlands are 1.88%. The map shows that forest is especially extensive in the north, while agriculture and development become more prominent toward the south.
Why is developed cover 8.84% while mean impervious surface is only 2.22%?
Developed land can include lawns, trees, bare soil, and other surfaces that still absorb water. Impervious surface focuses on pavement, rooftops, parking areas, and similar sealed materials. The two measurements are related, but they describe different aspects of the built landscape.
Does the 10.72% class difference mean 10.72% of the county became urban?
No. The 10.72% figure is the total area with a different mapped class between 1985 and 2025. Change to developed is a separate 2.96% category. Forest loss, agricultural loss, other class differences, and possible classification variation are also part of the comparison.
Map File Information
The ZIP contains the four original Crawford County land-cover JPG maps discussed on this page.
- File Type: Four JPG images in one ZIP archive
Related Maps
- A Craighead County Arkansas Land Cover Map
- Arkansas County Arkansas Land Cover Map
- Ashley County Arkansas Land Cover Map
Sources and data notes
- MRLC Annual NLCD Data – official access point for Annual NLCD land-cover datasets.
- USGS Annual NLCD Land Cover Classification – definitions for forest, agriculture, developed, wetland, water, and related classes.
- U.S. Census Bureau QuickFacts – Crawford County – county identification and official geographic statistics for FIPS 05033.
- University of Arkansas Cooperative Extension – Crawford County – county-specific agriculture, natural-resources, water-quality, and soil programs.
- Arkansas State Parks – Lake Fort Smith – official geographic reference for Lake Fort Smith near Mountainburg.
- Arkansas Department of Transportation – I‑49 Project Fact Sheet – official orientation for the Van Buren, Alma, I‑40, and I‑49 corridor.
Green Map creates custom-edited map images using open geographic data sources such as geoBoundaries, Natural Earth, OpenStreetMap, and government open data.
These maps are edited visual materials, not raw data files, and are provided for education, documents, presentations, and graphic reference.