Lonoke County is one of the clearest agriculture-dominant landscapes in this Arkansas map series. The 2025 land-cover summary assigns 66.30% of the county to agriculture, while wetlands account for 14.47%, developed land 8.23%, forest 6.92%, and water 3.47%. Most of the county therefore reads as broad farm country, but the northwest is noticeably more developed and wooded, and wetland colors weave through the agricultural interior along drainage and stream corridors.
This page compares four views of that pattern: general land cover, forest and farmland, impervious surface and developed land, and mapped class differences from 1985 to 2025. The WebP images are provided for on-page viewing, while the four original JPG maps are available together in one download. Using the maps side by side is especially helpful when you want to separate a broad land-cover class from the density of pavement and buildings or from long-term classification change.
Table of Contents
Agriculture Covers Two-Thirds of Lonoke County, with Wetlands Threaded Through the Farm Belt
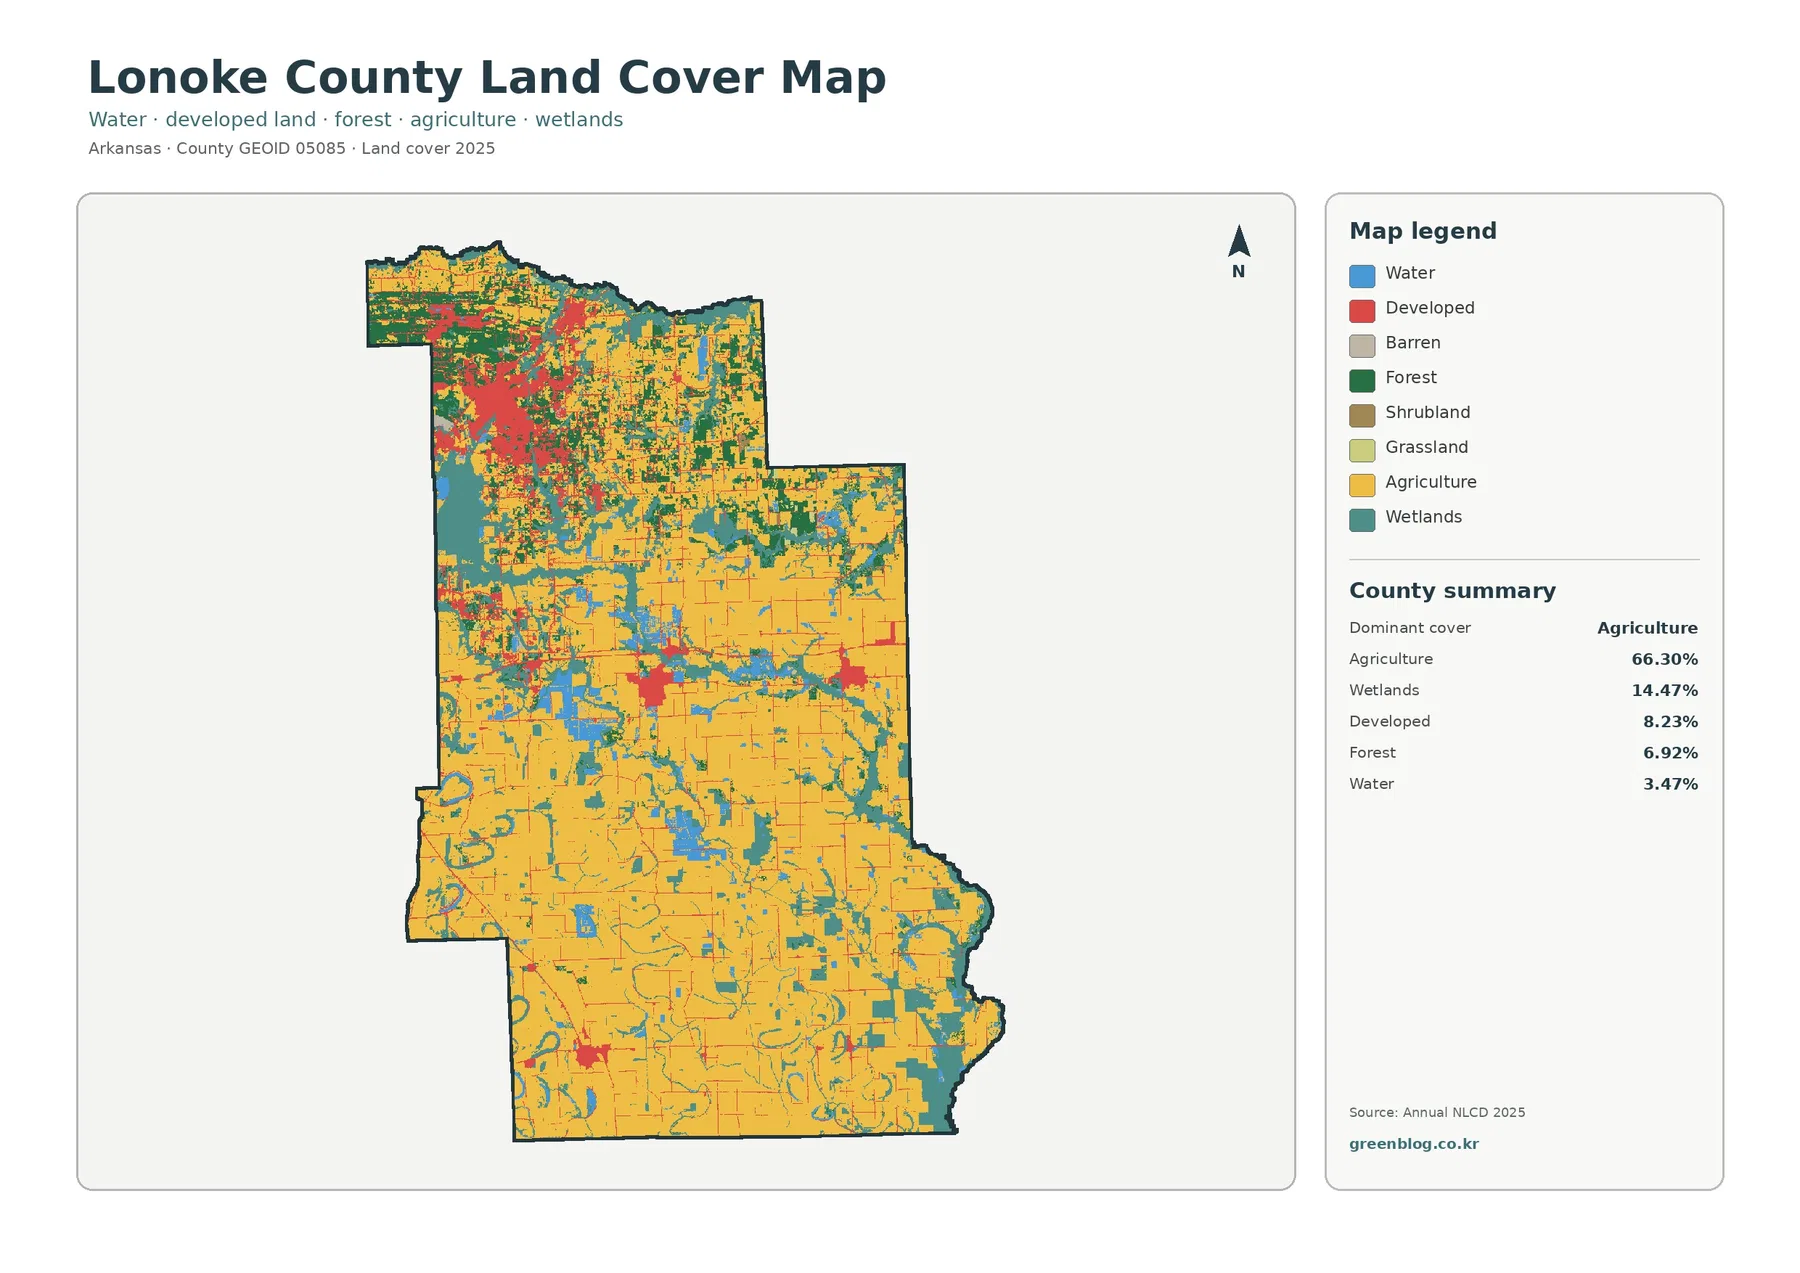
The general map makes the county’s dominant pattern obvious before any numbers are read. Yellow agricultural cover occupies most of the center, south, and east, creating large blocks that are interrupted by wetlands, water, and small developed areas. The county summary confirms what the image suggests: agriculture is 66.30%, far ahead of every other class. That figure is useful, but the spatial arrangement matters just as much because the remaining third of the county is not distributed evenly.
Wetlands are the second-largest summarized class at 14.47%. They do not appear as one isolated wetland district. Instead, teal-green bands and patches follow winding channels through the agricultural landscape, especially across the central, southern, and eastern portions of the county. Water, at 3.47%, often appears within the same broader network. This creates a farm landscape that is visually crossed by many wet or water-associated features rather than a simple uninterrupted field pattern.
The northwest corner is different. Developed red is much denser there, and forest green appears more frequently than it does across the broad agricultural interior. The transition is not a sharp boundary; agricultural parcels, forest patches, and developed areas remain mixed near the edge of the northwest cluster. Still, the contrast is strong enough that a reader can divide the county into a more urbanized northwest and a much larger agricultural remainder without relying on city labels.
Land cover should not be confused with zoning or legal land use. These classes describe what the surface was classified as in the source imagery and data, such as agriculture, forest, water, wetland, or developed cover. A yellow agricultural cell does not establish ownership, a crop type, a parcel boundary, or a legal restriction on future use. Those questions require local planning, cadastral, property, or permitting records rather than a land-cover map.
The Forest and Farmland View Separates Broad Cropland from the More Complex Northwest
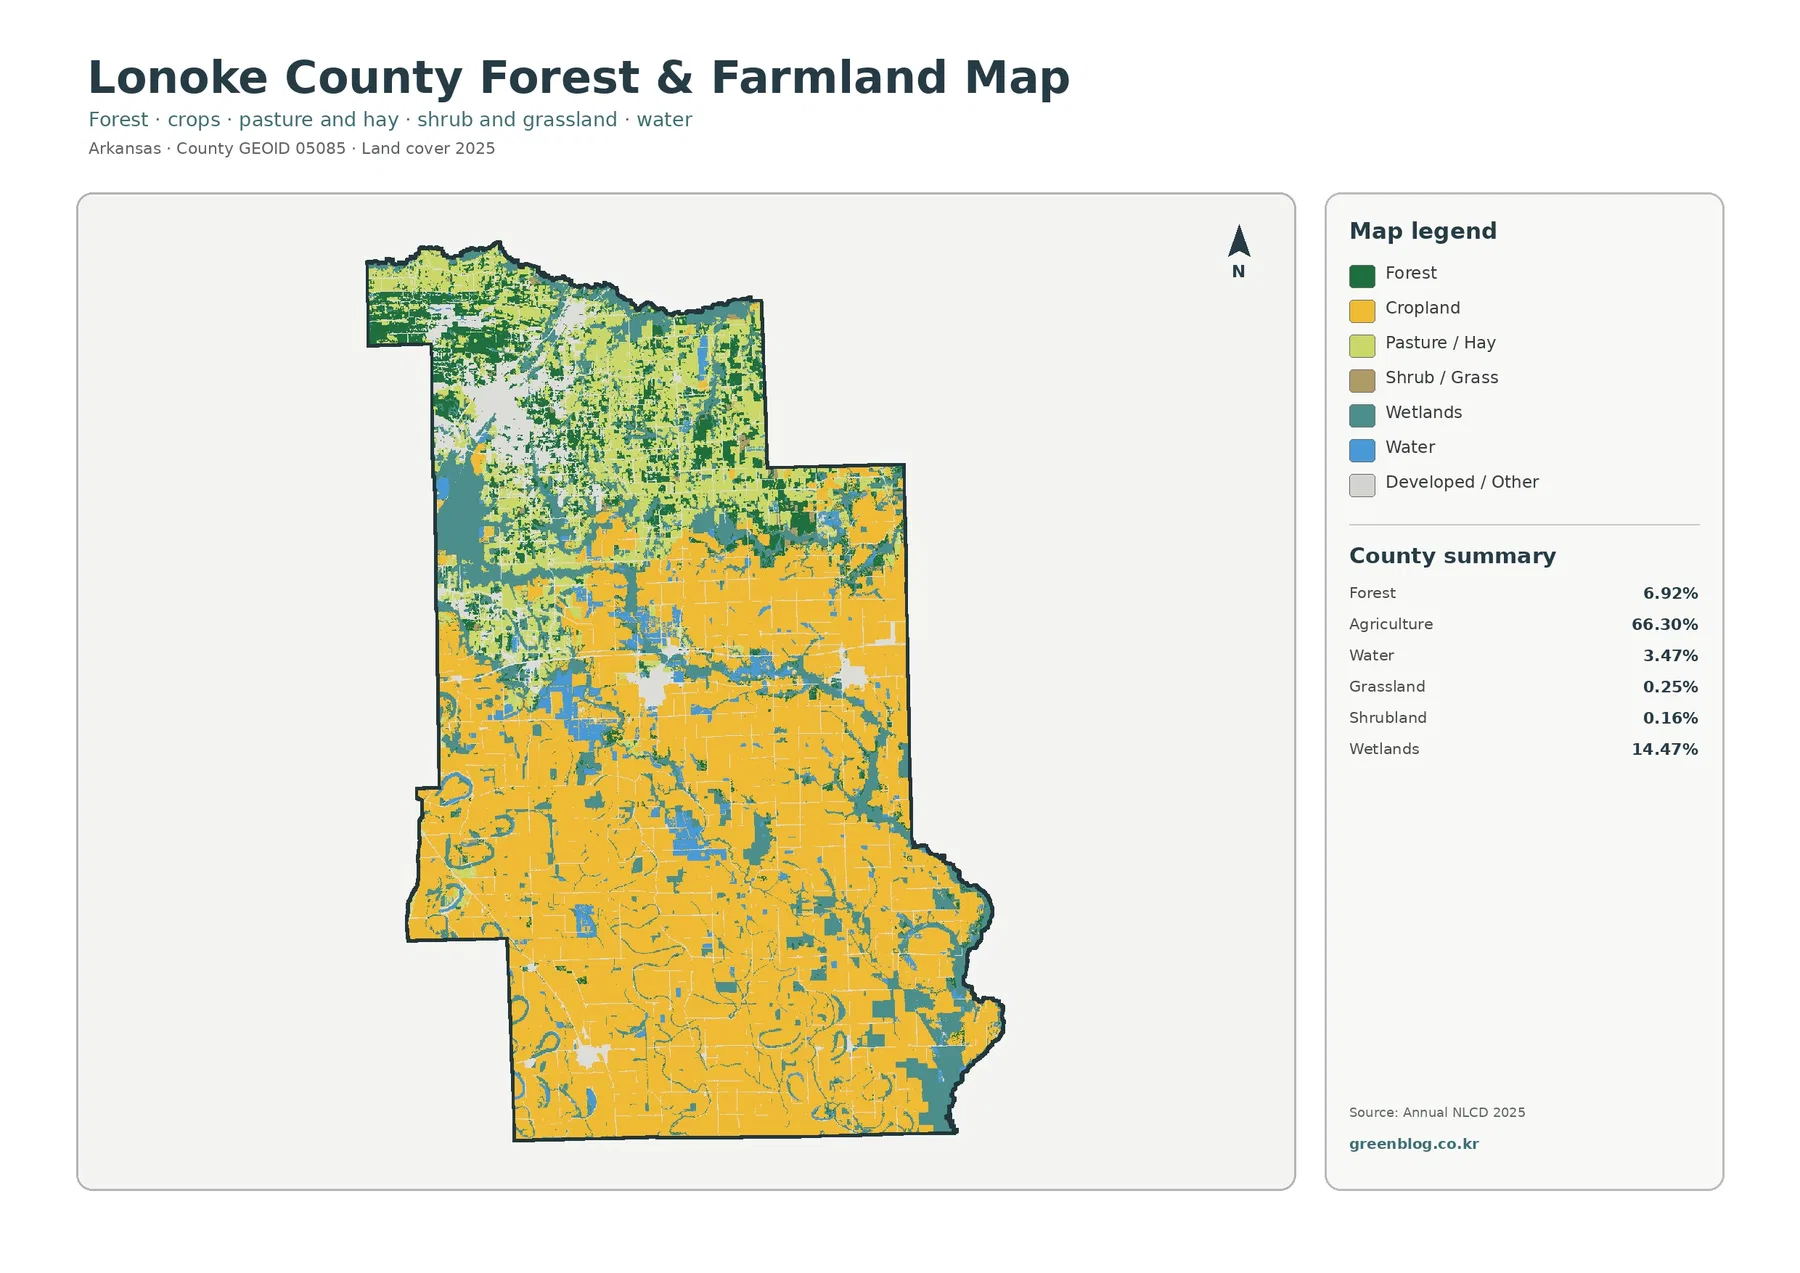
Removing much of the developed-class detail makes the agricultural pattern even easier to follow. Agriculture remains 66.30%, forest 6.92%, water 3.47%, wetlands 14.47%, grassland 0.25%, and shrubland 0.16%. The center and south are dominated by continuous-looking agricultural color, while wetland lines and water features break that continuity. The map is useful when the main question is not where every developed patch lies, but where farmland gives way to wooded or wetter cover.
Forest is a relatively small countywide share, yet its distribution is meaningful. Green becomes more common in the northwest and appears in scattered bands and patches elsewhere, especially near more irregular edges of the agricultural blocks. Because the total forest share is only 6.92%, it would be misleading to describe Lonoke County as generally forested. A better reading is that a heavily agricultural county still contains localized wooded areas that are more important in some parts of the map than the county average suggests.
The University of Arkansas System Division of Agriculture gives useful local context for this pattern. Its Lonoke County Extension programs include row-crop support, rice-related services, irrigation guidance, soil testing, and crop management education. Those services do not define the NLCD classes and should not be used to convert the mapped percentage into crop acreage, but they confirm that row-crop agriculture is an important part of the county’s working landscape.
Grassland and shrubland are tiny in the summary, at 0.25% and 0.16%. Keeping them in the legend is still helpful because not every open-looking patch should automatically be called cropland. At this scale, small classes can be difficult to see individually, so the summary panel and map colors should be read together. That is especially important when preparing a presentation where a simplified verbal description might otherwise overstate agriculture as the only open-land category.
Impervious Cover Is Concentrated in the Northwest and Drops Quickly Across Rural Areas
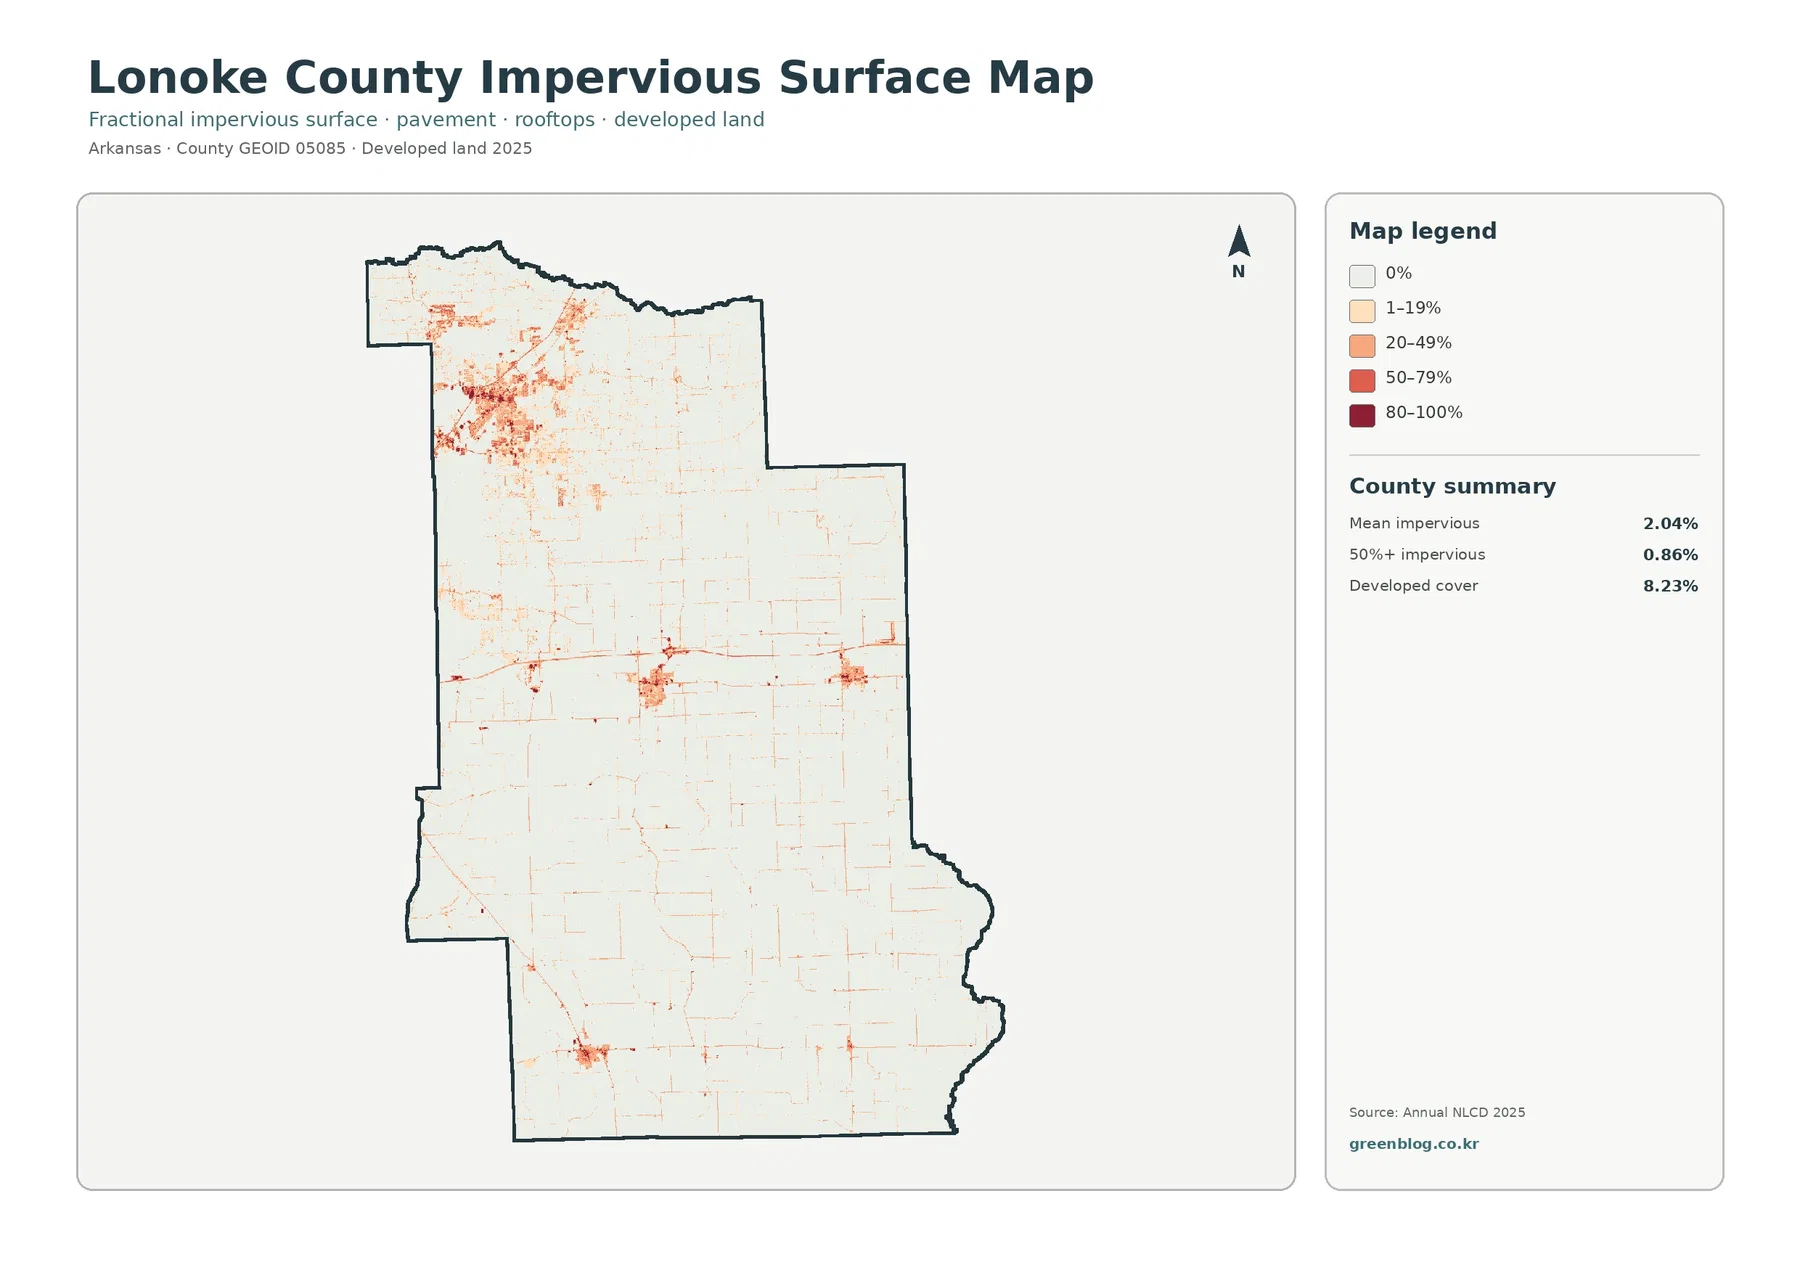
An impervious surface is a hard surface such as pavement or a roof where water does not readily soak into the ground. The countywide mean impervious value is 2.04%, and 0.86% of the mapped area is summarized as 50% or more impervious. Both figures are much lower than the 8.23% developed-cover share from the general map. That difference is expected because a developed land-cover class can include lawns, trees, exposed soil, and other permeable surfaces along with roads and buildings.
The strongest impervious cluster occupies the northwest part of the county. Arkansas state listings identify Cabot, Austin, and Ward as communities in Lonoke County, and their general northwest location corresponds with the largest concentration of darker impervious cells. The color fades outward from that cluster, while thin linear traces continue along road corridors. The rest of the county is much lighter, which fits the extensive agricultural cover seen in the first two maps.
Smaller impervious concentrations appear farther east, near the middle of the county, and in the southwest. State listings also place Lonoke, Carlisle, and England in the county, providing useful reference points when comparing those smaller clusters with known communities. The image itself does not draw municipal boundaries, however, so a red patch should not be treated as the exact footprint of a city. It represents the fraction of hard surface within raster cells, not a legal boundary.
Thin orange and red lines across otherwise pale agricultural areas are another useful feature. They show that roads and built surfaces extend through rural land even where the surrounding landscape has very low imperviousness. At the same time, the map is too generalized for measuring road widths, parking lots, individual buildings, or drainage structures. Narrow features can look thicker, thinner, or discontinuous depending on the cell size and display scale.
The 1985–2025 Change Map Separates Development from Agricultural and Other Class Differences
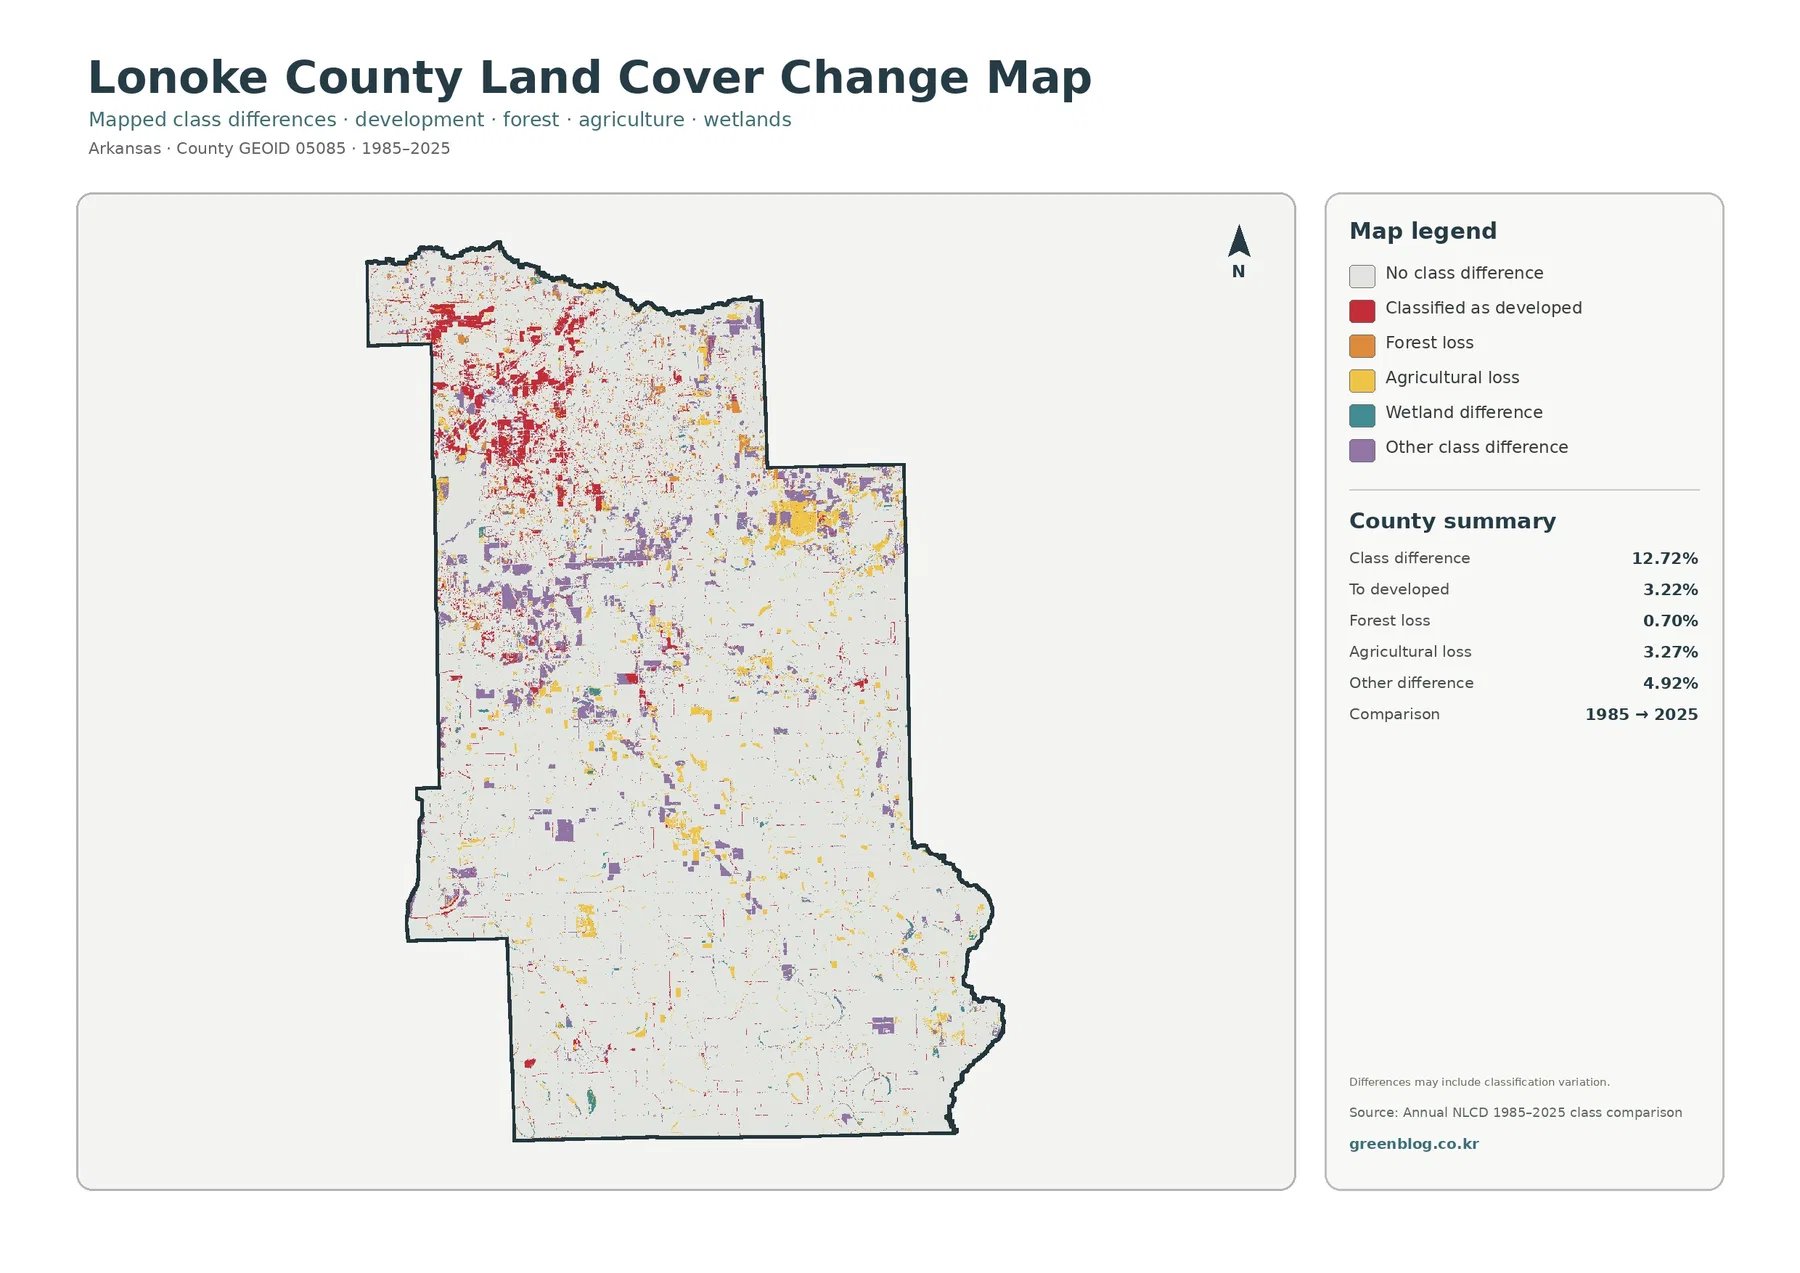
The change summary reports a 12.72% class difference between 1985 and 2025. Within the listed categories, 3.22% is mapped as change to developed, 0.70% as forest loss, 3.27% as agricultural loss, and 4.92% as other difference. Wetland difference also appears in the legend, but the summary panel does not provide a separate percentage for it. The safest approach is therefore to use only the values that are explicitly printed and to treat the remaining colored wetland pixels qualitatively.
Red change-to-developed cells are most conspicuous in the northwest, where the current impervious-surface map also shows the county’s strongest developed concentration. That visual overlap makes the two maps useful companions: one describes present-day hard-surface intensity, while the other marks locations whose class differs between the two comparison years. The overlap should not be converted into a claim that every red change pixel represents newly paved land, because the change product records classification differences rather than construction records.
Across the agricultural center and south, yellow agricultural-loss cells and purple other-difference cells are scattered in smaller patches. Some lie near wetland or water features, and others occur inside broad farm areas. This pattern is a reminder that a class change can have many possible explanations. Crop rotation, temporary surface conditions, vegetation changes, water conditions, or differences in the classification process can affect how a cell is labeled at different times.
The note on the map specifically warns that differences may include classification variation. Satellite observation conditions change, methods improve, and mixed pixels can be assigned differently when more than one surface type occurs inside a cell. For that reason, the change map works best as a screening tool that identifies places worth checking in aerial photographs or other historical records. It should not be used by itself to assign a cause, date, or legal significance to a mapped difference.
Using the Four Views Together Reveals More Than Any Single Map
For a quick county overview, begin with the general land-cover map. It shows the agriculture-dominant interior, the wetland and water network, and the much more developed northwest in one frame. Move to the forest-and-farmland view when you need a cleaner comparison between agricultural and wooded cover. That sequence is useful for classroom explanations because it starts with all major classes and then reduces the visual complexity without changing the county boundary.
Use the impervious map when the question is about development intensity rather than the broad developed class. The 2.04% mean impervious value and the strong northwest cluster demonstrate why developed cover and hard-surface coverage are not interchangeable. A neighborhood can be classified as developed while still containing many lawns, trees, and other surfaces that absorb water. The map therefore adds a more focused view of built surfaces than the general land-cover image provides.
The change map should usually come last. After the current pattern is understood, it becomes easier to interpret where 1985 and 2025 differ and to avoid mistaking every change color for the same process. A useful presentation can place the current land-cover map beside the change map, then point to the northwest developed concentration, selected agricultural areas, and wetland corridors as examples of how present cover and long-term class difference answer separate questions.
Download the Four Original Lonoke County JPG Maps
The download ZIP contains the 2025 general land-cover map, forest and farmland map, impervious/developed-land map, and the 1985–2025 land-cover change map as separate JPG files. The asset manifest lists each original JPG at 2480×1754 pixels, while the on-page WebP previews are 1800×1273 pixels. The files are presented at their supplied resolution rather than being advertised as newly upscaled images.
Raster Classification Is Good for Countywide Patterns, Not Parcel-Level Decisions
Annual NLCD is raster data, meaning the landscape is represented by a grid of cells. A cell can contain more than one real-world surface, yet the classification or fractional value must summarize that mixed area. Small drainage ditches, narrow tree lines, isolated buildings, field-edge vegetation, and minor roads may therefore be simplified or blended with surrounding cover. The maps are designed to show broad patterns, not survey-grade boundaries.
This limitation matters in Lonoke County because so much agriculture is interlaced with wetlands and water features. A field edge next to a wet channel can change classification over a short distance, and water conditions may vary with season or observation date. At the scale of a county map, those narrow transitions can appear wider or more continuous than they do on the ground. Use them to identify regional relationships, not to locate a precise ditch, parcel line, or wetland jurisdiction.
The current maps are labeled 2025, while the change product compares 1985 with 2025. Construction, crop changes, drainage work, vegetation shifts, or other surface changes after the observation period will not appear here. For a current planning or property decision, combine these maps with recent aerial imagery and the appropriate city or county records.
Frequently Asked Questions
What is the largest land-cover class in Lonoke County?
Agriculture is the largest 2025 class at 66.30%. Wetlands are next at 14.47%, followed by developed land at 8.23%, forest at 6.92%, and water at 3.47%. The agriculture-dominant pattern is strongest across the center, south, and east, while the northwest contains a much denser mix of development and forest.
Why is developed cover 8.23% when mean imperviousness is only 2.04%?
The developed class includes areas that can contain lawns, trees, soil, and other permeable surfaces as well as roads and buildings. Imperviousness measures the hard-surface fraction more directly. That is why the two values answer different questions and should not be expected to match.
Does the 12.72% class difference mean 12.72% of the county was developed?
The 12.72% figure is not a development rate. It covers all mapped class differences between 1985 and 2025. Change to developed is listed separately at 3.22%, while agricultural loss, forest loss, other differences, and wetland-related differences also appear in the product. The map also warns that some differences may reflect classification variation.
What is included in the download?
The ZIP contains four separate JPG maps: 2025 general land cover, forest and farmland, impervious/developed land, and 1985–2025 land-cover change. They match the four map topics shown on this page and can be used for printing, presentations, or side-by-side county analysis.
Sources and Reference Material
- MRLC Annual NLCD Data — the official data portal for the Annual NLCD land-cover products used as the basis for this map set.
- USGS Annual NLCD Land Cover Classification — definitions and background for land-cover classes such as agriculture, forest, developed land, water, and wetlands.
- University of Arkansas Extension: Lonoke Programs — county-specific information on row crops, irrigation, soil testing, and agricultural education.
- Arkansas Town & County Listing — an Arkansas state reference confirming communities such as Cabot, Carlisle, England, and Lonoke within Lonoke County.
Map File Information
The ZIP includes four original JPG maps for Lonoke County: 2025 land cover, forest and farmland, impervious/developed land, and 1985–2025 land-cover change.
- Included Files: land cover, forest/farmland, impervious/developed land, and land-cover change maps
- File Type: one ZIP containing four JPG files
Related Maps
- A Craighead County Arkansas Land Cover Map
- Arkansas County Arkansas Land Cover Map
- Ashley County Arkansas Land Cover Map
Green Map creates custom-edited map images using open geographic data sources such as geoBoundaries, Natural Earth, OpenStreetMap, and government open data.
These maps are edited visual materials, not raw data files, and are provided for education, documents, presentations, and graphic reference.