Greenlee County is easiest to understand as a long, narrow county with two very different halves. The north is dominated by high, broken terrain and a dense network of creeks, while the more visible settlements and road junctions are concentrated much farther south around Clifton and Duncan. The maps on this page show the county boundary, major roads, ranked city locations, named rivers and streams, and the large elevation change from the northern high country to the southern valleys. High-resolution JPG versions of all four maps are available together in the downloadable ZIP near the end of the page.
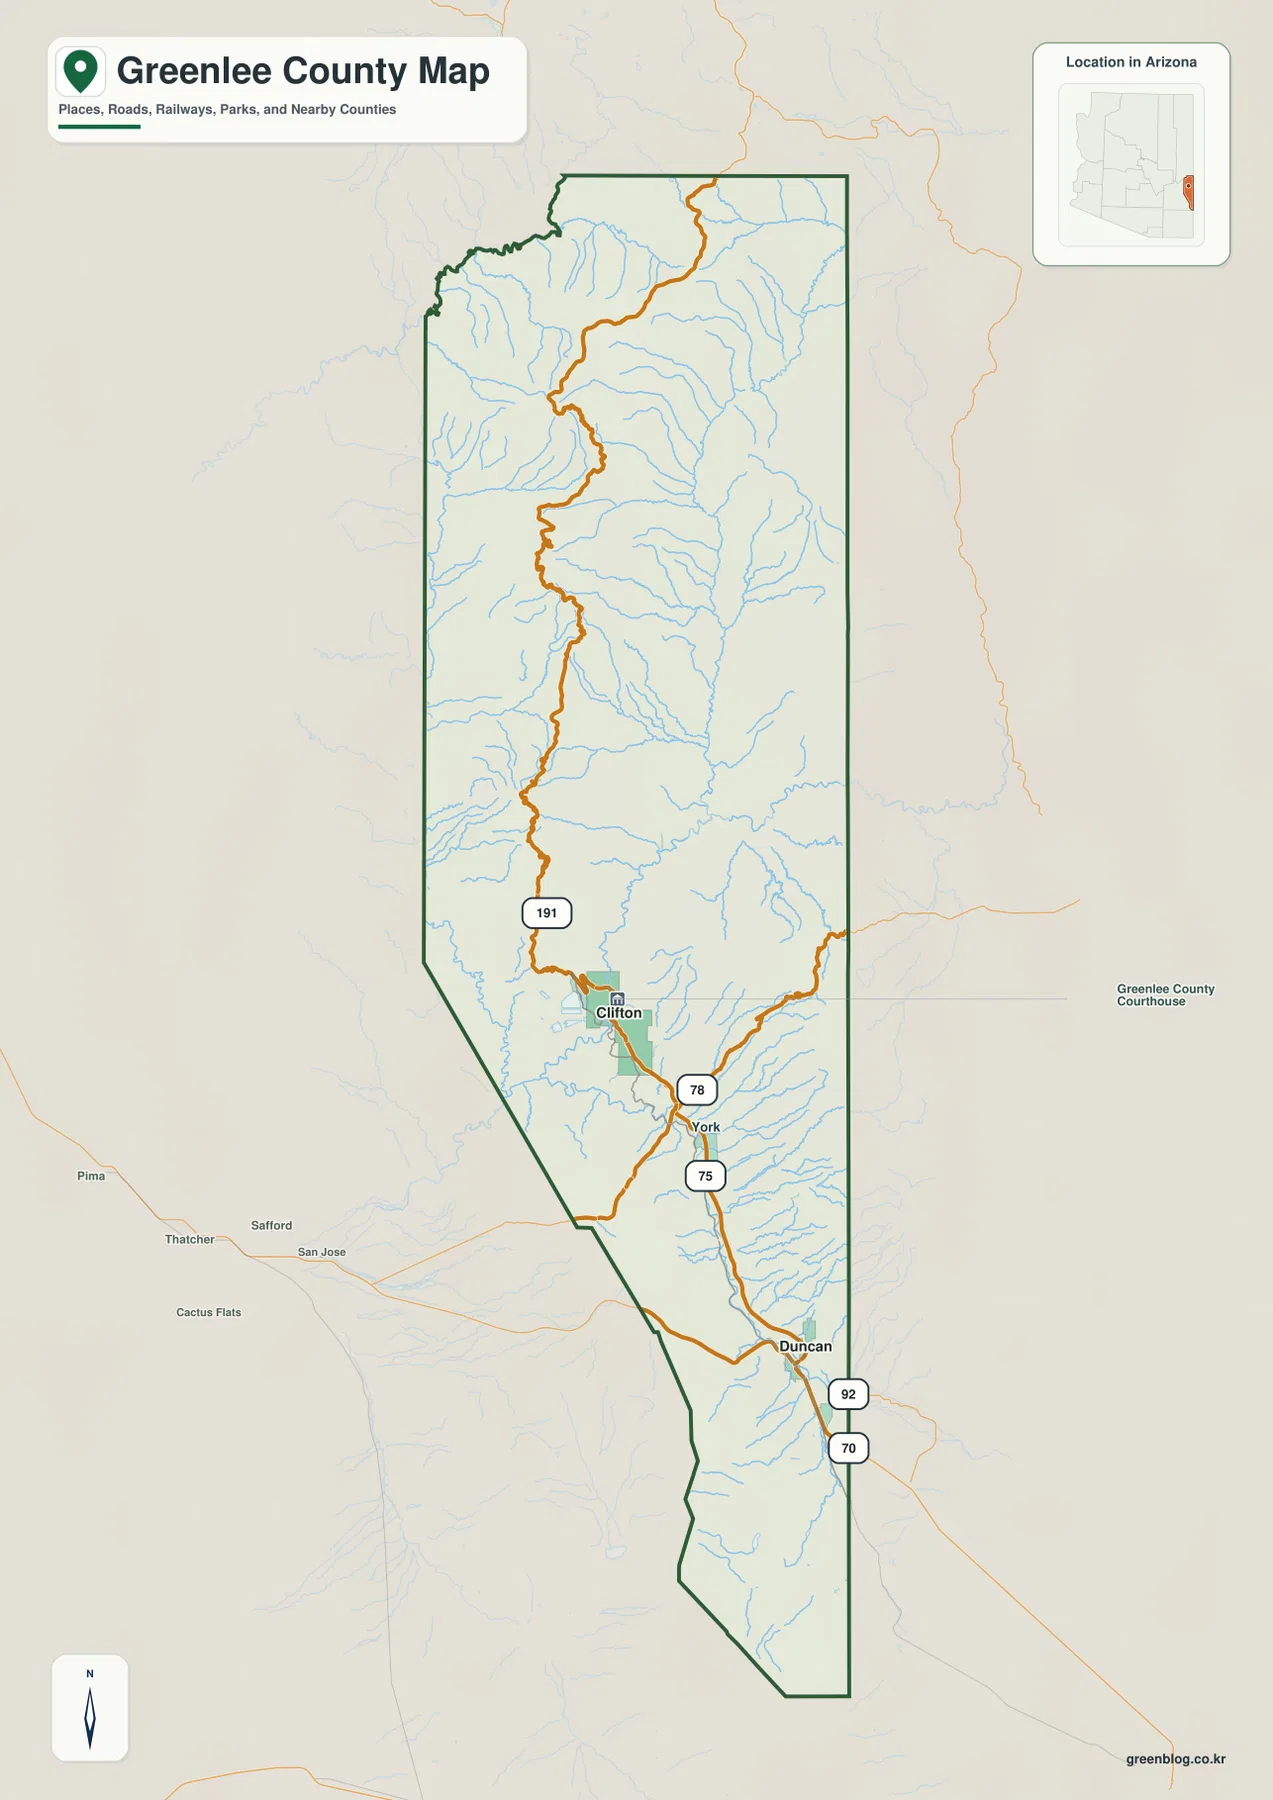
US 191 provides the clearest north-to-south reference on the general county map. It runs down through the long northern section toward Clifton, where the road pattern becomes more complex, and the southern part of the county adds AZ 78, AZ 75, AZ 92, and US 70 around the routes toward Duncan. That road layout makes more sense when it is compared with the water and elevation maps, because many of the routes occupy valleys between steep ridges rather than crossing the landscape in straight lines.
Table of Contents
A north-south county where roads gather near the southern settlements
The county boundary itself is a useful part of the story. Greenlee County stretches a long distance from north to south, but its width changes noticeably. The upper section is comparatively broad and rectangular, while the western boundary steps inward through the middle and lower sections, creating a narrower southern shape. The location inset also places the county along Arizona’s eastern edge, which helps explain why the right side of the county appears as such a strong, nearly continuous boundary on the map.
US 191 is the dominant route in the north. It follows a winding course through the mountain terrain and continues toward Clifton rather than forming a straight highway across the county. South of Clifton, the road network branches: AZ 78 and AZ 75 are labeled near the central-southern corridor, while AZ 92 and US 70 appear around Duncan. Background labels to the west include Pima, Thatcher, and Safford in Graham County, giving readers an external reference for how the Greenlee road network sits relative to the neighboring valley.
Clifton appears in the narrow middle-lower part of the county where several roads and waterways come close together. York is labeled farther south along the corridor, and Duncan lies still farther down the county near the US 70 and AZ 92 area. The long northern half has very few settlement labels at the same visual scale. That contrast is important: the county’s largest mapped road and settlement concentration occupies only a relatively small portion of its total north-south length.
Clifton and Duncan stand out against a largely unmarked northern half
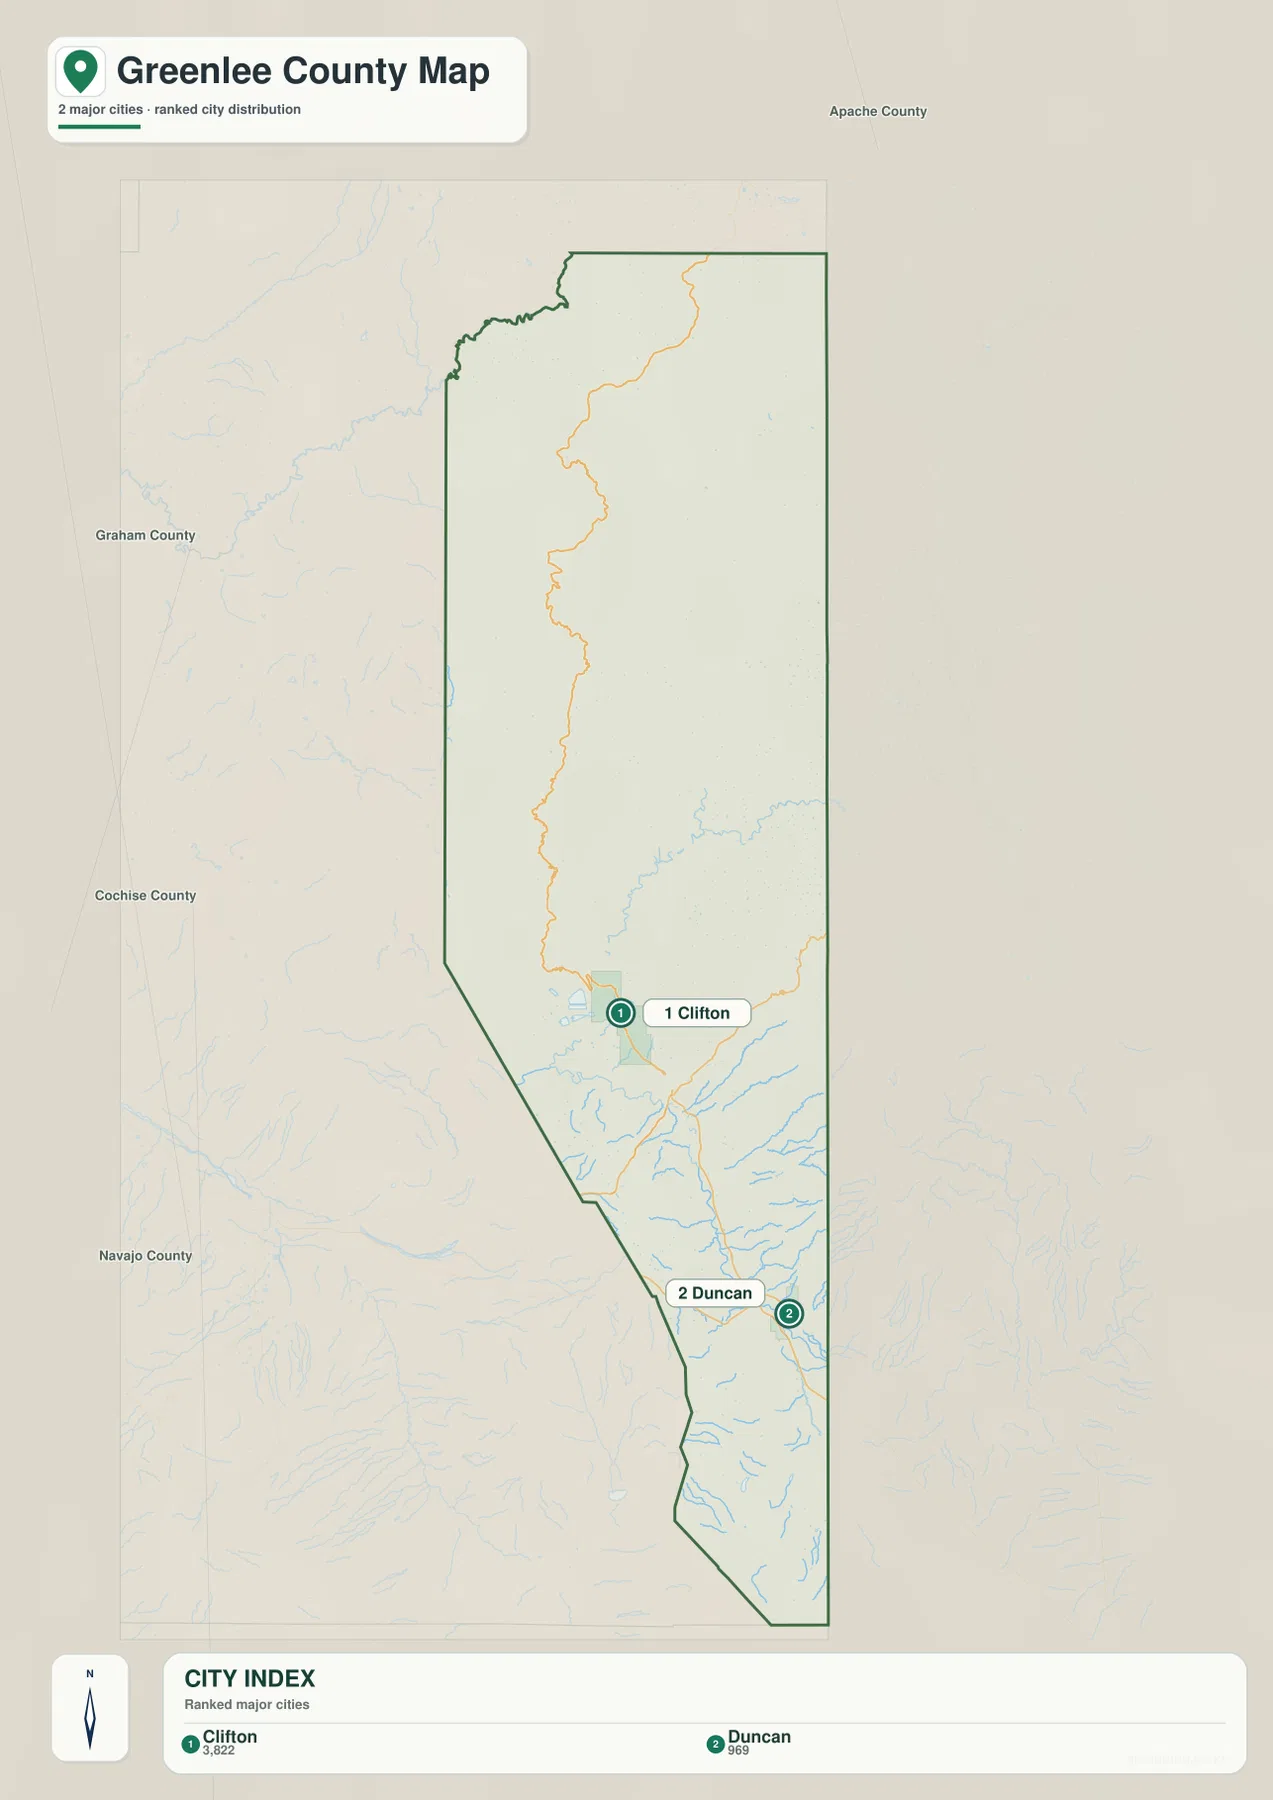
The ranked city map removes most of the road detail and makes the settlement pattern even clearer. Only two major cities are emphasized: Clifton is ranked first and Duncan second. The city index printed on the supplied map lists 3,822 beside Clifton and 969 beside Duncan. Those figures are map-index values provided with this asset rather than a separate current population estimate produced for this article.
Both city markers sit well south of the county’s midpoint. Clifton is positioned near the bend in the main north-south route, while Duncan is farther south near the county’s lower road corridor. The large northern block contains no comparable ranked-city marker. A reader can therefore see the county’s uneven settlement pattern immediately without having to study individual road labels or small communities.
This simplified city map is best used for relative location, not for door-to-door travel. It does not attempt to show every community, street, or address in Greenlee County, and it does not provide driving distances between Clifton and Duncan. For travel planning, the general road map or a dedicated navigation source is more appropriate. The value of the city layer is its clean view of where the two highlighted urban places sit inside a county that is much larger than the settled southern corridor suggests.
Three named river zones connect a dense web of mountain creeks
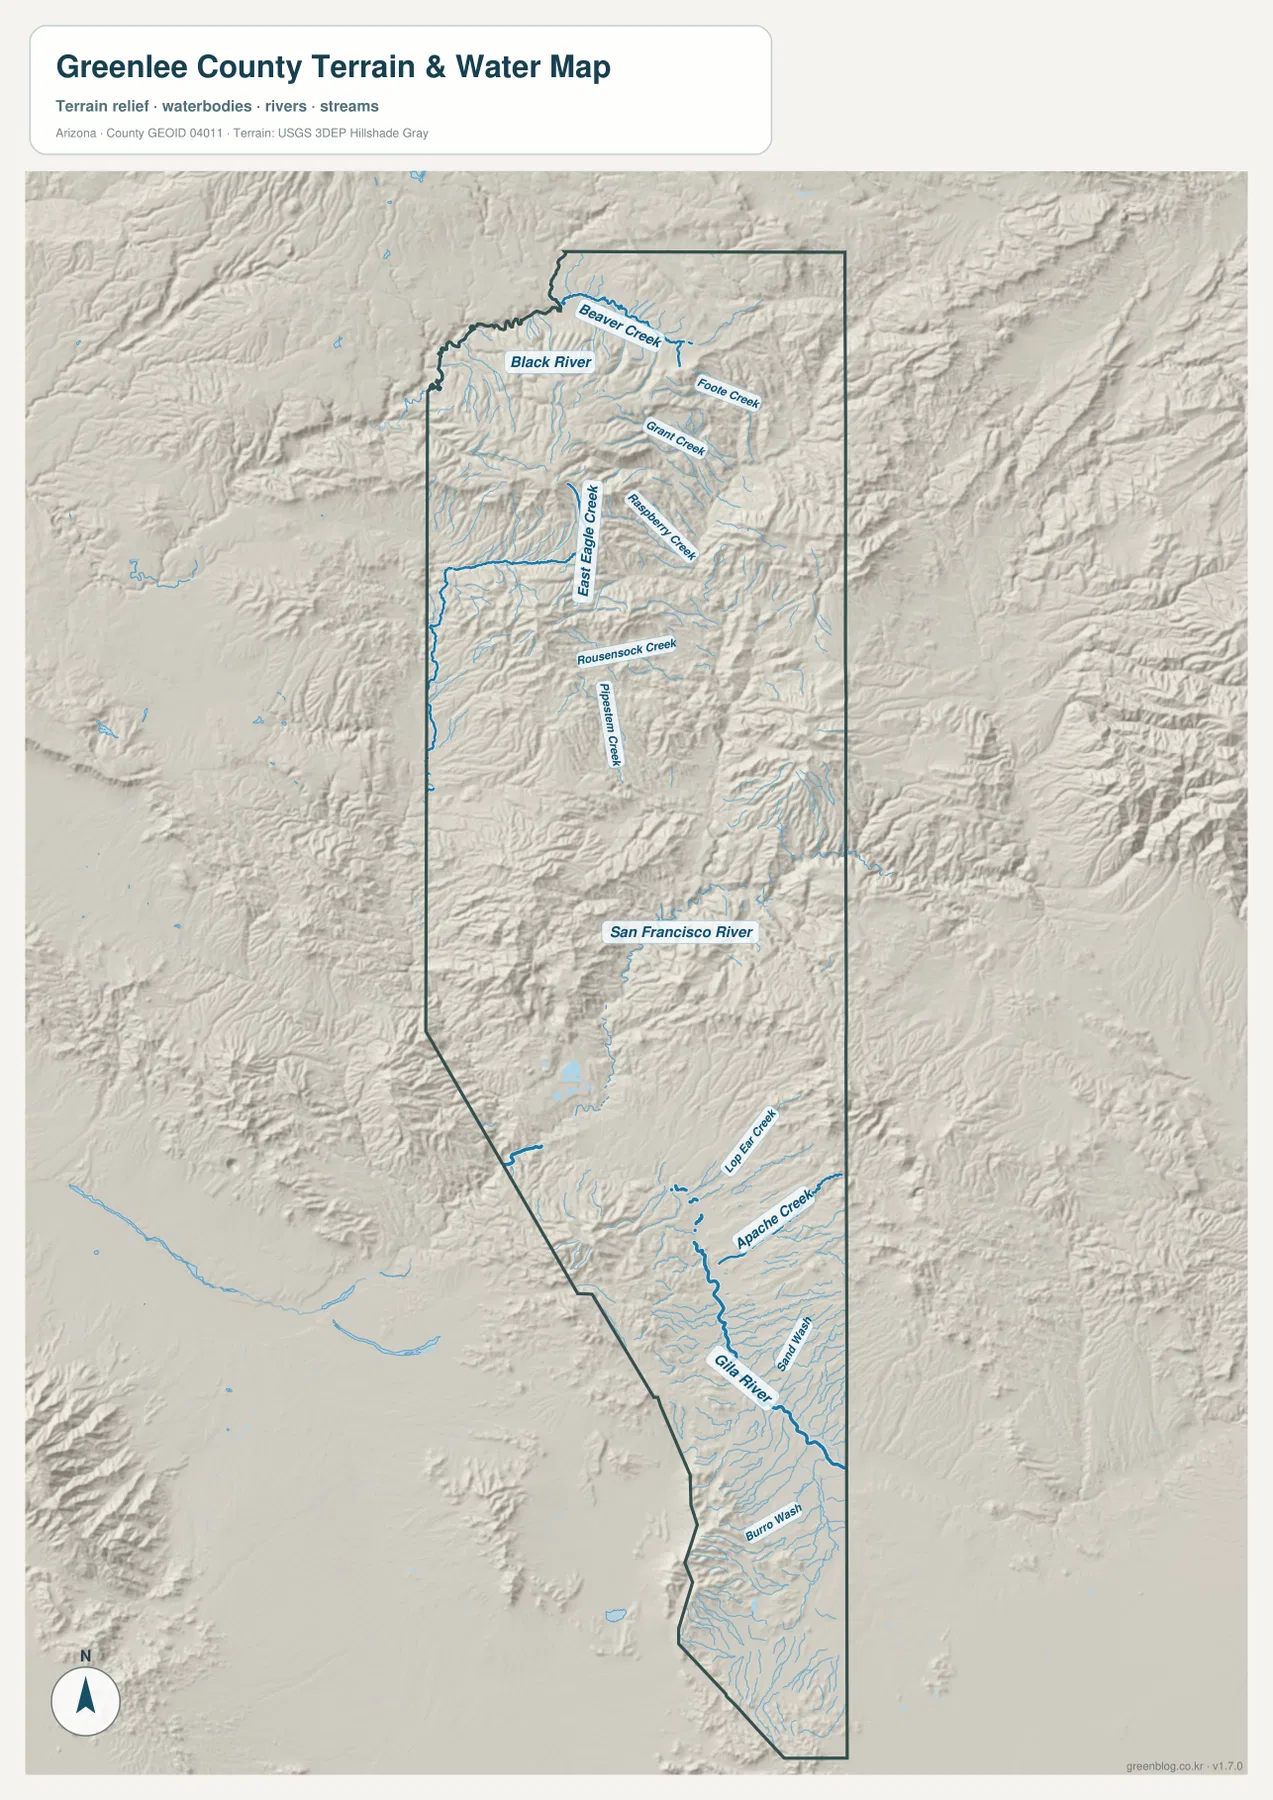
The terrain-and-water map changes the emphasis completely. In the far north, Black River is labeled near a cluster of smaller streams including Beaver Creek, Foote Creek, and Grant Creek. Farther south, East Eagle Creek and other tributaries cut through strongly shaded mountain terrain. The large number of short blue lines is one of the most distinctive features of the northern half of the county: even where settlements are sparse, the drainage network is visually dense.
San Francisco River is the most prominent named river through the central portion of the map. The river is shown against deeply incised terrain, with smaller drainages entering the broader valley system from both sides. In the southern part of the county, Gila River becomes the main labeled river, joined on the map by names such as Loper Creek, Apache Creek, Sands Wash, and Burro Wash. Looking from top to bottom, Black River, San Francisco River, and Gila River provide three useful reference zones for a county that otherwise has few large urban landmarks in the north.
The shaded relief also explains why many streams look tightly confined. Rather than crossing a flat surface, the blue lines follow valleys between ridges and descend through a landscape with repeated slopes and canyon-like cuts. The upper portion shows especially close spacing between channels, while the lower valleys open somewhat. This is a reference map for waterways and terrain; it should not be treated as a flood-hazard map, parcel map, legal survey, or navigation chart.
Elevation falls sharply from the northern high country toward the south
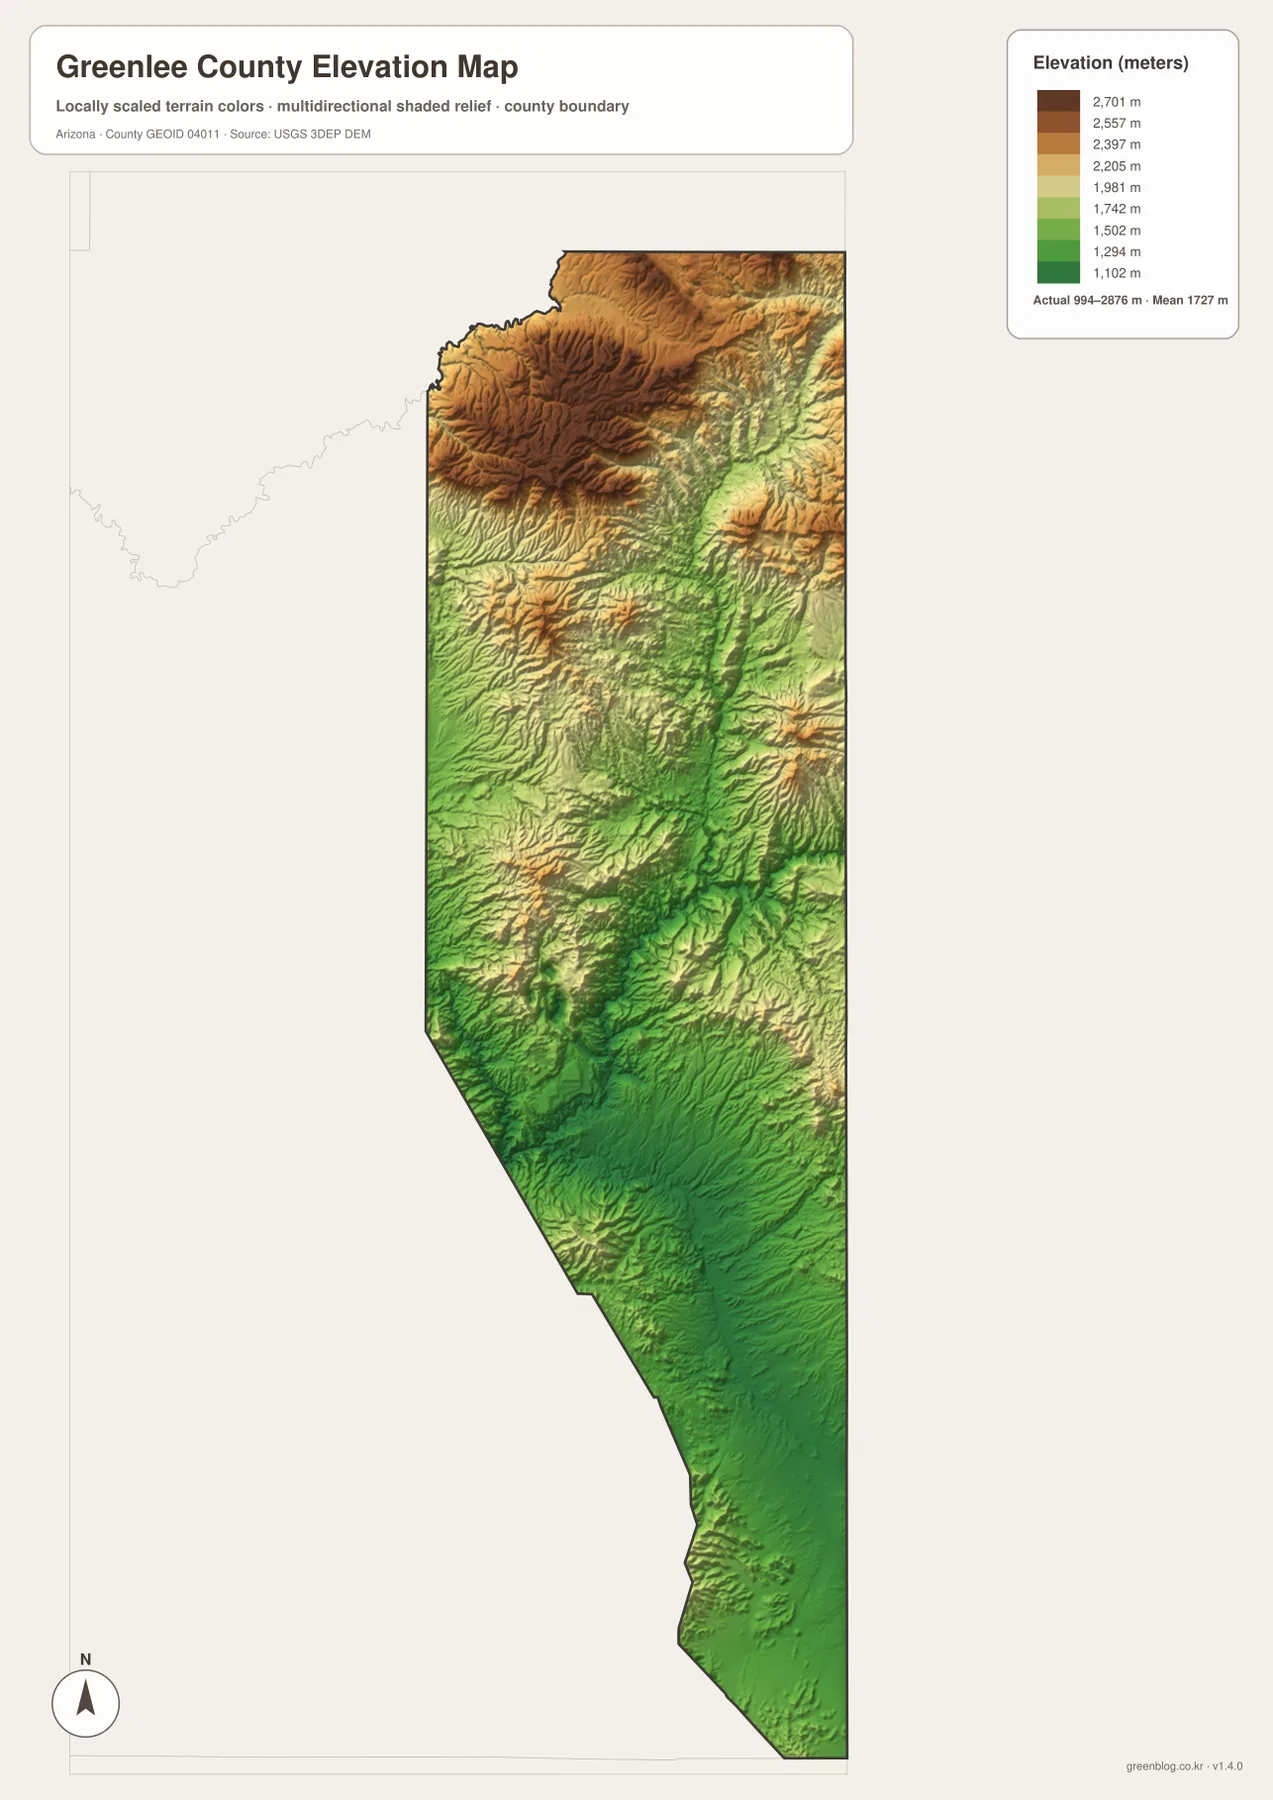
The elevation map makes the county’s north-south contrast unmistakable. Its printed statistics give an actual elevation range of about 994 to 2,876 meters, with a mean of 1,727 meters. Browns and dark ochres dominate the northern and northwestern highlands, while increasingly large green areas appear toward the south. A difference of more than 1,800 meters within one county helps explain why the terrain, drainage density, and road placement change so much from one end of Greenlee County to the other.
The north is not a single smooth plateau. Shaded ridges and valleys repeat across the high country, with several corridors dropping into lower green zones between the uplands. The central section continues that rugged pattern but begins to show longer lower valleys. Farther south, the green low-elevation colors occupy more of the map, even though hills and smaller ridges remain. Comparing this surface with the water map is especially useful because many named streams occupy the lower cuts between the higher ridges.
Clifton and Duncan are in the lower half of the county, but the southern landscape should not be mistaken for a broad flat plain. Relief remains visible on both sides of the valleys, and the eastern side contains numerous smaller rises. The main difference is relative: the high northern terrain occupies much more of the upper elevation classes, while the south contains broader low zones. This elevation layer is generalized for regional comparison and is not a substitute for survey-grade measurements or engineering elevations at a specific site.
Reading US 191 together with the rivers reveals the county’s structure
A useful way to read Greenlee County is to start with US 191 and then switch to the water map. The highway provides a continuous orientation through the long northern section, while Black River, East Eagle Creek, and San Francisco River show how the mountain drainage is arranged around that corridor. Moving to the elevation map then adds the missing vertical dimension: the road and stream network occupies a landscape where ridges can rise far above the valleys over short distances.
The southern part works differently. Here the most useful landmarks are Clifton, York, and Duncan together with AZ 78, AZ 75, AZ 92, and US 70. The city map strips the view down to the two ranked urban places, while the general map restores the roads. The water map adds Gila River and the surrounding drainages, showing that the southern settlement corridor is also closely tied to lower river valleys rather than isolated points on an otherwise empty map.
In the north, place names are less helpful than natural features. Black River, the cluster of creeks, the high elevation colors, and the long course of US 191 give the strongest orientation. In the south, road junctions and city labels become much more useful. That shift in what matters from one end of the county to the other is the central geographic idea behind this set of Greenlee County maps.
Which map should you use first?
Use the general county map first when you need boundaries, Clifton or Duncan, and the main highway relationships. It is the best single view for seeing how US 191 reaches the southern road network and how the county outline changes width along the way. It also preserves surrounding labels west of the county, which can help when comparing Greenlee County with the Safford and Thatcher area in neighboring Graham County.
When the main question is simply where Clifton and Duncan sit within the county, the ranked city map removes most of the background detail. River names, tributaries, and valley shapes are easier to follow on the terrain-and-water layer, while the elevation map is the clearest choice for comparing the high northern country with the lower southern valleys.
For printing or document work, the downloadable files are preferable to the page previews. The ZIP contains the same four map types as original high-resolution JPG files, each at 2572×3638 pixels in an A3 proportion. You can inspect the previews on this page first, then use only the full-size map that fits your purpose or keep all four together for comparison.
Frequently Asked Questions
Where are Clifton and Duncan within Greenlee County?
Both highlighted places are in the southern half of the county. Clifton sits where US 191 reaches a tighter cluster of roads and waterways, while Duncan is farther south near the US 70 and AZ 92 corridor. The ranked city map has no comparable major-city marker across the broad northern section, so the southward concentration is easy to see.
Which rivers provide the clearest north-to-south reference?
Black River is labeled in the north, San Francisco River through the central part of the county, and Gila River in the south. Smaller streams and washes, including East Eagle Creek, Loper Creek, Apache Creek, Sands Wash, and Burro Wash, add detail between those three zones. The map is a water-and-terrain reference rather than a flood or navigation product.
How much does elevation vary across Greenlee County?
The supplied elevation map prints a range of about 994 to 2,876 meters and a mean of 1,727 meters. The highest terrain is concentrated across the northern high country, while lower valleys become more extensive toward the south. Use the map for county-scale comparison; exact point elevations should come from an official elevation dataset or survey source.
Sources and reference links
The following official resources provide additional county information and background data for boundaries, hydrography, and elevation.
- Greenlee County official website — county government and local information
- U.S. Census Bureau TIGER/Line Shapefiles — geographic and county boundary data
- USGS National Hydrography — river and stream reference data
- USGS 3D Elevation Program — elevation reference data
Map File Information
Download the map files associated with this page for reference, printing, and compatible visual projects.
- Included Files: Four high-resolution JPG maps
- File Type: JPG files in one ZIP archive
- Intended Use: Printing, education, presentations, and map-based projects
Related Maps
Green Map creates custom-edited map images using open geographic data sources such as geoBoundaries, Natural Earth, OpenStreetMap, and government open data. These maps are edited visual materials, not raw data files, and are provided for education, documents, presentations, and graphic reference.