Madison County, Arkansas is overwhelmingly wooded in the 2025 land-cover map. Forest accounts for 66.50% of the county, while agriculture makes up 27.80%. The broadest forest cover fills much of the east and south, agricultural openings become larger toward the northwest, and the most obvious developed concentration sits near Huntsville in the central part of the county. Those contrasts make the county easier to understand when the four supplied map views are compared rather than read separately.
This page includes the general land-cover map, a forest-and-farmland view, an impervious-surface/developed-land map, and a 1985–2025 land-cover change map. The WebP images are provided for on-page viewing, and the four original JPG maps are available together in one ZIP farther down the page. Start with the current land-cover pattern, then use the more specialized views to examine farm openings, built surfaces, and mapped class differences over time.
Table of Contents
A 66.50% Forest Share Defines the County Before the Smaller Land-Cover Classes Come Into View
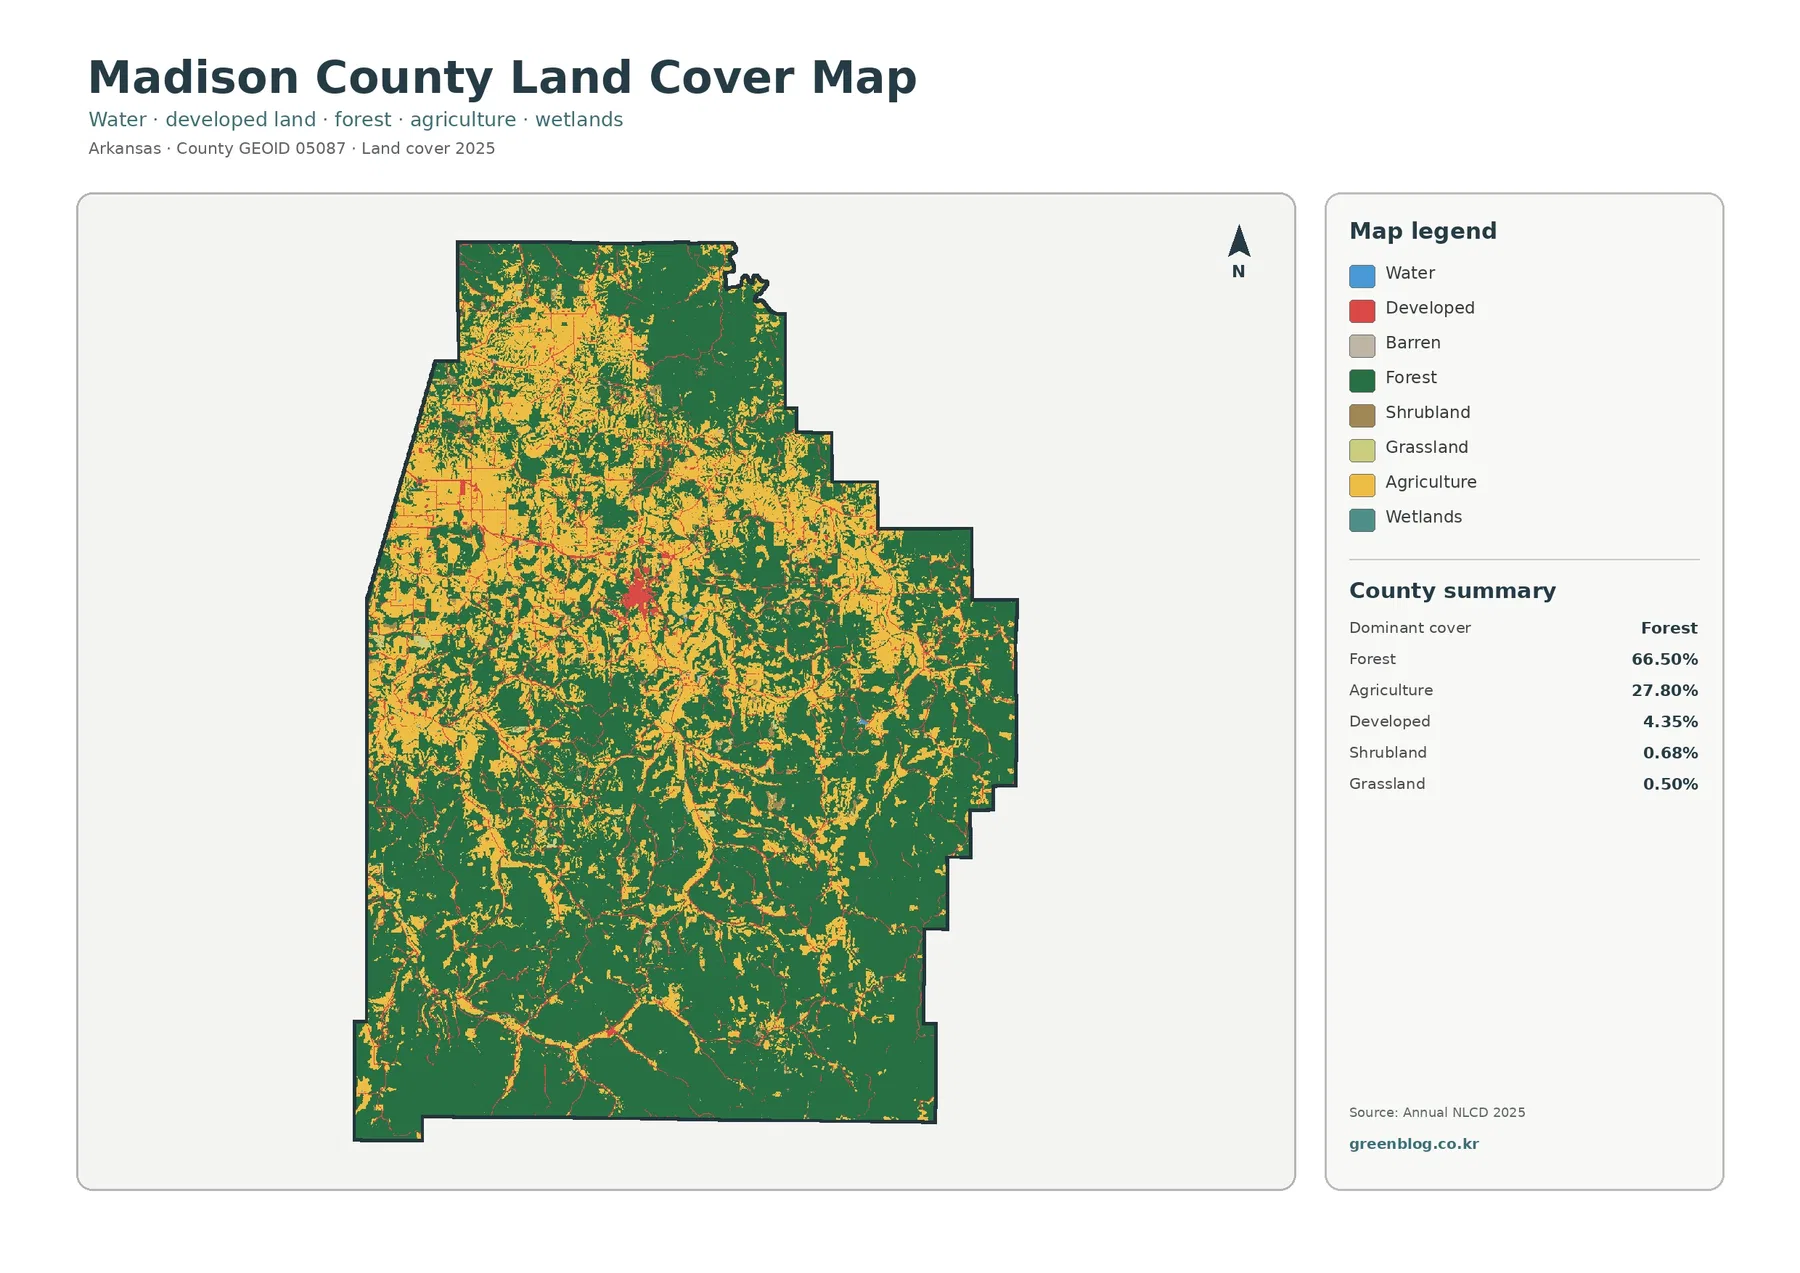
The summary panel lists forest at 66.50%, agriculture at 27.80%, developed cover at 4.35%, shrubland at 0.68%, and grassland at 0.50%. Water and wetlands are present in the legend but occupy only a very small part of the countywide map. The dominant green is therefore not a subtle pattern: it covers most of the county outline. Even so, the agricultural color forms large areas in the northwest and smaller openings throughout the interior, so the county is not simply one continuous block of forest.
The east and much of the south appear especially wooded. Agricultural areas there are more often broken into narrow or irregular openings surrounded by forest, while the northwest contains broader light-colored areas. That contrast is useful because it suggests where an average county percentage can hide important local differences. A person comparing only the 66.50% forest value would miss the fact that some parts of Madison County are much more open than others. The map is most informative when the proportions and the shapes of the colored areas are considered together.
Madison County lies in the Arkansas Ozarks, and regional sources provide useful context for the wooded pattern. The Encyclopedia of Arkansas notes that the Boston Mountains extend across the southern part of the county. Arkansas Natural Heritage Commission material for Kings River Falls Natural Area describes mixed hardwood forest on slopes and ridges where the Springfield Plateau meets the Boston Mountains. Those sources do not determine the map percentages, but they help explain why a forest-dominated land-cover image is consistent with the county’s documented landscape.
A red developed cluster is visible near the middle of the county. Huntsville, the county seat, is also described by Arkansas sources as being near the geographic center of Madison County. Smaller developed pixels and thin lines extend away from that central concentration, but they do not form a broad urban field. This difference between a small built core and an otherwise forest-and-agriculture landscape becomes much clearer in the impervious-surface map later on the page.
Land cover should not be confused with zoning, ownership, or legal land use. Annual NLCD classifies the surface into broad categories such as forest, agriculture, developed land, water, and wetlands. A forest-classified pixel does not tell you who owns the land, and an agriculture-classified pixel does not specify a crop, property boundary, or development right. Parcel decisions require property records, current local maps, and other site-specific information beyond this countywide raster product.
Huntsville Stands Out More Clearly When the Map Is Reduced to Impervious Surface
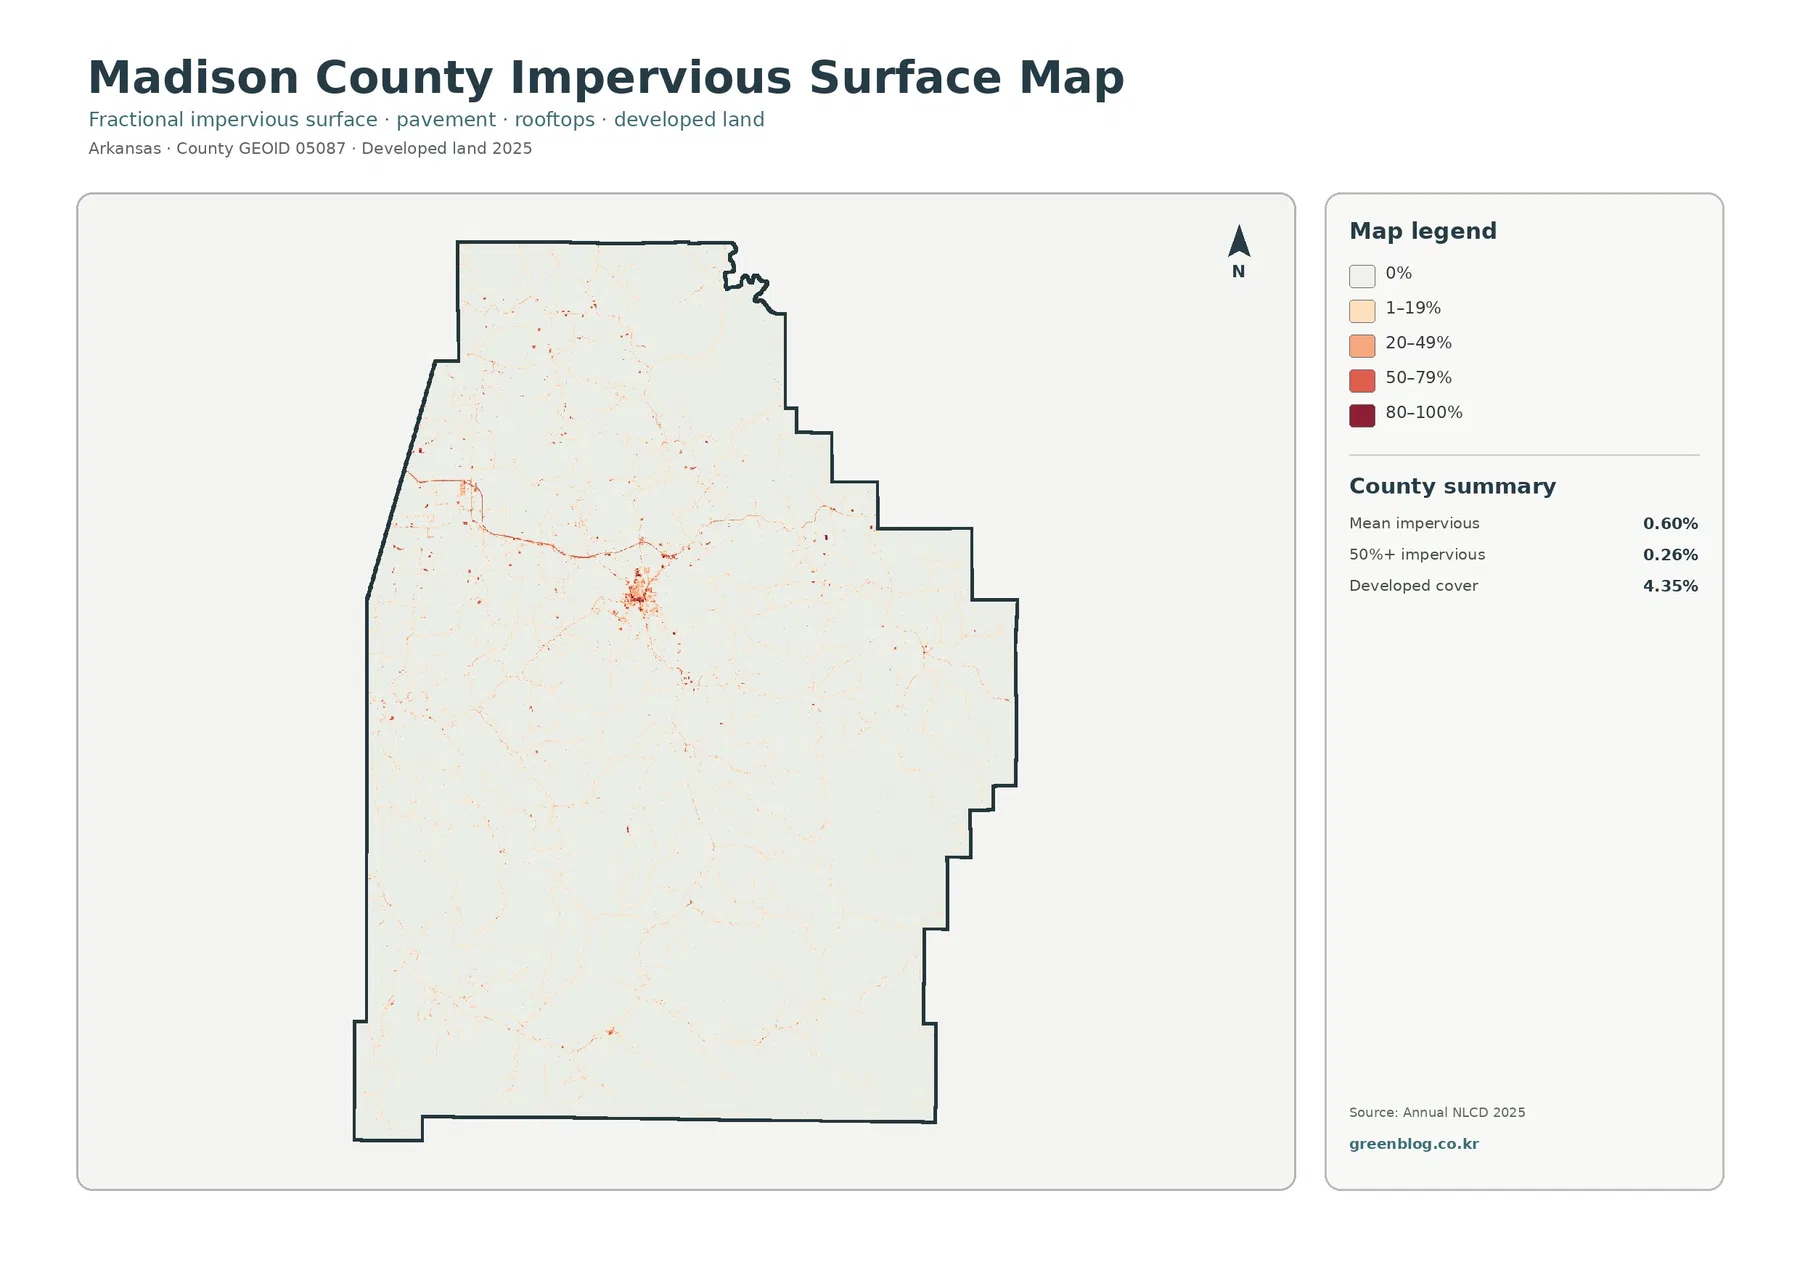
The impervious-surface view measures a different thing from the broad developed class. Its summary reports a mean impervious value of 0.60%, while 0.26% of the county has imperviousness of 50% or greater. Developed cover on the general map is 4.35%. The gap between these figures is expected because developed land can include lawns, trees, soil, and other surfaces that still absorb water. Imperviousness focuses more directly on the fraction covered by pavement, rooftops, concrete, and similar constructed materials.
The strongest red area is concentrated around the central Huntsville area, where numerous short lines and small patches converge. From that core, thinner traces extend east and west and branch in other directions. The map does not label roads, so it should not be used to name a specific corridor without another reference. What it does show clearly is that hard surfaces are concentrated in a small central network rather than spread evenly across Madison County. Most of the remaining county is very pale by comparison.
The northwest, despite its larger agricultural openings, remains lightly colored on the impervious map except for narrow lines and small scattered sites. That distinction helps separate an open farm landscape from a developed one. Large areas can lack continuous forest without becoming heavily paved. Reading the forest-and-farmland map beside this view makes the difference obvious: agricultural cover occupies substantial space, yet high impervious values remain limited to a much smaller footprint.
Annual NLCD fractional impervious surface is based on 30-meter raster pixels. A narrow road or isolated building can therefore be generalized, and a pixel can contain both hard and permeable surfaces. Lines may appear thicker, thinner, or broken depending on the display scale. This map is useful for locating countywide concentrations of built surface, but it is not a substitute for a road engineering plan, building footprint layer, stormwater survey, or parcel map.
The Forest-and-Farmland View Separates Broad Northwest Openings from Narrower Interior Valleys
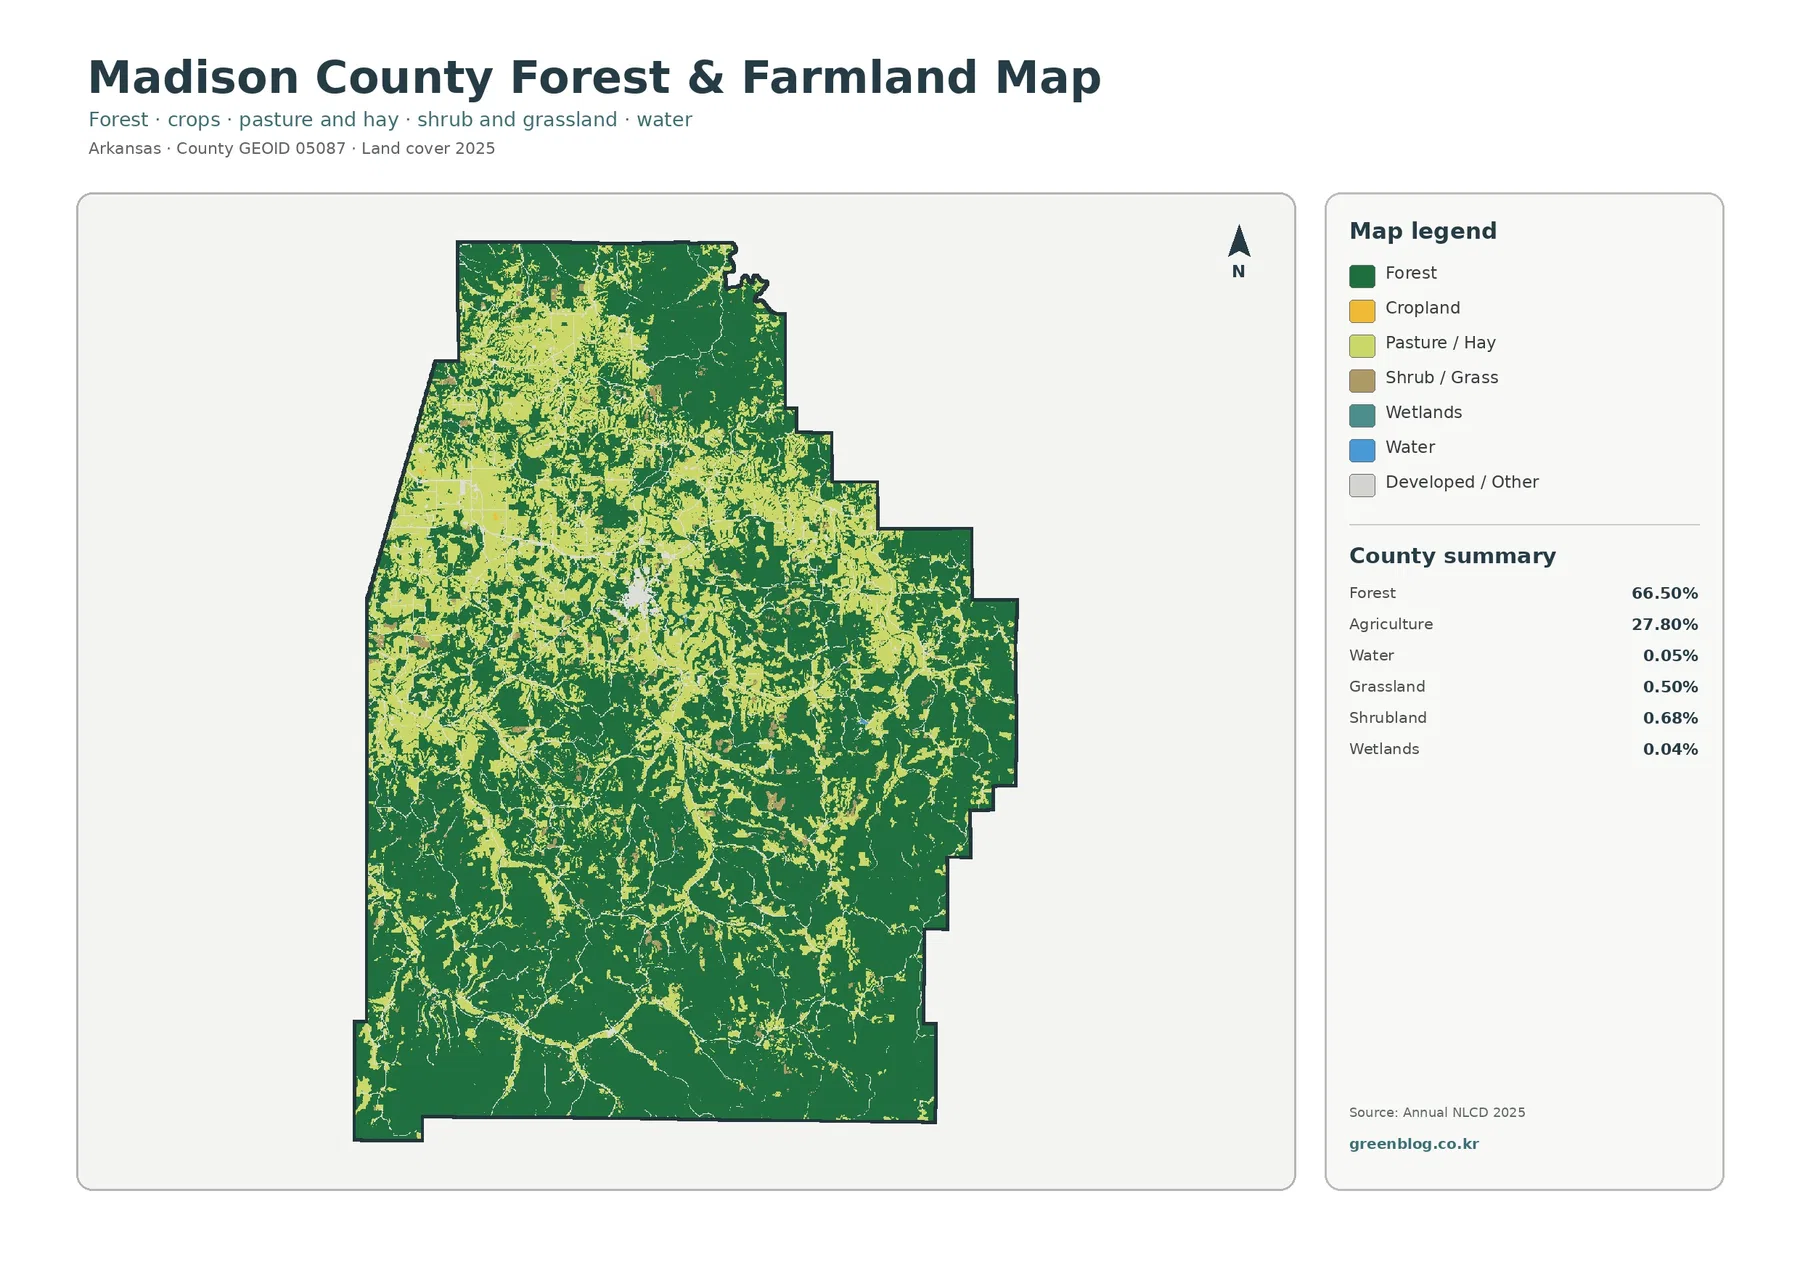
The simplified forest-and-farmland map lists forest at 66.50% and agriculture at 27.80%, with water at 0.05%, grassland at 0.50%, shrubland at 0.68%, and wetlands at 0.04%. Removing much of the developed-class detail lets the pattern of open land stand out. The northwest contains the largest connected agricultural areas, while the center shows a more fragmented mixture. Farther south, many agricultural areas become smaller and more elongated within a broad field of forest.
Agriculture in this map is a grouped land-cover category, and the legend distinguishes cropland from pasture/hay in the displayed classes even though the county summary combines them into one agriculture figure. The map therefore should not be used to claim an exact crop acreage or livestock area without an agricultural statistics source. Its strength is spatial: it shows where farm and pasture-type cover is more common relative to forest, and where the county transitions back to mostly wooded terrain.
The Kings River provides a useful local reference for the county’s wooded terrain. Arkansas Natural Heritage Commission material states that the river originates east of Boston in Madison County and flows north through the Ozarks. The same source describes mixed hardwood forest and steep rocky slopes around Kings River Falls Natural Area. Arkansas Game and Fish Commission information for McIlroy Madison County WMA likewise describes rugged Ozark terrain, extensive upland hardwood and shortleaf pine forest, and numerous small tributaries of the Kings River.
Water and wetland percentages are tiny in the county summary, so blue and wetland colors do not dominate this particular map set. That does not mean streams are unimportant on the ground. At 30-meter resolution and countywide display scale, a narrow stream may occupy only a small fraction of the image and can be difficult to see. Anyone studying stream corridors, floodplains, or riparian vegetation should combine these land-cover views with a dedicated hydrography layer and current imagery.
The 1985–2025 Comparison Is Dominated by Forest-Loss Classification Rather Than Urban Change
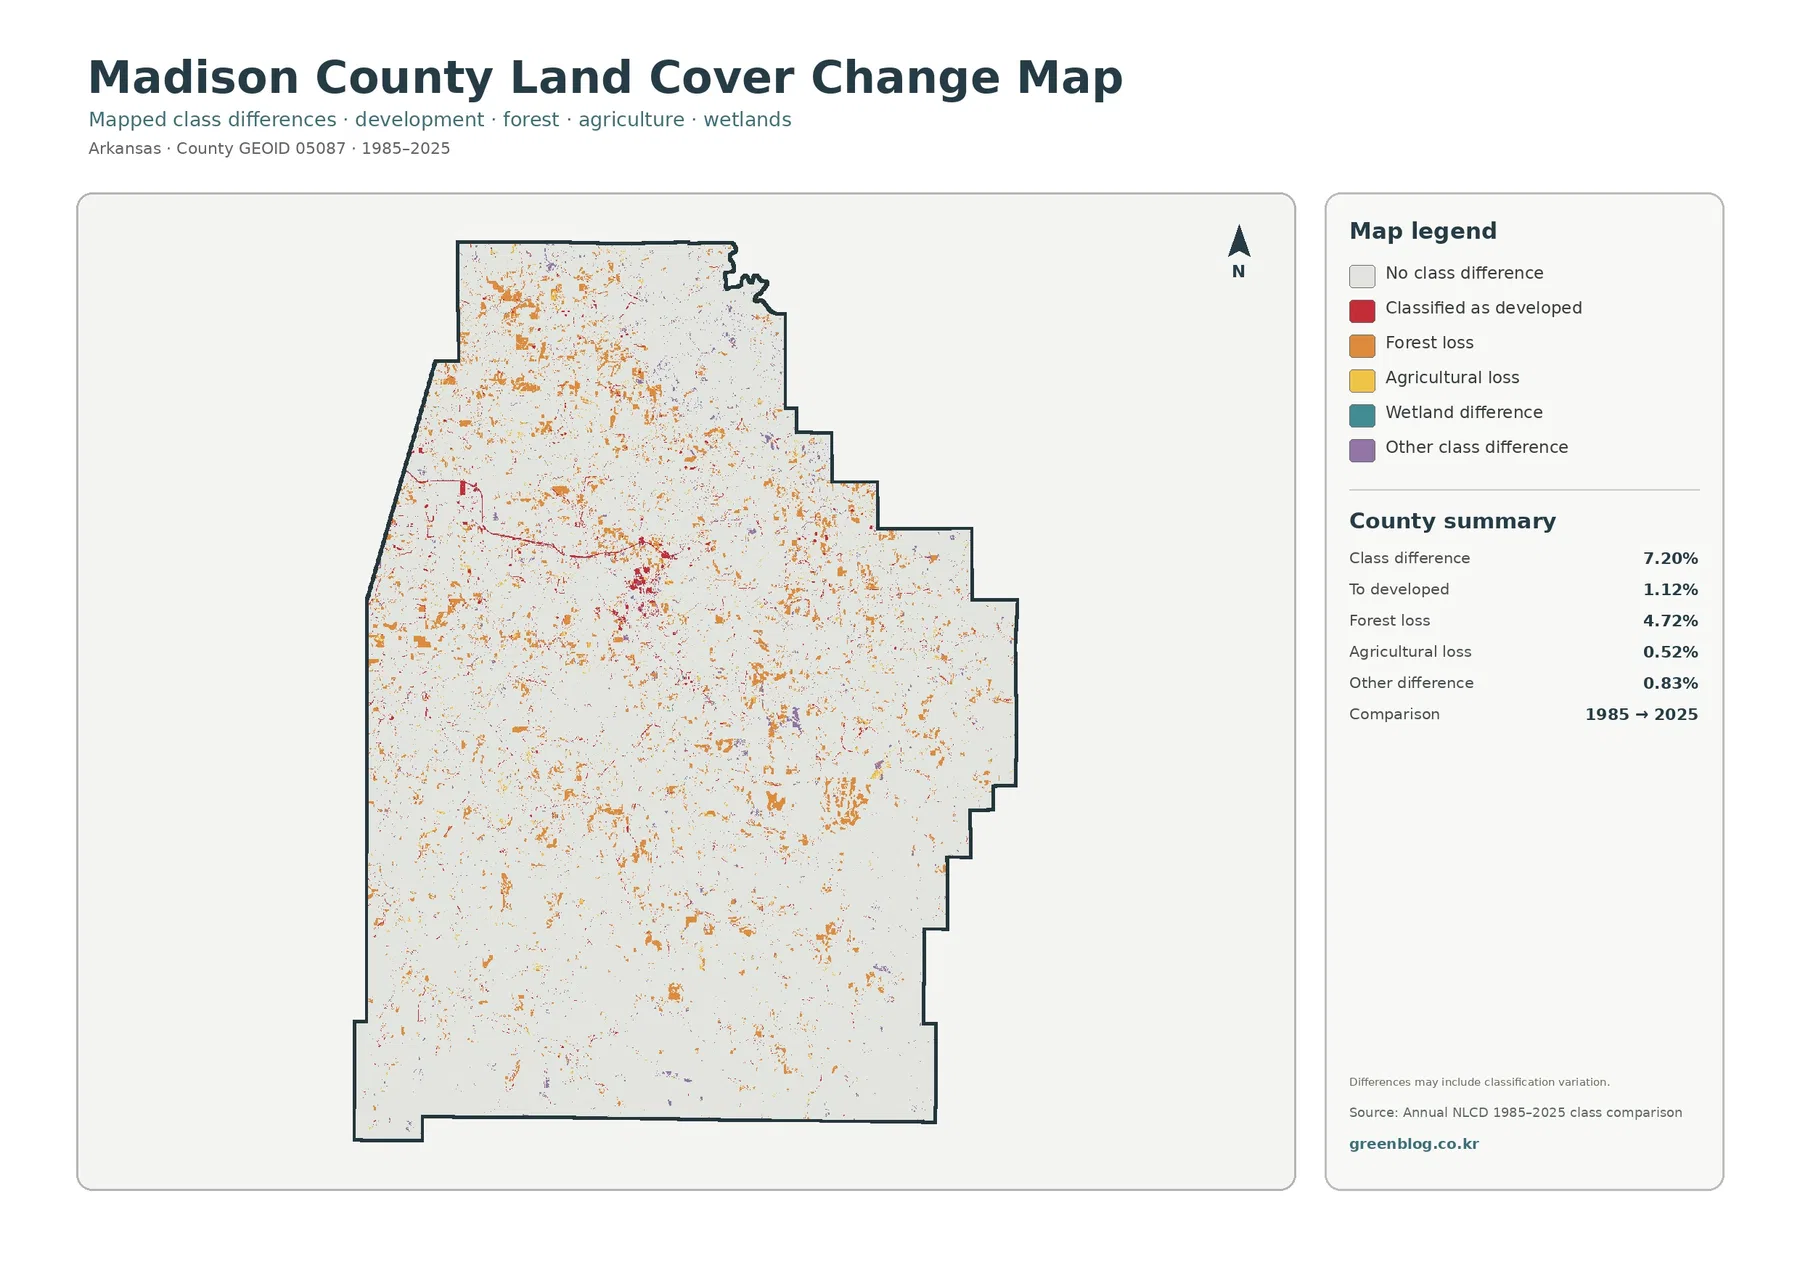
The change summary reports that 7.20% of mapped cells differ between the 1985 and 2025 comparison. Forest-loss classification accounts for 4.72%, change to developed for 1.12%, agricultural loss for 0.52%, and other difference for 0.83%. Wetland difference is shown in the legend but is not assigned a separate percentage in the printed summary. It is better to leave that value unstated than to derive a number that the supplied map does not verify.
Orange forest-loss cells are the most widespread change color. They are especially noticeable across the north and northwest, with additional clusters scattered through the center and south. Because the current map still shows 66.50% forest, these two facts can coexist: Madison County can remain strongly forested while some locations are classified differently from forest in the two-year comparison. The map identifies where to investigate, not why a particular change occurred.
Red change-to-developed cells concentrate most clearly near Huntsville and along a thin central corridor. The current impervious-surface map also shows the county’s strongest hard-surface cluster in that general area. Comparing the two views is useful, but the 1.12% figure is not a construction permit total or a measured amount of newly paved land. The change layer compares land-cover classes in two years, so a causal explanation requires aerial photographs, planning records, or other historical evidence.
The map itself warns that differences can include classification variation. Satellite observations, model updates, vegetation condition, and mixed pixels can all affect which category is assigned to a 30-meter cell. Edges between forest and agriculture are particularly important in Madison County because those two classes meet across many irregular boundaries. A colored change pixel near such an edge should be treated as a prompt for closer review rather than definitive proof of a specific land-use event.
A Practical Reading Order Keeps the Four Maps from Answering the Wrong Question
For a general description, begin with the 2025 land-cover map. It establishes the countywide proportions and shows the broad east-south forest dominance, the larger northwest agricultural openings, and the central developed core in one image. If your question is specifically about the relationship between forest and agriculture, move next to the simplified forest-and-farmland map. Fewer competing colors make the shape of open land easier to trace.
When development is the subject, use the impervious map rather than relying only on the red developed class in the general map. The 4.35% developed-cover figure and 0.60% mean imperviousness describe different properties of the landscape. Presenting them together can show why a developed area can still contain substantial permeable ground. Huntsville’s concentration is a good local example because it appears in both maps while the rest of the county remains comparatively light in the impervious view.
Use the change map after the present-day pattern is clear. That order makes it easier to distinguish current cover from a historical class difference. The orange forest-loss category, for example, can then be discussed in relation to today’s still-extensive forest without implying that the county has ceased to be forest-dominated. The same approach works for red development changes and the smaller agricultural-loss patches.
The four-map set is useful for teaching, regional comparison, environmental presentations, and preliminary landscape review because each image removes or emphasizes a different part of the same county. It is less appropriate for legal or parcel-scale decisions. A clear presentation should state the map year, explain the class being shown, and avoid converting a generalized raster pattern into a precise claim about a property or a cause of change.
Download the Four Original Madison County JPG Maps
The download ZIP contains four separate JPG files: the 2025 general land-cover map, forest and farmland map, impervious/developed-land map, and the 1985–2025 land-cover change map. According to the supplied asset manifest, each original JPG is 2480×1754 pixels. The on-page WebP previews are 1800×1273 pixels. The files are provided at the supplied resolution and are not described as newly upscaled or as meeting an A3 high-resolution reference that the manifest does not support.
Thirty-Meter Raster Cells Are Appropriate for County Patterns, Not Property Boundaries
USGS describes Annual NLCD Collection 1.2 as a 30-meter raster product. Raster means that the landscape is divided into a grid of cells, and each cell summarizes the surface within that area. A cell along a forest edge may contain trees, grass, a driveway, and a small building at the same time. The final land-cover class or impervious percentage simplifies that mixture, which is why narrow features and small patches can look different from high-resolution aerial imagery.
This limitation is particularly relevant in Madison County where forest and agricultural openings meet along many irregular boundaries. A staircase-shaped edge in the map is partly a result of the grid, not a survey of a fence line or field boundary. Small pastures, roadside tree strips, streams, and isolated structures can be blended into neighboring cells. Use the maps to compare broad zones and concentrations, not to calculate a legal acreage for an individual parcel.
The current maps are labeled 2025, and the change map compares 1985 with 2025. Anything that happened after the observation period may be absent. Surface appearance can also vary with season and vegetation condition. For current construction, forestry, farming, or property decisions, these maps should be paired with recent imagery and the appropriate county, state, or parcel-level sources.
Frequently Asked Questions
What is the largest land-cover class in Madison County?
Forest is the largest 2025 class at 66.50%, followed by agriculture at 27.80%. Developed cover is 4.35%, while shrubland and grassland are both below 1% in the printed summary. The broadest forest areas appear in the east and south, whereas the northwest contains larger agricultural openings.
Why does Huntsville appear much more strongly on the impervious-surface map?
Huntsville is the county seat and the main central settlement in Madison County. The impervious map highlights pavement, rooftops, and similar built surfaces, so the central cluster is much more visible than it is in a map dominated by forest and agriculture. The red area does not represent the city boundary; it represents the fraction of hard surface within raster cells.
Does 4.72% forest loss mean that exact area was logged?
No. The 4.72% figure is a land-cover class comparison between 1985 and 2025. It identifies cells classified as forest in the earlier comparison and as another class later, but it does not record the cause. Logging, agricultural conversion, vegetation change, or classification variation would require additional evidence to distinguish.
What files are included in the ZIP download?
The ZIP contains the four original JPG maps shown by topic on this page: 2025 general land cover, forest and farmland, impervious/developed land, and 1985–2025 land-cover change. They can be opened separately for printing, classroom use, presentations, or side-by-side county analysis.
Sources and Reference Material
- MRLC Annual NLCD Data — the official portal for Annual NLCD land-cover and related products.
- USGS Annual NLCD Collection 1.2 Land Cover — documents the 2025 extension of the series and its 30-meter raster resolution.
- Madison County Arkansas Government — the official county website for Madison County government in Huntsville.
- Arkansas Natural Heritage Commission: Kings River Falls Natural Area — describes Madison County Ozark terrain, the Kings River, and mixed hardwood forest.
- Arkansas Game & Fish Commission: McIlroy Madison County WMA — provides county-specific information on rugged Ozark terrain, forest cover, and Kings River tributaries.
Map File Information
The ZIP includes four original JPG maps for Madison County: 2025 land cover, forest and farmland, impervious/developed land, and 1985–2025 land-cover change.
- Included Files: land cover, forest/farmland, impervious/developed land, and land-cover change maps
- File Type: one ZIP containing four JPG files
Related Maps
- A Craighead County Arkansas Land Cover Map
- Arkansas County Arkansas Land Cover Map
- Ashley County Arkansas Land Cover Map
Green Map creates custom-edited map images using open geographic data sources such as geoBoundaries, Natural Earth, OpenStreetMap, and government open data.
These maps are edited visual materials, not raw data files, and are provided for education, documents, presentations, and graphic reference.