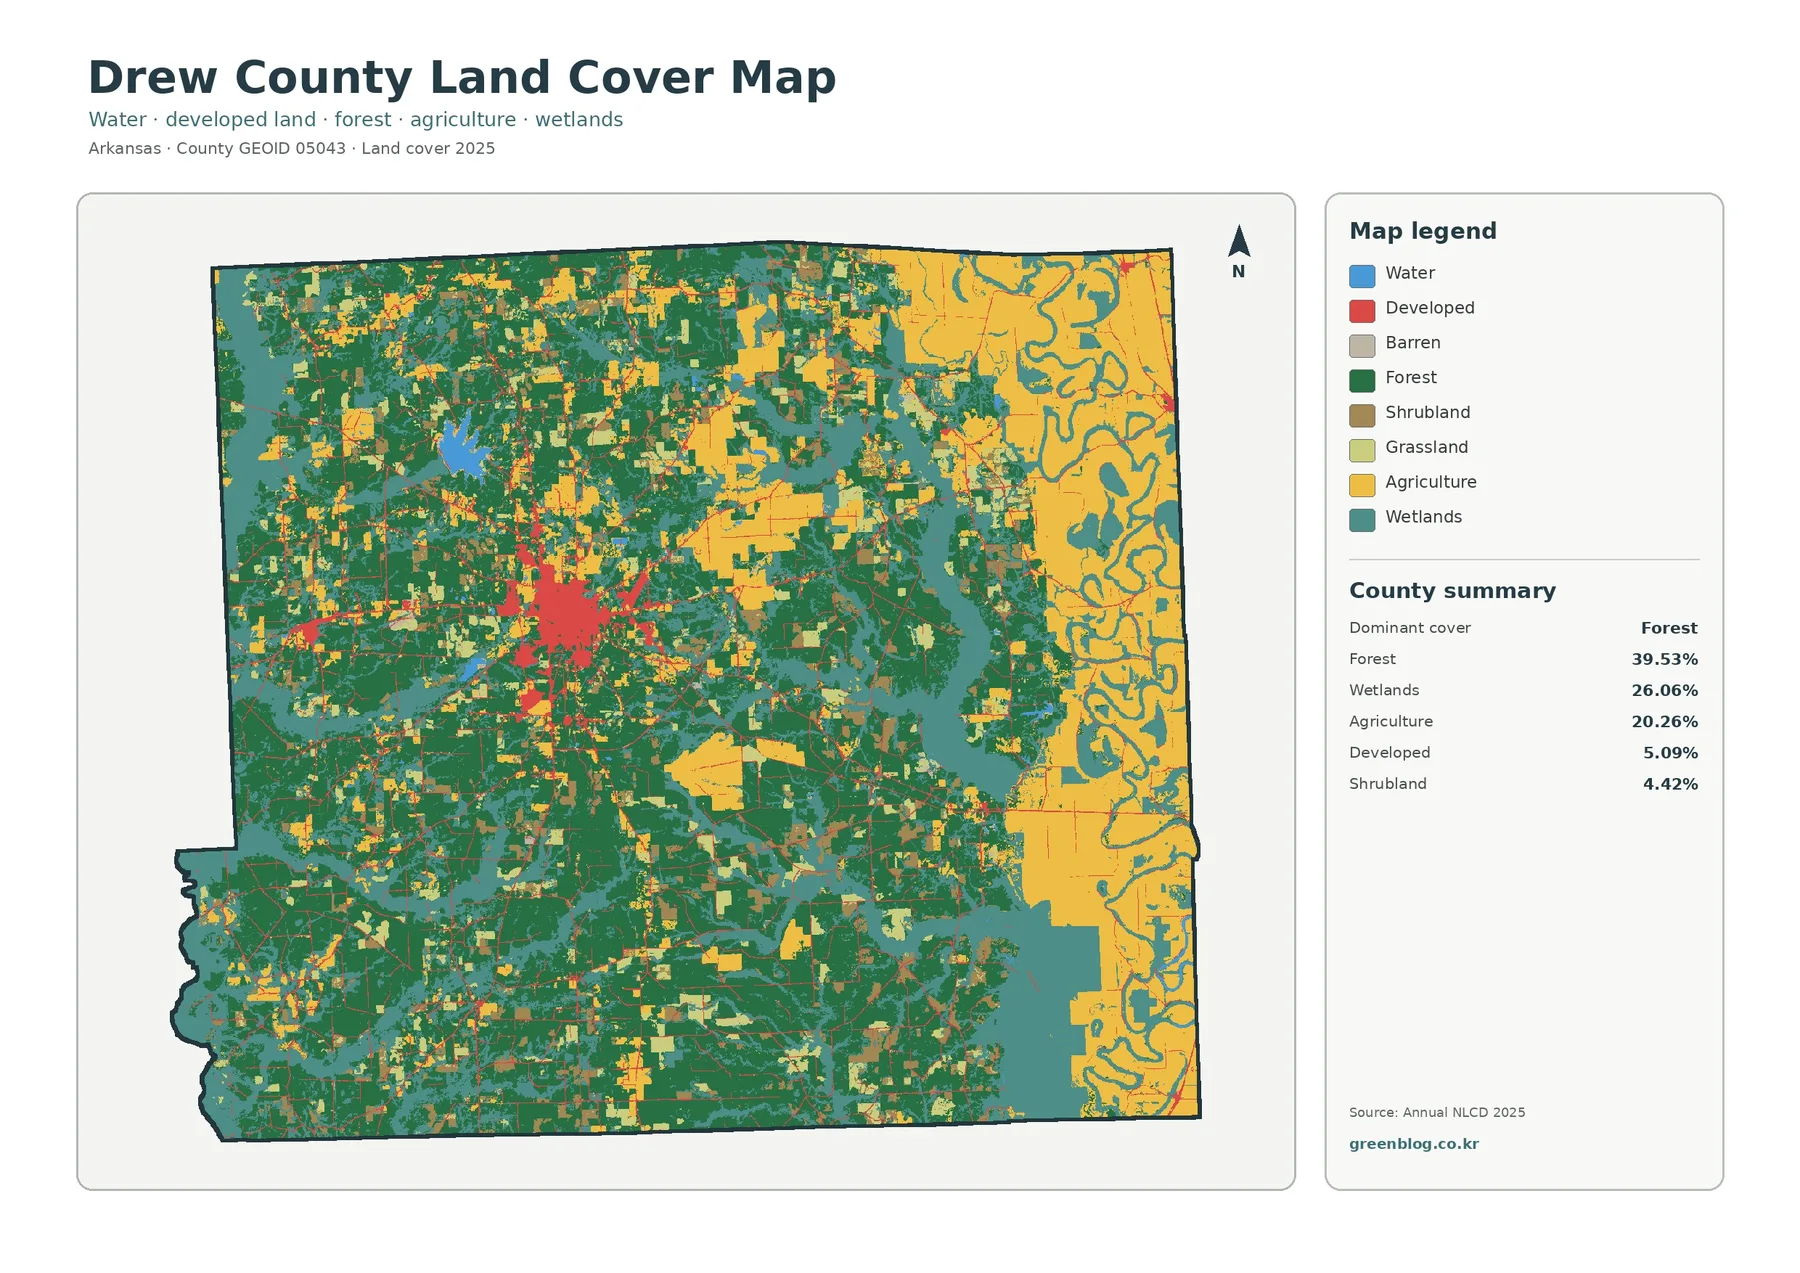
The Drew County Arkansas Land Cover Map set shows a county where forest, wetlands, and farmland occupy very different parts of the landscape. In the 2025 summary, forest leads at 39.53%, followed by wetlands at 26.06% and agriculture at 20.26%. Monticello’s compact developed area is easy to separate from the broad forest-wetland mosaic to the west and the larger farm blocks toward the east.
Four views are included here: general land cover, forest and farmland, impervious surface and developed land, and a 1985-to-2025 land-cover comparison. After reviewing the web previews, you can download all four original 2480 × 1754 JPG maps in one ZIP. The set works well for classroom geography, environmental comparison, local presentations, broad planning context, and projects that need a consistent county-scale map series.
Table of Contents
A county split among forested uplands, wet ground, and eastern fields
Forest is the largest 2025 class, but it does not cover Drew County as one continuous block. Dark green areas are broad across the central, western, and southern portions of the county, with many smaller openings and wet patches inside them. Wetlands form another major part of the pattern. They appear along curving drainage features, near the southwestern edge, through parts of the south, and in intricate strips along the eastern side. The result is a landscape where wooded and wet areas frequently sit next to one another rather than forming two simple zones.
Regional geography helps explain why the map changes so noticeably from side to side. The Encyclopedia of Arkansas places Drew County at the meeting area between the Mississippi Alluvial Plain and the West Gulf Coastal Plains. It also describes the Monticello Ridge uplands extending through the county, Bayou Bartholomew running along the eastern edge, and the Saline River forming the southwestern boundary. Those named features provide useful context for the visible pattern, although a land-cover map by itself does not prove why any single cell has a particular class.
Agriculture accounts for 20.26% of the county. The largest yellow blocks are in the east, where fields occupy broad areas between wetland channels and other water-related features. Smaller farm blocks are scattered through the north and central sections as well. This distribution matters because the countywide percentage alone can make agriculture seem secondary. On the eastern side, however, farmland is one of the dominant visual elements and contrasts strongly with the more wooded interior and west.
Developed land covers 5.09%. Its largest cluster is concentrated near the middle of the county around Monticello, while smaller developed traces follow roads and other settlements farther out. The University of Arkansas System Cooperative Extension maintains its Drew County office in Monticello and serves communities including Wilmar, Winchester, Jerome, and other parts of the county. That local reference helps place the central developed concentration within the otherwise rural map without treating every small developed pixel as an incorporated town.
Forest and farmland reveal the east-west contrast more clearly
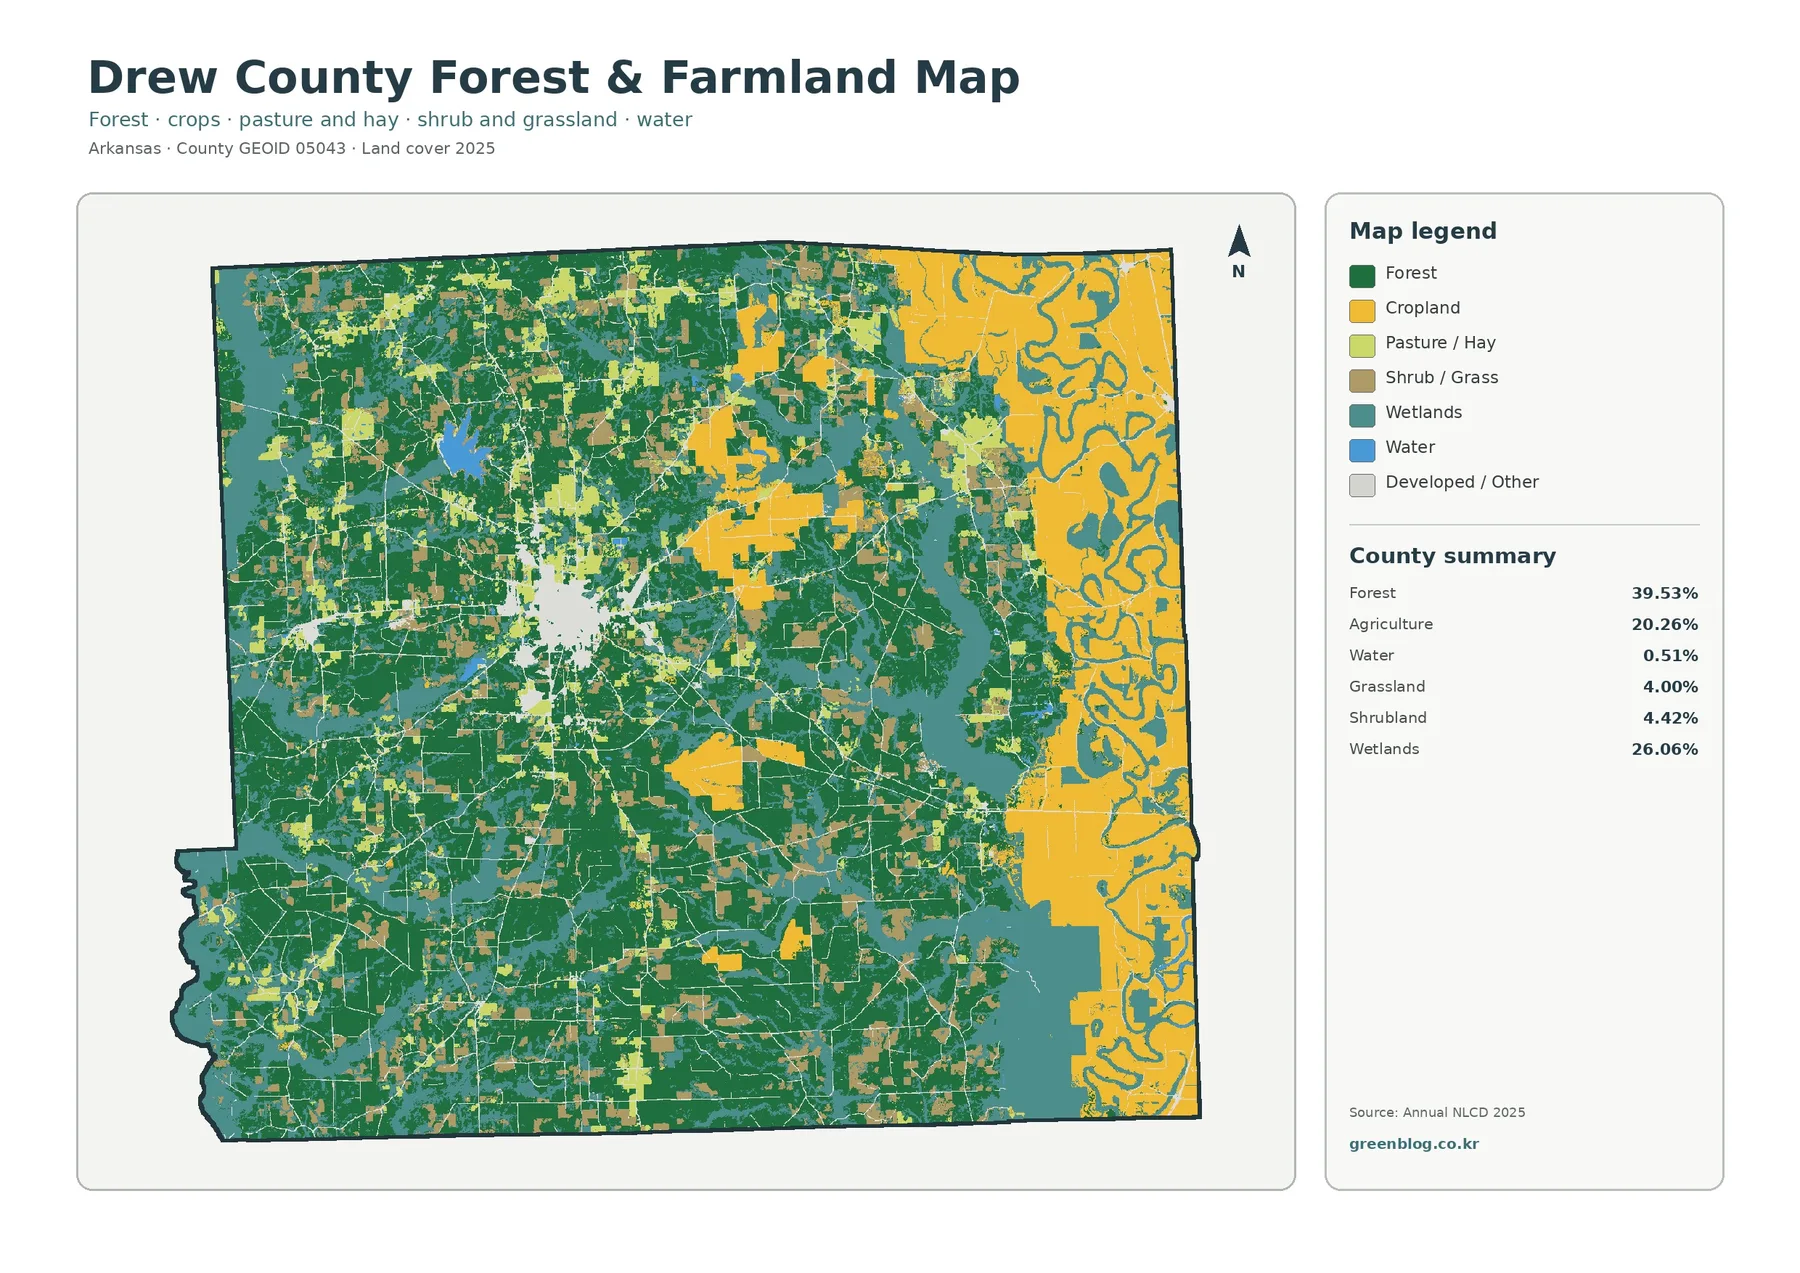
The forest-and-farmland view removes some of the visual competition of the full classification map. Forest remains dark green, cropland is yellow, pasture and hay are light green, and wetlands stay teal. With those groups emphasized, the broad wooded areas of central and western Drew County stand out immediately. The eastern side changes character, with large cropland blocks occupying much more of the visible area and wetland corridors weaving through them.
The summary for this view lists forest at 39.53% and agriculture at 20.26%. Grassland contributes 4.00%, shrubland 4.42%, water 0.51%, and wetlands 26.06%. These smaller classes matter because they prevent the county from being reduced to a simple forest-versus-farm comparison. Light green pasture or hay patches interrupt wooded areas, while wetland strips cut through both forested and agricultural settings. The same percentage can look very different depending on whether it is concentrated or scattered.
Bayou Bartholomew gives the eastern pattern useful geographic context. The Encyclopedia of Arkansas describes the bayou as following the eastern edge of Drew County and passing places associated with the county such as Jerome, Baxter, Tillar, and Winchester. Individual channels are not labeled, but the maze of teal wetland features and yellow fields along that side makes the relationship between agriculture and wet ground easy to see. For that contrast, this county-focused view is more informative than a generic statewide land-cover image.
The southwest looks different again. Near the Saline River boundary, forest and wetlands occupy a larger share of the visible landscape than they do in the eastern farm belt. This comparison is useful in environmental education because students can see that one county may include several distinct land-cover settings. It should not be used to infer ownership, zoning, protected status, or a legal wetland boundary. Those questions require parcel records and regulatory or management data.
Impervious cover is small countywide but concentrated around Monticello
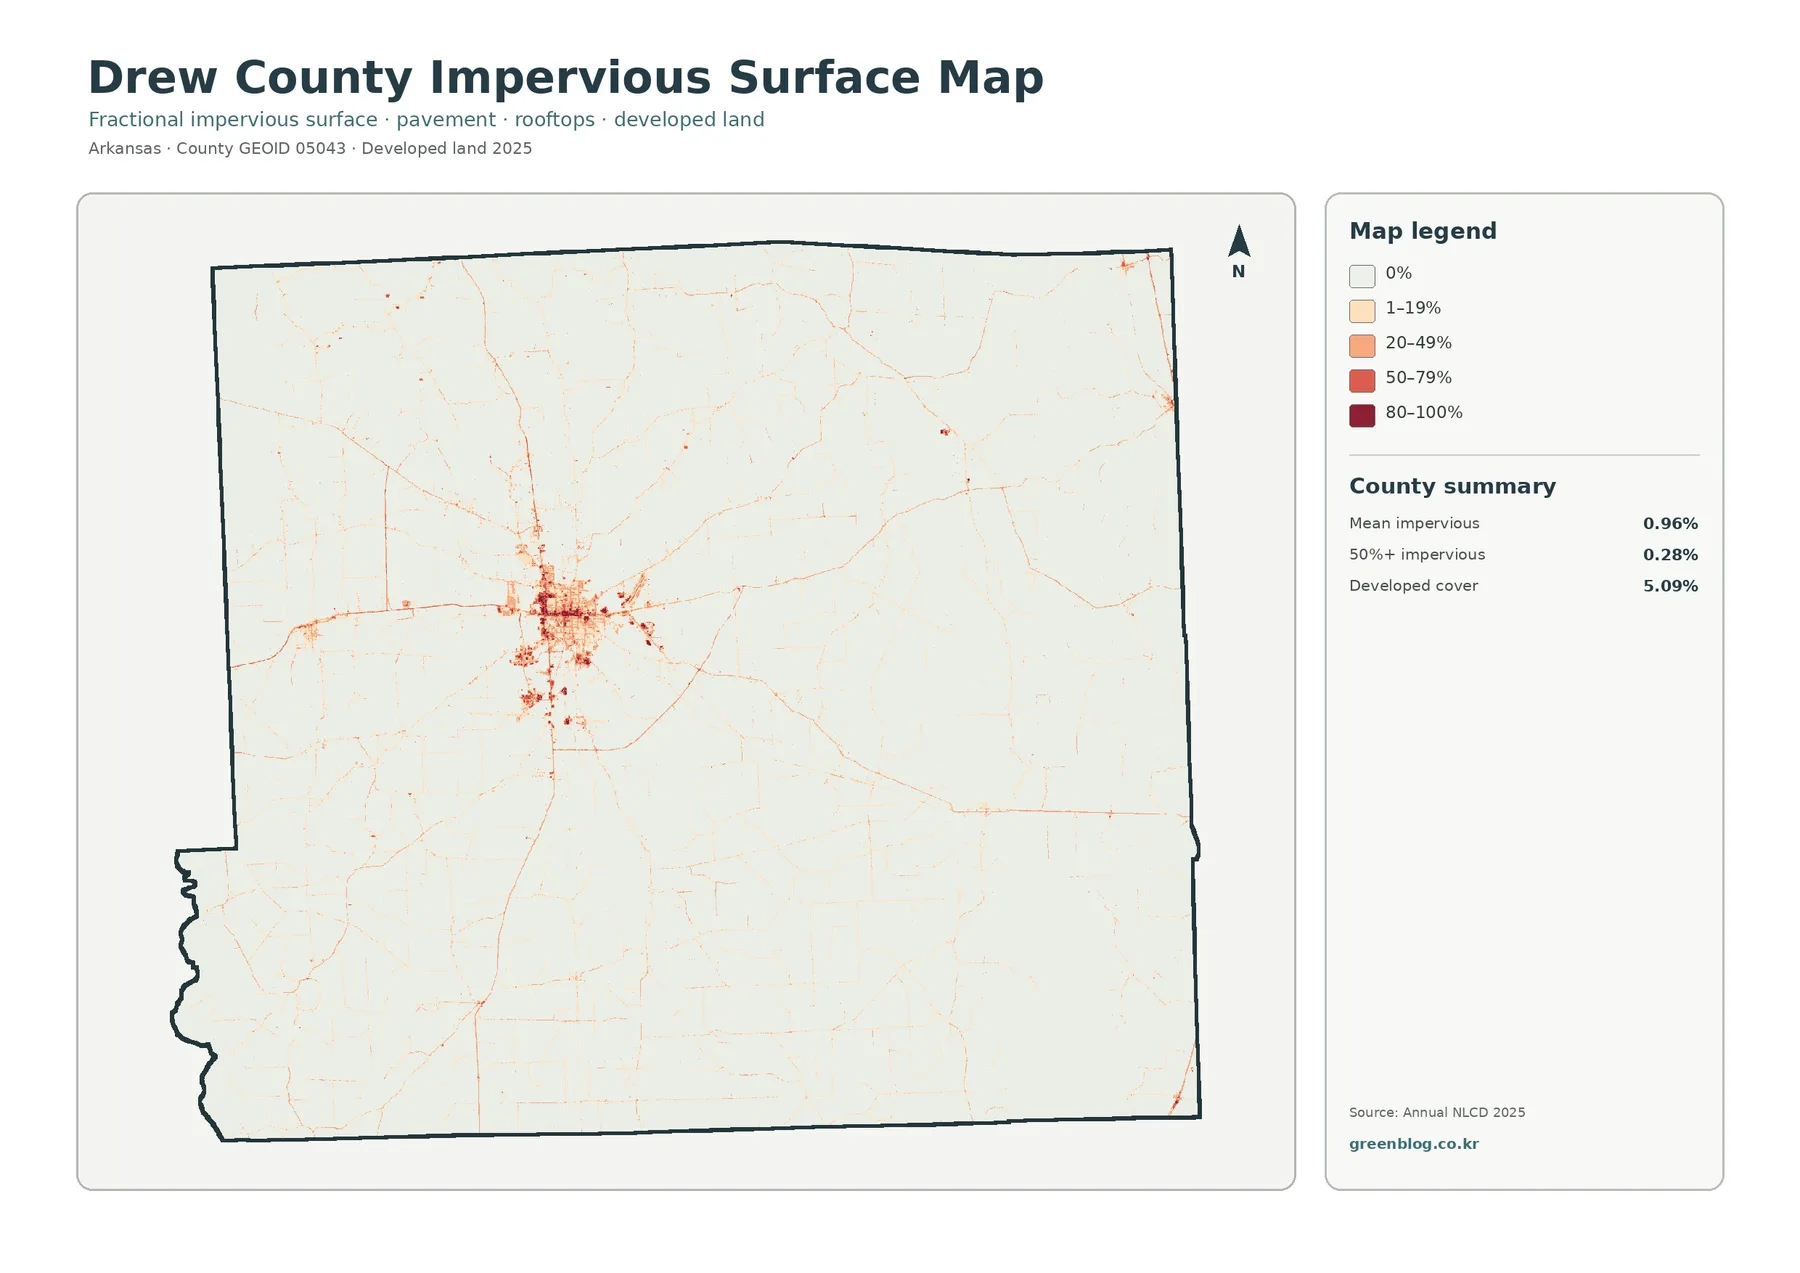
Impervious surface means pavement, rooftops, parking areas, and other surfaces that do not readily absorb water. Drew County’s mean impervious value is 0.96% in the supplied 2025 summary, and only 0.28% of the county is in areas mapped at 50% impervious or higher. Those values are much smaller than the 5.09% developed-land share because a developed classification can still include lawns, trees, bare soil, and other surfaces that allow some infiltration.
The strongest impervious concentration is clustered around Monticello. Darker tones form a compact central area, while thinner lines extend outward along roads. Away from that center, most of the county is very light on the impervious map. Small road segments and settlement points remain visible in agricultural and forested areas, but they are sparse compared with the central cluster. This makes the view particularly useful when the subject is settlement pattern rather than the full mix of natural cover types.
Comparing the impervious map with the general land-cover view also prevents a common misunderstanding. A red developed polygon on the general map does not mean every square meter is pavement or a building. The impervious layer provides a more direct picture of hardened surfaces within those developed areas. For a presentation about Monticello and the surrounding rural county, the two maps can be placed side by side to distinguish the broader developed footprint from the most intensively paved parts.
High impervious values do not automatically identify flood hazards or polluted runoff. Rainfall, slope, soil, drainage infrastructure, nearby streams, and wetland conditions all affect how water moves. At county scale, the impervious layer is most useful for locating concentrations of paved and built surfaces. Engineering drainage data, flood mapping, or a parcel-level site assessment is still needed for those questions.
The 1985–2025 comparison marks 20.87% class difference
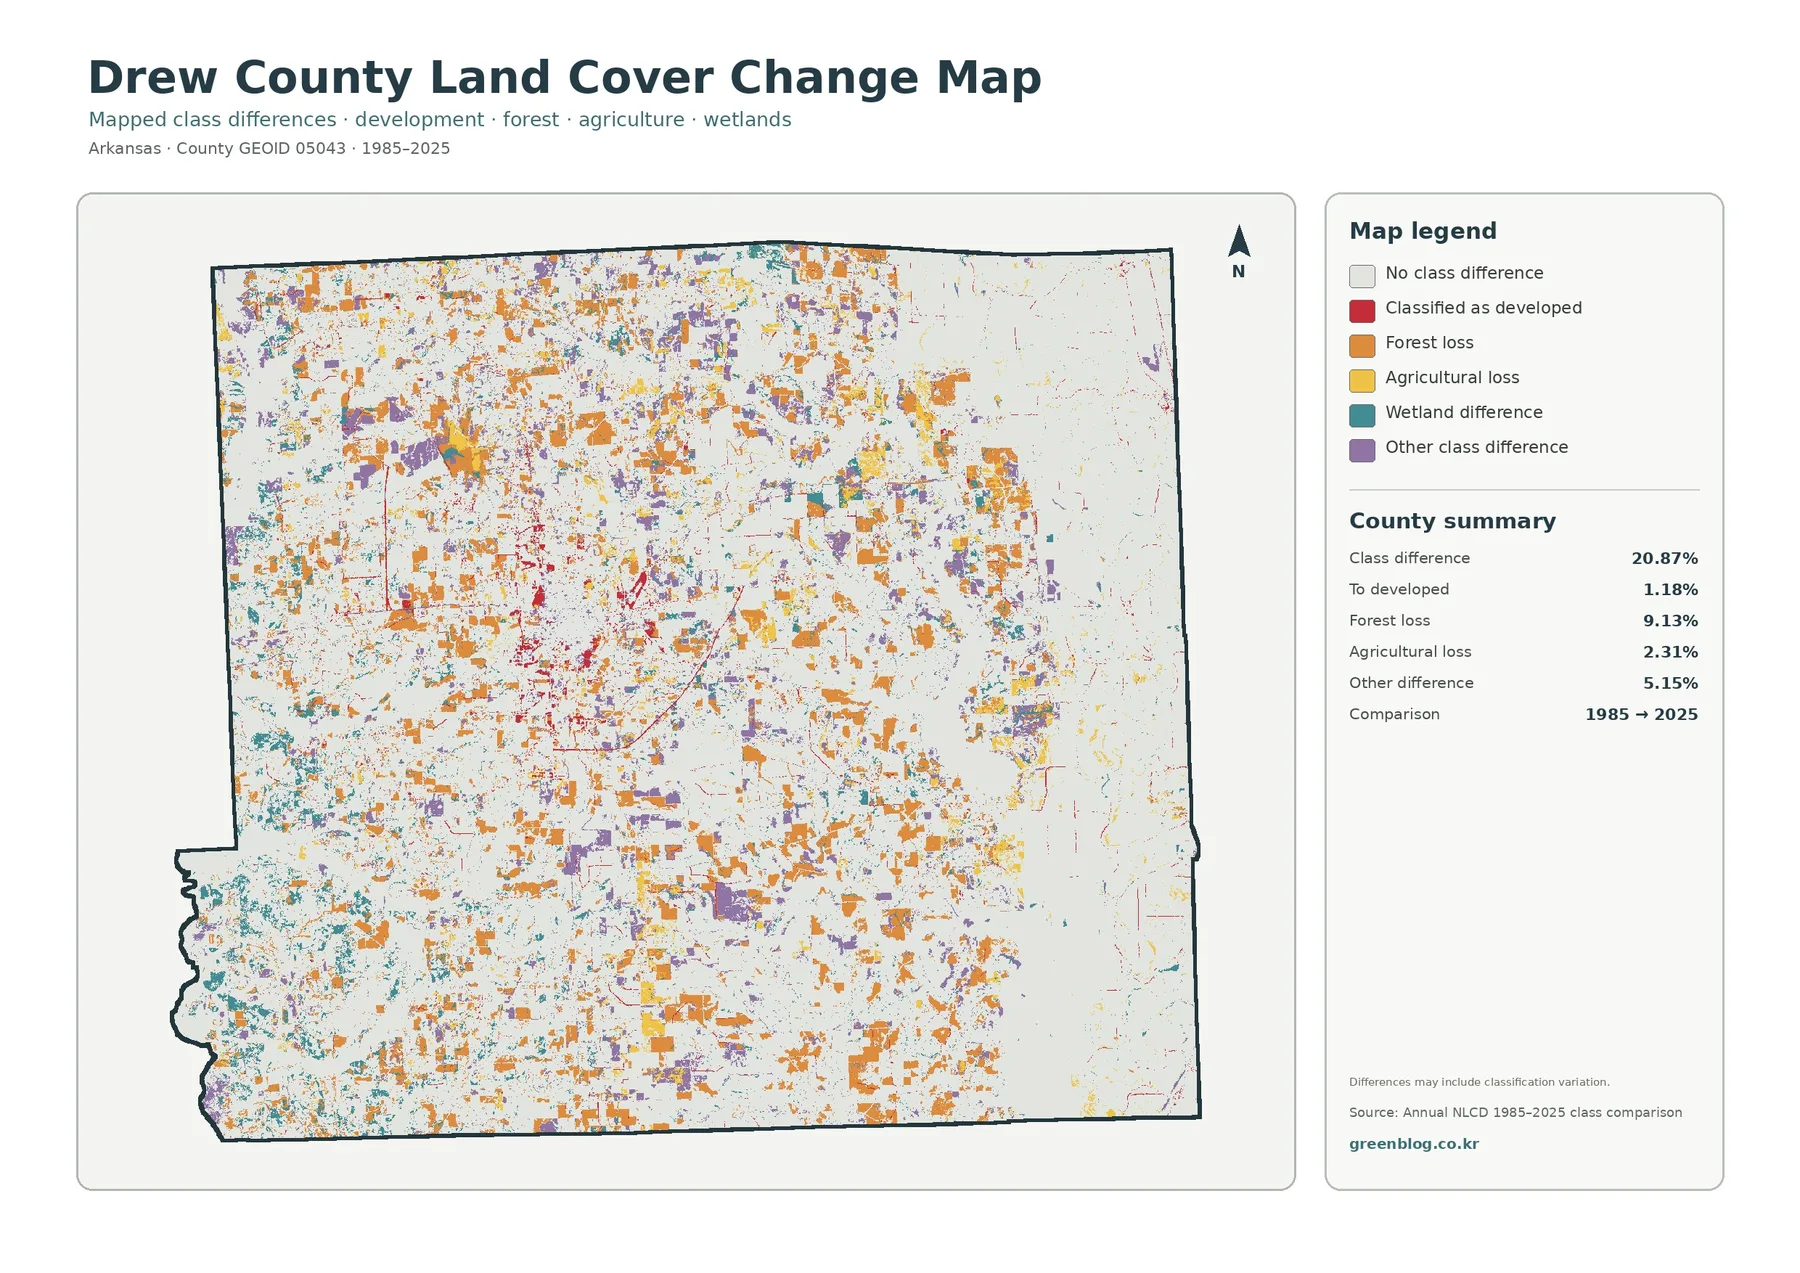
The change map compares the land-cover classification at the same locations in 1985 and 2025. Its county summary reports a total class difference of 20.87%. That number is not a development rate. Only 1.18% is mapped as becoming developed in the comparison, while forest loss is 9.13%, agricultural loss is 2.31%, and other class difference is 5.15%. Wetland differences are shown separately on the map as teal areas.
Orange forest-loss patches are scattered broadly across the central, western, and southern portions of the county. Red areas classified as developed are more concentrated around Monticello and along selected road corridors. Yellow agricultural-loss patches appear in smaller blocks, including parts of the eastern and central landscape. Large pale areas show locations where the broad class did not differ between the two comparison years, so the map still contains substantial stable-looking territory.
A colored change cell identifies a difference between two classifications, not a verified cause. A forest-loss cell could reflect harvest, conversion, disturbance, or another transition that cannot be determined from this image alone. Agricultural loss likewise does not tell the reader what replaced agriculture. Small differences can also arise where several land-cover types fall within one 30-meter raster cell, producing a mixed pixel that may classify differently between years.
For that reason, the comparison is most useful after the 2025 map has established the present landscape. First locate current forest, wetlands, fields, and development; then look at where the change colors occur within those settings. A site-specific history would require intermediate satellite imagery, aerial photography, field information, or land-management records. The county map is a screening and teaching tool rather than a chronological record for every parcel.
Why percentage and location should be read together
Forest and wetlands together occupy a large share of Drew County, but their shapes are not interchangeable. Forest tends to form broad blocks and mosaics, while many wetland features follow lower, curving, or channel-like areas. Agriculture occupies a smaller countywide share than forest, yet it dominates much of the eastern visual field because it is concentrated there. A county percentage answers “how much,” while the map answers “where.” Both are needed for a useful description.
The same principle applies to developed land and impervious cover. Developed land is 5.09%, while mean impervious cover is 0.96%. The first value describes a broader land-cover class associated with built environments; the second focuses on surfaces such as pavement and rooftops. Around Monticello, using both views makes it possible to discuss the extent of the developed area without implying that the entire red zone is fully paved.
Land cover should also be kept separate from legal land use. A pixel classified as agriculture does not identify the crop, farm owner, zoning category, or development rights. Forest color does not identify tree species or management status, and mapped wetlands are not automatically the same as jurisdictional wetland boundaries. These maps are generalized satellite-derived classifications designed for broad comparison, not parcel surveys.
Choosing the right map for classwork, reports, and presentations
Use the general land-cover map when the goal is to introduce Drew County in one image. It puts forest, wetlands, farmland, water, and development on the same page and makes the eastern farm belt easy to compare with the more wooded interior. A geography lesson can pair that view with the county’s position between the Mississippi Alluvial Plain and West Gulf Coastal Plains to explain why the visual contrast deserves closer attention.
The forest-and-farmland map is more effective when the topic is agriculture, woodland, or the relationship between those cover types and wet areas. Simplified colors make the eastern cropland blocks stand out, while the central and western forest remains easy to follow. For a lesson about Bayou Bartholomew, the wetland corridors on the eastern side provide a useful visual reference, though detailed hydrology should come from a dedicated water dataset.
Choose the impervious map for development and transportation context. Monticello’s concentrated built surface is easy to distinguish from the low-impervious rural surroundings. Choose the change map when the project needs a long-term comparison, but keep the legend visible and explain that 20.87% total class difference is not the same as 20.87% urbanization. A current map and a change map shown together make that distinction much easier for an audience to understand.
Scale, 30-meter cells, and the date of the classification
Annual NLCD-style land-cover information divides a broad landscape into raster cells, or small grid squares, and assigns each cell a representative class. At the common 30-meter scale, a single cell can contain trees, a road, grass, a ditch, or the edge of a field at the same time. Narrow streams, small buildings, field edges, and other fine features may therefore appear simplified or may be represented by the dominant surrounding class.
The current maps in this package are labeled 2025. Any construction, forest management, agricultural change, storm damage, or wetland change after that observation period will not be reflected. If a project depends on current site conditions, recent aerial imagery, local records, and field inspection should supplement these maps. Their strongest use is consistent countywide comparison rather than exact parcel measurement.
Comparing classifications from two different years requires an extra layer of caution. Some difference cells can reflect a true land-cover transition, while others may be influenced by mixed pixels, image conditions, or classification behavior near boundaries between cover types. Look first for broad repeated patterns, then investigate individual locations with more detailed sources. That workflow keeps the maps useful without asking them to provide more certainty than the data support.
Download the four original Drew County JPG maps
The download ZIP contains one original JPG for each view described on this page: general land cover, forest and farmland, impervious surface and developed land, and the 1985–2025 land-cover comparison. Each supplied original is 2480 × 1754 pixels. Keeping the four maps together makes it easy to move from an overview to a focused forest-farmland comparison, a built-surface view, or a long-term change graphic without mixing unrelated county sources.
Frequently Asked Questions
What is the largest land-cover class in Drew County in 2025?
Forest is the largest class at 39.53%. Wetlands account for 26.06%, agriculture 20.26%, developed land 5.09%, and shrubland 4.42%. Forest is especially prominent through the central, western, and southern portions, while the largest agricultural blocks are concentrated in the east.
Why is developed land 5.09% when mean impervious cover is only 0.96%?
A developed land-cover class can include yards, trees, bare soil, and other permeable surfaces along with buildings and pavement. Impervious cover measures the harder surfaces more directly. That is why the county’s developed share can be several times larger than its mean impervious percentage.
Does the 20.87% class difference mean that 20.87% of Drew County was developed after 1985?
No. The 20.87% total class difference between 1985 and 2025 includes only 1.18% categorized as becoming developed. Forest loss is 9.13%, agricultural loss is 2.31%, and other class difference is 5.15%. Some small differences may also reflect mixed pixels or classification variation rather than a simple one-way land-use change.
Map File Information
The ZIP contains the four original Drew County land-cover JPG maps described on this page.
- File Type: Four JPG files in one ZIP archive
Related Maps
- A Craighead County Arkansas Land Cover Map
- Arkansas County Arkansas Land Cover Map
- Ashley County Arkansas Land Cover Map
Sources and reference material
- MRLC Annual NLCD Data – official access point for annual land-cover datasets.
- USGS Annual NLCD Land Cover Classification – class definitions for developed land, forest, agriculture, wetlands, water, and related categories.
- University of Arkansas System Cooperative Extension – Drew County – local agriculture, natural-resources, and community program information.
- Encyclopedia of Arkansas – Drew County – geographic context for Bayou Bartholomew, the Saline River, and Monticello Ridge.
Green Map creates custom-edited map images using open geographic data sources such as geoBoundaries, Natural Earth, OpenStreetMap, and government open data.
These maps are edited visual materials, not raw data files, and are provided for education, documents, presentations, and graphic reference.