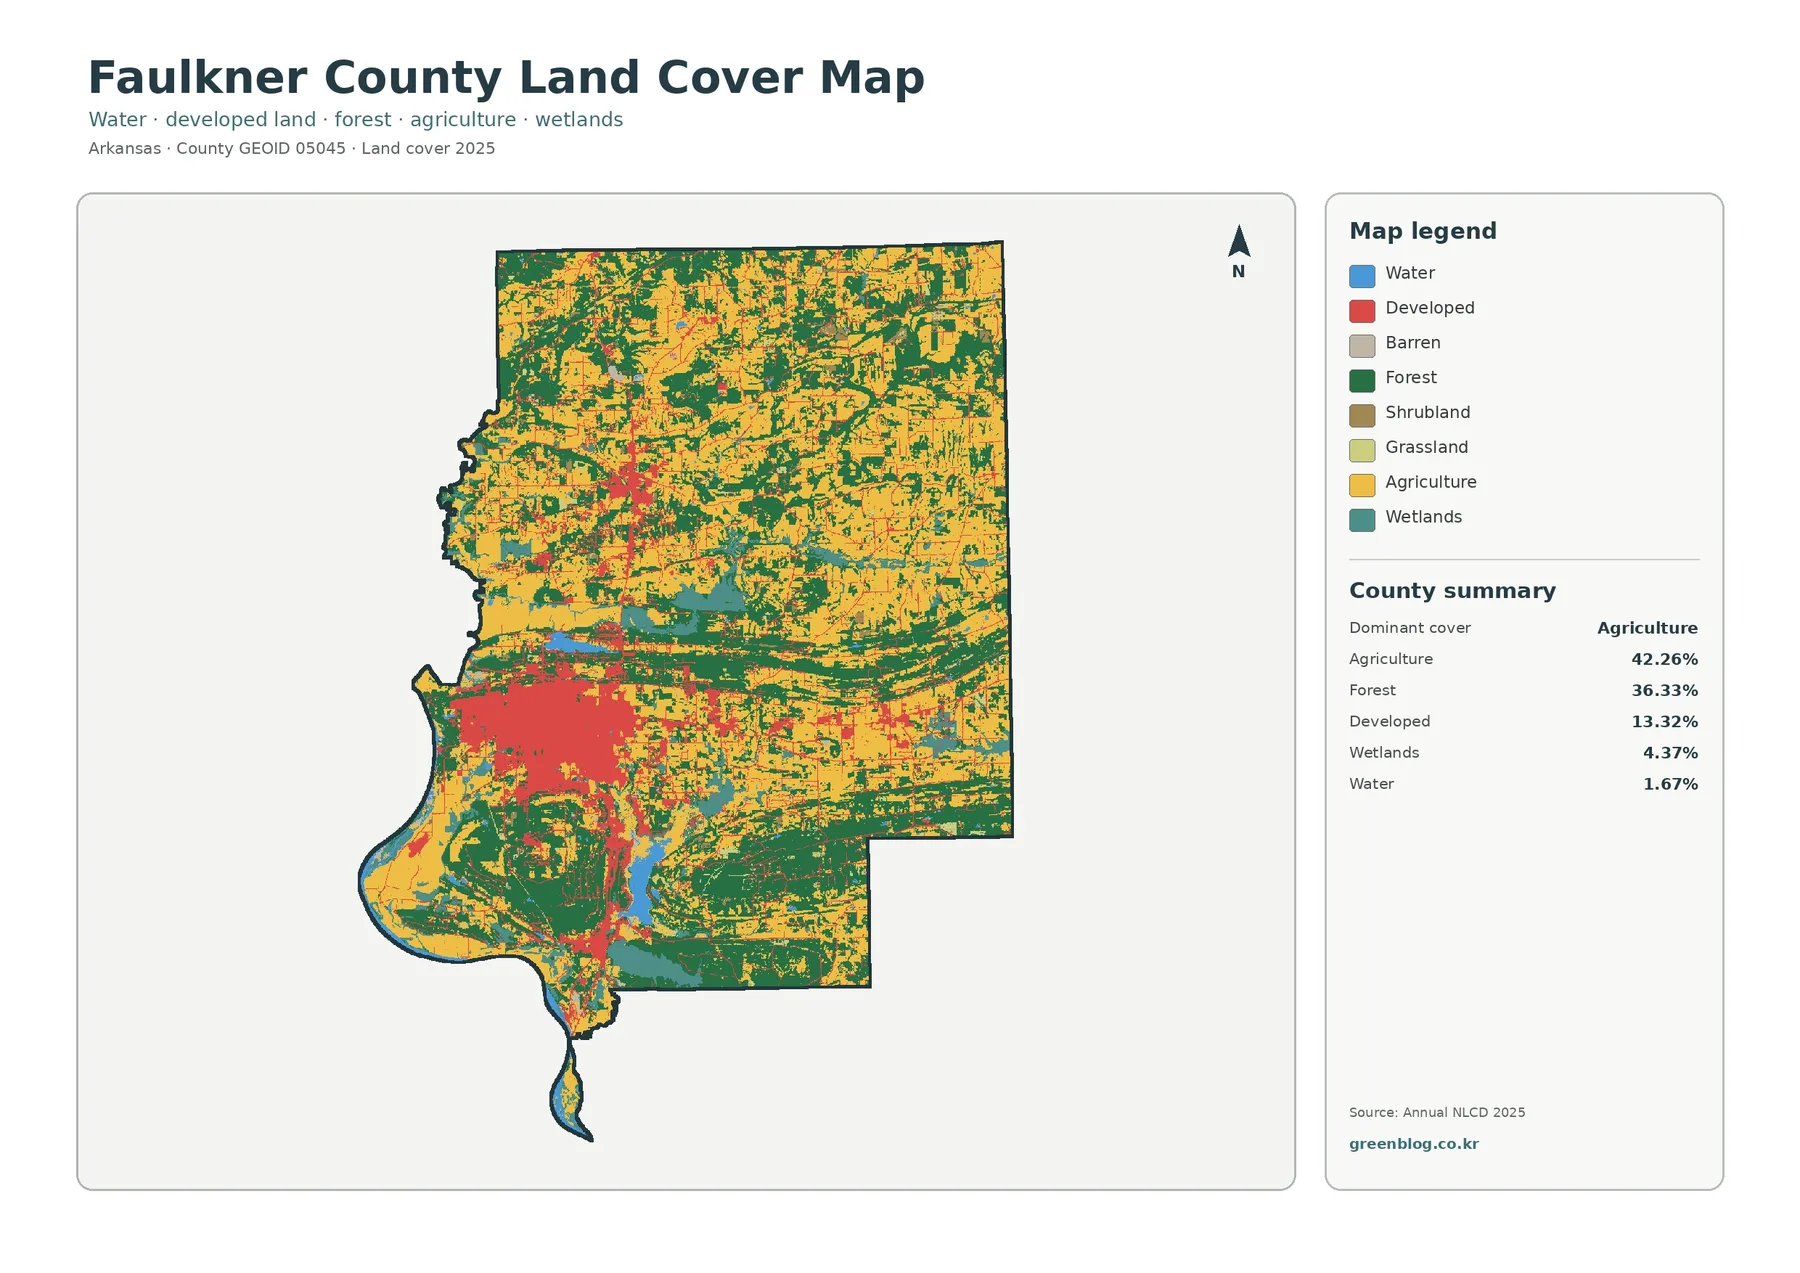
The Faulkner County Arkansas Land Cover Map set presents the county’s 2025 surface as agriculture, forest, developed land, wetlands, water, and smaller cover classes. Agriculture leads at 42.26%, followed closely by forest at 36.33%, but the two categories do not form an even checkerboard. A broad developed concentration stands out in the southwest, forest becomes more continuous through much of the south and center, and agricultural cover is especially common across the north and east.
Four views are provided for different questions: general land cover, forest and farmland, impervious surface with developed land, and a 1985–2025 class comparison. The four original 2480×1754-pixel JPG maps are also available together in one download, making the set practical for classroom reference, environmental interpretation, regional comparisons, and presentation graphics.
Table of Contents
A county split among farming, woodland, and a concentrated developed area
Agriculture is the largest 2025 class at 42.26%, while forest accounts for 36.33%. Developed land is substantial at 13.32%, with wetlands at 4.37% and water at 1.67%. Those figures show that no single natural or rural class completely defines Faulkner County. Farmland and woodland together occupy most of the county, yet developed cover is large enough to create a distinct third element rather than appearing only as scattered rural settlement.
The general map makes that distinction visible. Yellow agricultural areas are widespread across the northern and eastern portions and appear in many smaller blocks elsewhere. Dark green forest becomes more extensive through southern and central sections, including several long connected bands. Red developed cover forms its strongest concentration in the southwest and then breaks into smaller patches and narrow lines beyond that core.
The impervious layer isolates the southwestern hard-surface concentration
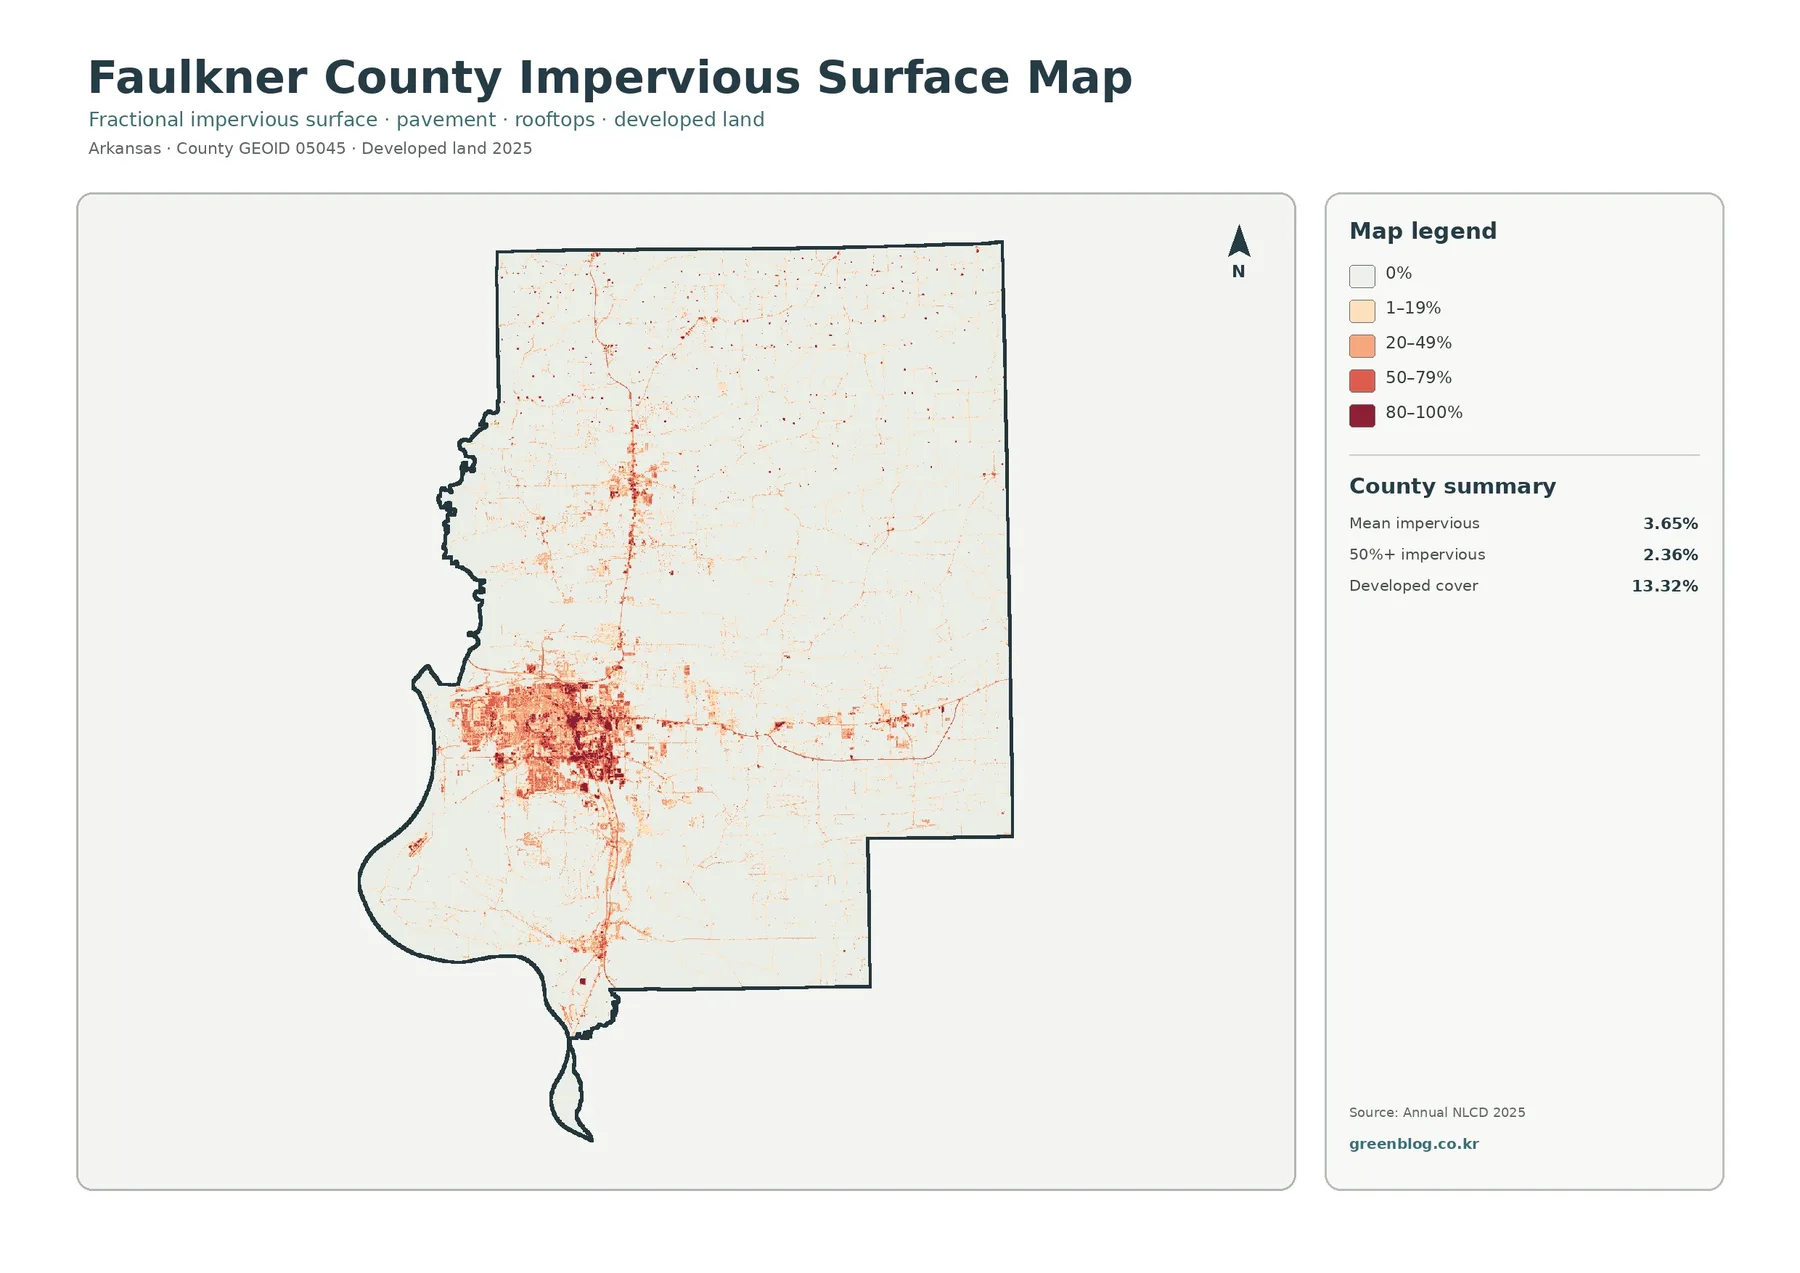
Impervious surface means pavement, rooftops, parking areas, and similar materials that do not readily absorb rainfall. Faulkner County has a mean impervious value of 3.65% in the supplied 2025 summary. Areas with at least 50% impervious cover account for 2.36% of the county. Both values are lower than the 13.32% developed-land share because a developed class can contain lawns, trees, bare soil, and other surfaces that still allow water to enter the ground.
The most prominent hard-surface cluster occupies the southwest. Darker reds and oranges form a dense block there, with thin corridors extending outward in several directions. Another narrow concentration runs southward near the middle of the county, while smaller nodes appear in the northwest and north-central area. Much of the east and northeast remains pale, producing a strong contrast between the principal developed core and the more rural parts of the county.
Forest and farmland become easier to compare after developed detail is reduced
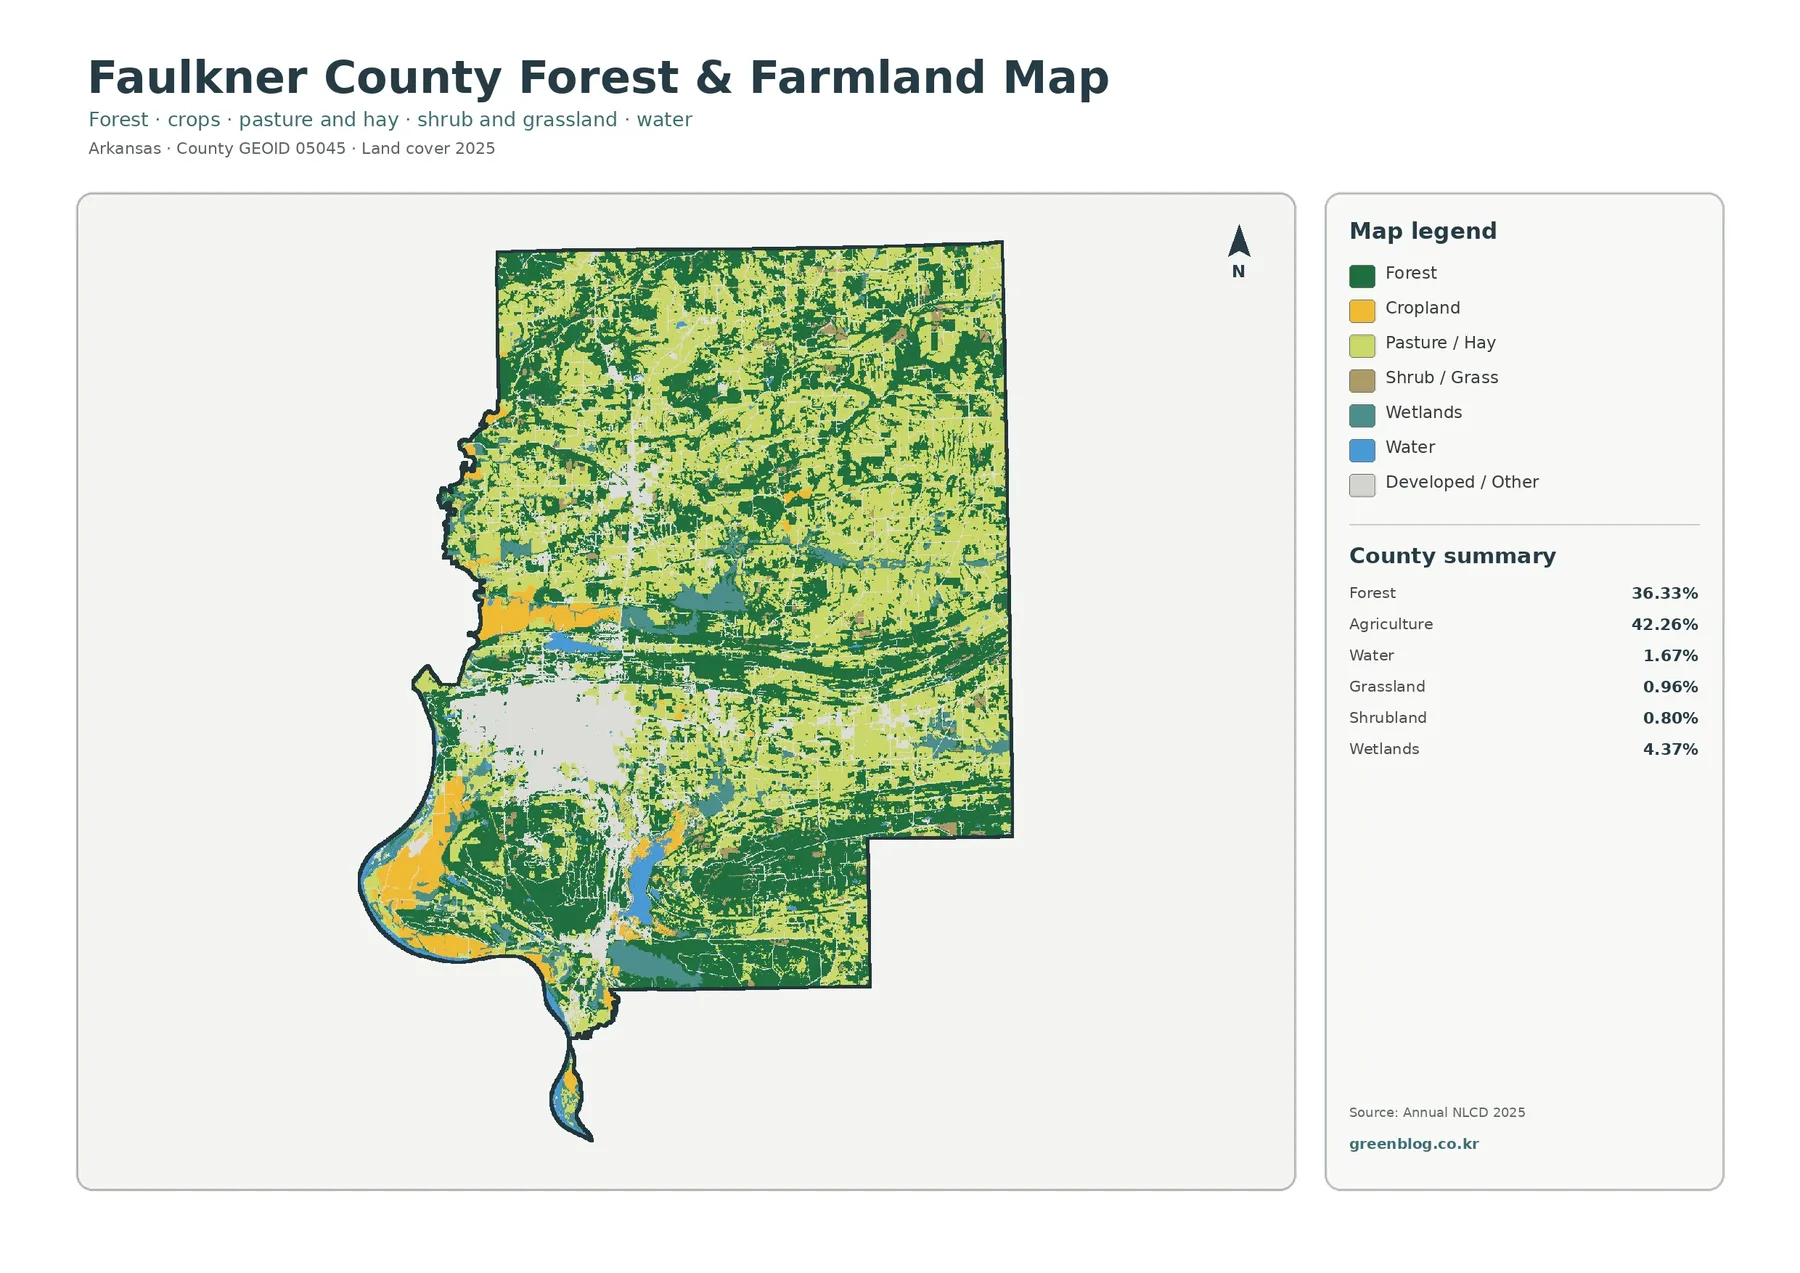
The forest-and-farmland view simplifies the county into the cover types most useful for rural and natural-landscape comparison. Forest remains 36.33% and agriculture 42.26%, while grassland is 0.96%, shrubland 0.80%, wetlands 4.37%, and water 1.67%. Removing much of the developed detail makes the agricultural blocks of the north and east easier to separate from the more wooded south and center.
Northern Faulkner County contains extensive agricultural cover, but woodland continues to appear between fields rather than disappearing completely. In the southern half, the relationship reverses: forest becomes broader and more connected, while agricultural and other open areas interrupt the wooded pattern. The boundary between those broad tendencies is irregular, so the map is better read as a gradual change in dominance than as a precise line dividing a farming half from a forest half.
The 1985–2025 comparison marks 19.30% of the county with a class difference
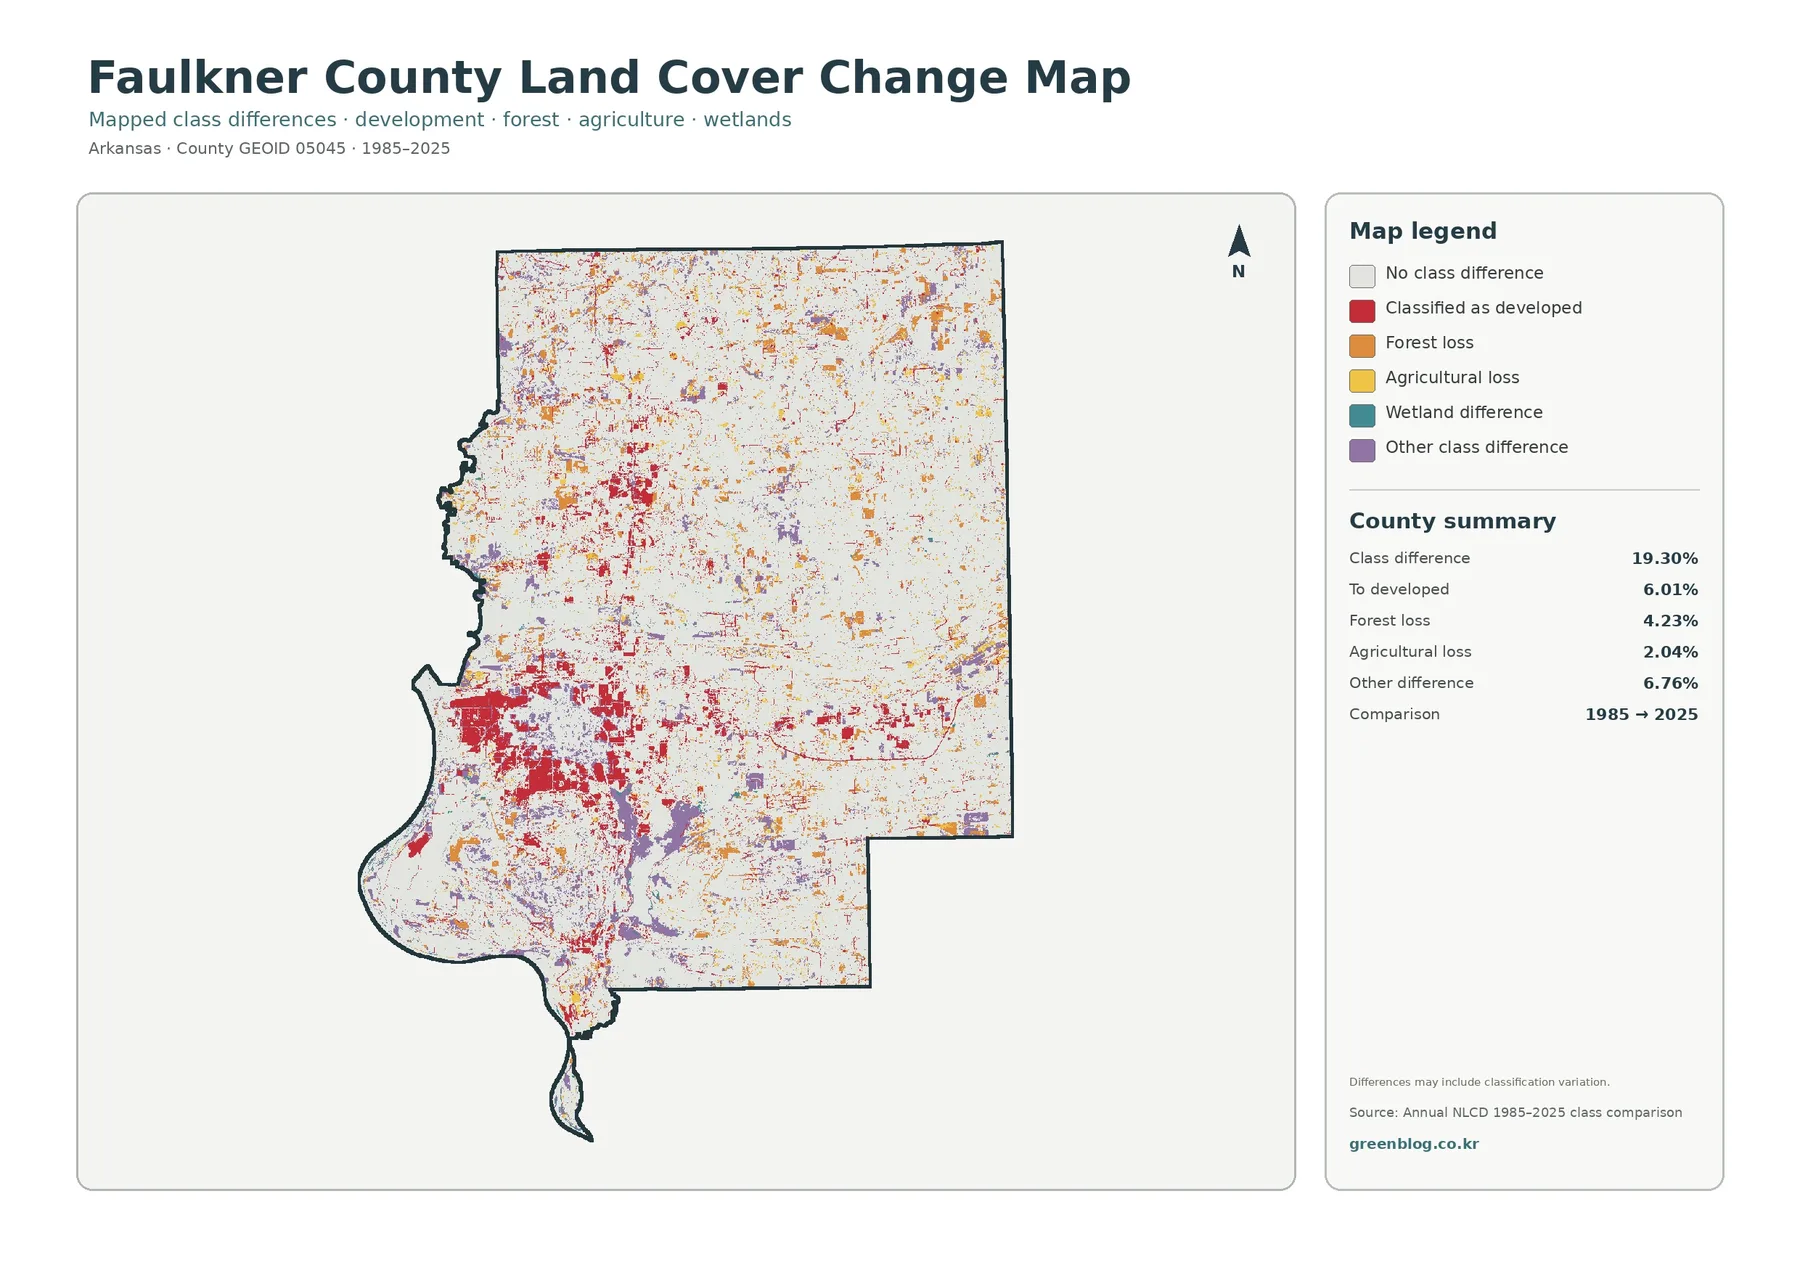
The change map compares the class assigned to each location in 1985 with the class assigned in 2025. The overall class-difference figure is 19.30%. Within that total, 6.01% is categorized as a change to developed land, 4.23% as forest loss, 2.04% as agricultural loss, and 6.76% as other class difference. The 19.30% value therefore cannot be used as a development rate.
Red change-to-developed marks are concentrated around the present southwestern developed area and also appear along thinner corridors elsewhere. Orange forest-loss patches are scattered widely, including numerous marks across northern and eastern sections. Yellow agricultural-loss marks appear in smaller pieces throughout the county. Purple other differences are noticeable in several central and southern areas as well as isolated northern patches.
A change color identifies a difference between two mapped classes, not the cause of that difference. A cell labeled forest loss could have shifted to development, agriculture, grass, or another class. Agricultural loss can also lead to more than one destination class. Determining the exact sequence requires intermediate-year products, source imagery, or other historical records rather than the two-date comparison alone.
The supplied map also warns that differences may include classification variation. Annual land-cover products use raster cells, which are small grid squares representing a dominant surface class. A 30-meter cell can contain trees, pavement, grass, and buildings at the same time. Near boundaries between cover types, a modest shift in the representative class can produce a mapped difference even when the real landscape changed only slightly.
Which map works best for a classroom, report, or presentation?
For a one-page county overview, the general land-cover image is the strongest starting point. It keeps agriculture, forest, development, wetlands, and water in one frame, allowing a reader to see both the 2025 proportions and the locations where those classes are concentrated.
When the subject is settlement, roads, or built surface, the impervious map provides more detail than the broad developed class. The southwestern hard-surface cluster and thinner outward traces can be compared with the pale rural background. For historical comparison, the 1985–2025 change layer works best after the current map has established the present pattern, because each change mark then has a clearer geographic context.
Scale, date, and classification limits matter
Annual NLCD-style land-cover products classify broad landscapes using raster cells rather than parcel polygons. That is useful for consistent regional comparison, but narrow roads, small ponds, isolated buildings, and complex property edges can be generalized. Mixed pixels are especially important along boundaries where farmland meets trees, developed land meets grass, or wetlands meet open water.
The current map set is labeled 2025. Construction, clearing, farming changes, or wetland and water changes after that observation period may not be represented. A project that depends on present conditions at a specific site should combine this countywide reference with recent aerial imagery, field observations, parcel information, and the appropriate local or state records.
Download the four Faulkner County land-cover JPGs
The download package contains the four original JPG maps used for this page: general land cover, forest and farmland, impervious surface with developed land, and the 1985–2025 land-cover comparison. Each supplied source image is 2480×1754 pixels. The originals are kept at that size instead of being artificially enlarged beyond the resolution provided in the package.
Frequently Asked Questions
What is the largest 2025 land-cover class in Faulkner County?
Agriculture is the largest at 42.26%, followed by forest at 36.33%, developed land at 13.32%, wetlands at 4.37%, and water at 1.67%. Agriculture is especially widespread in northern and eastern areas, while larger forest sections are more continuous through much of the south and center.
Why does developed cover equal 13.32% when mean impervious surface is 3.65%?
Developed classes can include buildings and pavement together with lawns, trees, soil, and other permeable surfaces. Impervious surface measures the harder portion that resists water infiltration. A broad developed area can therefore cover much more land than the subset occupied by rooftops, roads, and other highly impervious materials.
Does the 19.30% 1985–2025 difference mean that 19.30% of the county became developed?
No. The 19.30% value covers every location where the two selected years received different mapped classes. Only 6.01% is specifically categorized as a change to developed land. Forest loss, agricultural loss, other class differences, and possible classification variation are also included in the overall comparison.
Map File Information
The ZIP contains the four original Faulkner County land-cover JPG maps described on this page.
- File Type: four JPG images in one ZIP archive
Related Maps
- A Craighead County Arkansas Land Cover Map
- Arkansas County Arkansas Land Cover Map
- Ashley County Arkansas Land Cover Map
Sources and reference material
- MRLC Annual NLCD Data – official access to Annual NLCD land-cover products used for current and historical comparisons.
- USGS Annual NLCD Land Cover Classification – definitions for developed, forest, agriculture, wetlands, water, and other mapped classes.
- U.S. Census Bureau TIGER/Line Shapefiles – official geographic boundary files including county boundaries.
Green Map creates custom-edited map images using open geographic data sources such as geoBoundaries, Natural Earth, OpenStreetMap, and government open data.
These maps are edited visual materials, not raw data files, and are provided for education, documents, presentations, and graphic reference.