The Washington County Alabama Land Cover Map set shows a county where forest and wetlands dominate the 2025 surface pattern. Forest accounts for 43.84% of the mapped area and wetlands for 34.27%, while grassland, agriculture, and developed land occupy much smaller shares. The strongest visual contrast is between the broad wetland areas along the eastern and southeastern side of the county and the more continuous forest through much of the interior and west.
This page includes four views: general land cover, forest and farmland, impervious surface, and mapped class differences from 1985 to 2025. The original 2480 × 1754 JPG files for all four maps are available together in one download, making it easy to use the same county boundary for lessons, presentations, comparison work, or personal reference.
Table of Contents
A county pattern shaped by extensive forest and wetlands
Washington County lies in southwestern Alabama, with Mississippi on the west and the Tombigbee River along the eastern side. The Encyclopedia of Alabama identifies Chatom as the county seat and lists the Tombigbee and Escatawpa Rivers among the county’s major waterways. That geographic setting helps orient the land-cover images: the eastern half contains broad wetland areas, the interior retains large forest blocks, and smaller open or developed patches interrupt those dominant covers.
The 2025 summary reports 43.84% forest, 34.27% wetlands, 5.95% grassland, 5.27% agriculture, and 5.02% developed cover. Those percentages are easier to understand when read with the map. Forest forms long connected areas across the central and western portions of the county. Wetlands expand across much of the east and southeast, and they also reach inward through the forested interior. Agricultural areas appear as scattered yellow patches rather than a single continuous belt, while developed land is concentrated in a few settlement-sized clusters.
The 2025 land-cover map separates the wet east from the forested interior
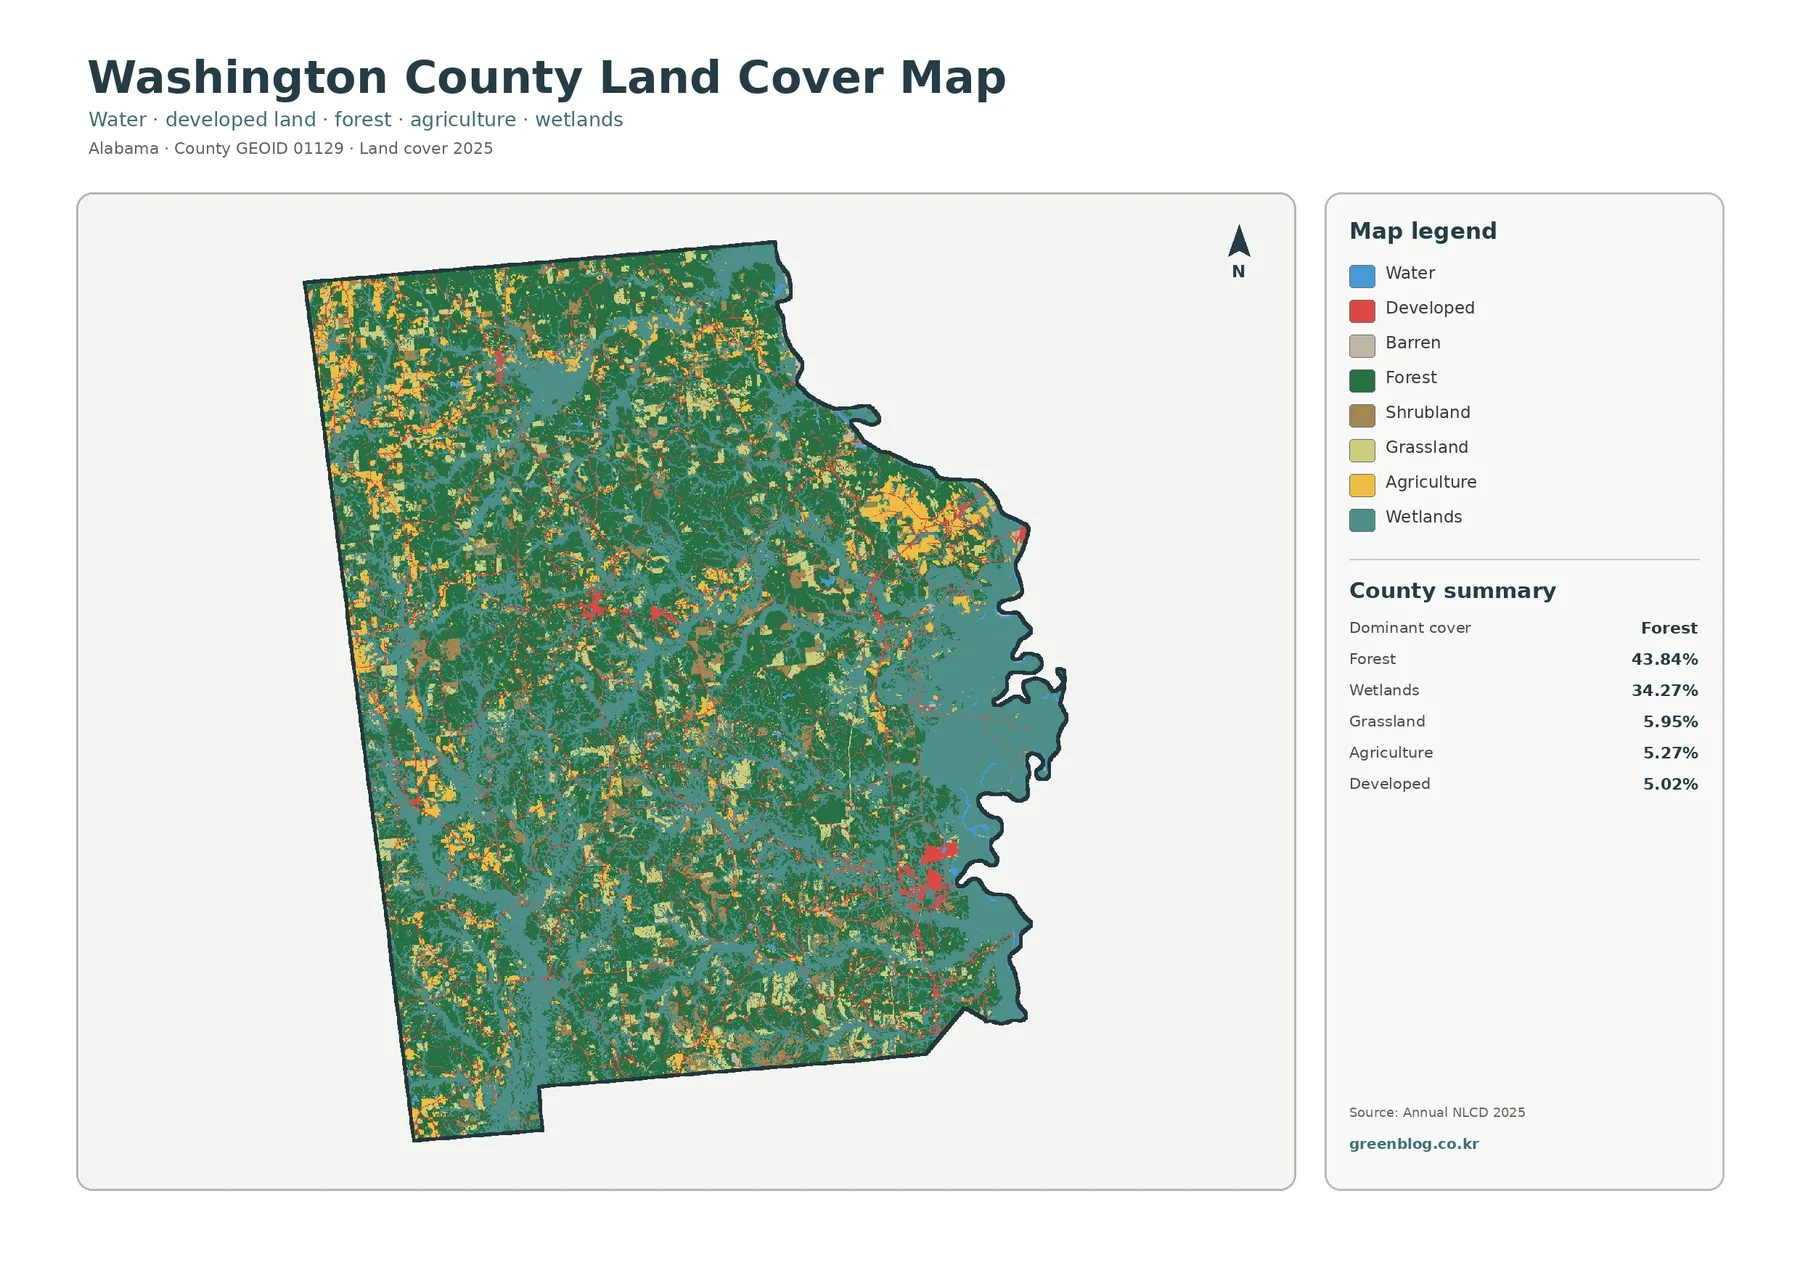
The general map is dominated by dark green forest and blue-green wetlands. Wetlands are especially broad along the eastern boundary and widen through the southeastern part of the county. They are not limited to a narrow strip beside open water; large wetland areas also extend westward into the county. Forest is more continuous through much of the center and west, creating a clear two-part pattern without forming a perfectly sharp boundary between the two covers.
Agriculture appears in yellow. It is most noticeable in several northeastern patches and in smaller areas scattered through the west and southwest. Grassland and shrubland add other open surfaces between forest blocks and agricultural cells. Developed land, shown in red, is limited compared with the county’s natural covers. One stronger concentration appears in the southeast, with smaller clusters in the interior and north. The 5.02% developed share therefore represents a dispersed network of settlements and corridors rather than a county-wide urban surface.
Forest and farmland appear as very different kinds of land-cover blocks
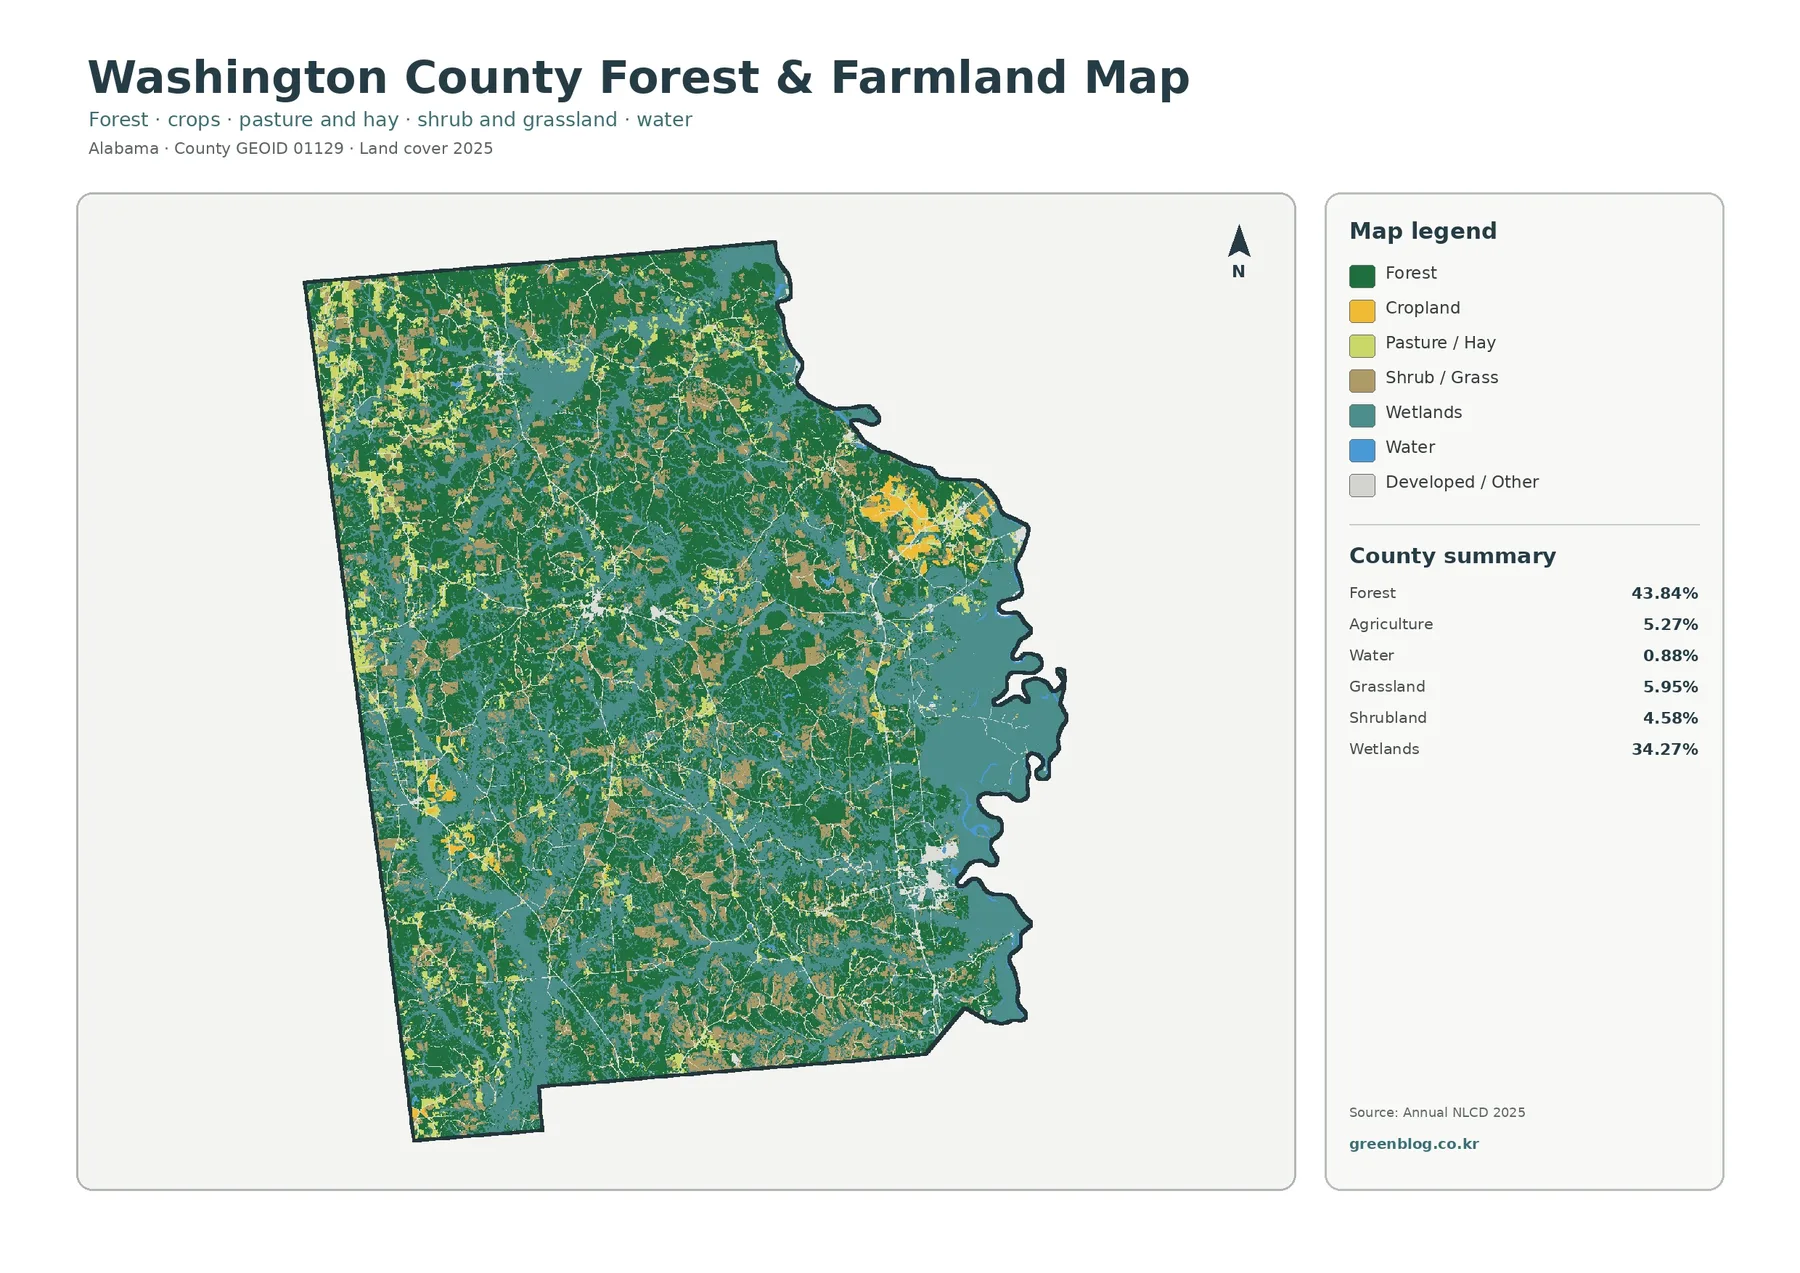
The forest-and-farmland version makes the distribution of open land easier to see. Forest remains the largest category and forms broad, connected areas across the western and central county. Agriculture is only 5.27%, but the brighter cropland and pasture colors stand out in the northeast and in many smaller western patches. The result is not a simple forest-versus-farm divide. Instead, farmland is broken into separate areas embedded within a landscape where forest and wetlands are much more extensive.
Washington County has a long connection with timber and forestry. The Encyclopedia of Alabama notes that timber remains a major local industry. That source-backed fact provides useful context for a map in which forest is the largest current cover, but the map itself does not show timber ownership, harvest schedules, plantation boundaries, or the cause of any individual forest pattern. The safest interpretation is to keep the two statements separate: forest is extensive in the 2025 classification, and forestry is important in the county’s economy.
Impervious surfaces are sparse, with the clearest cluster in the southeast
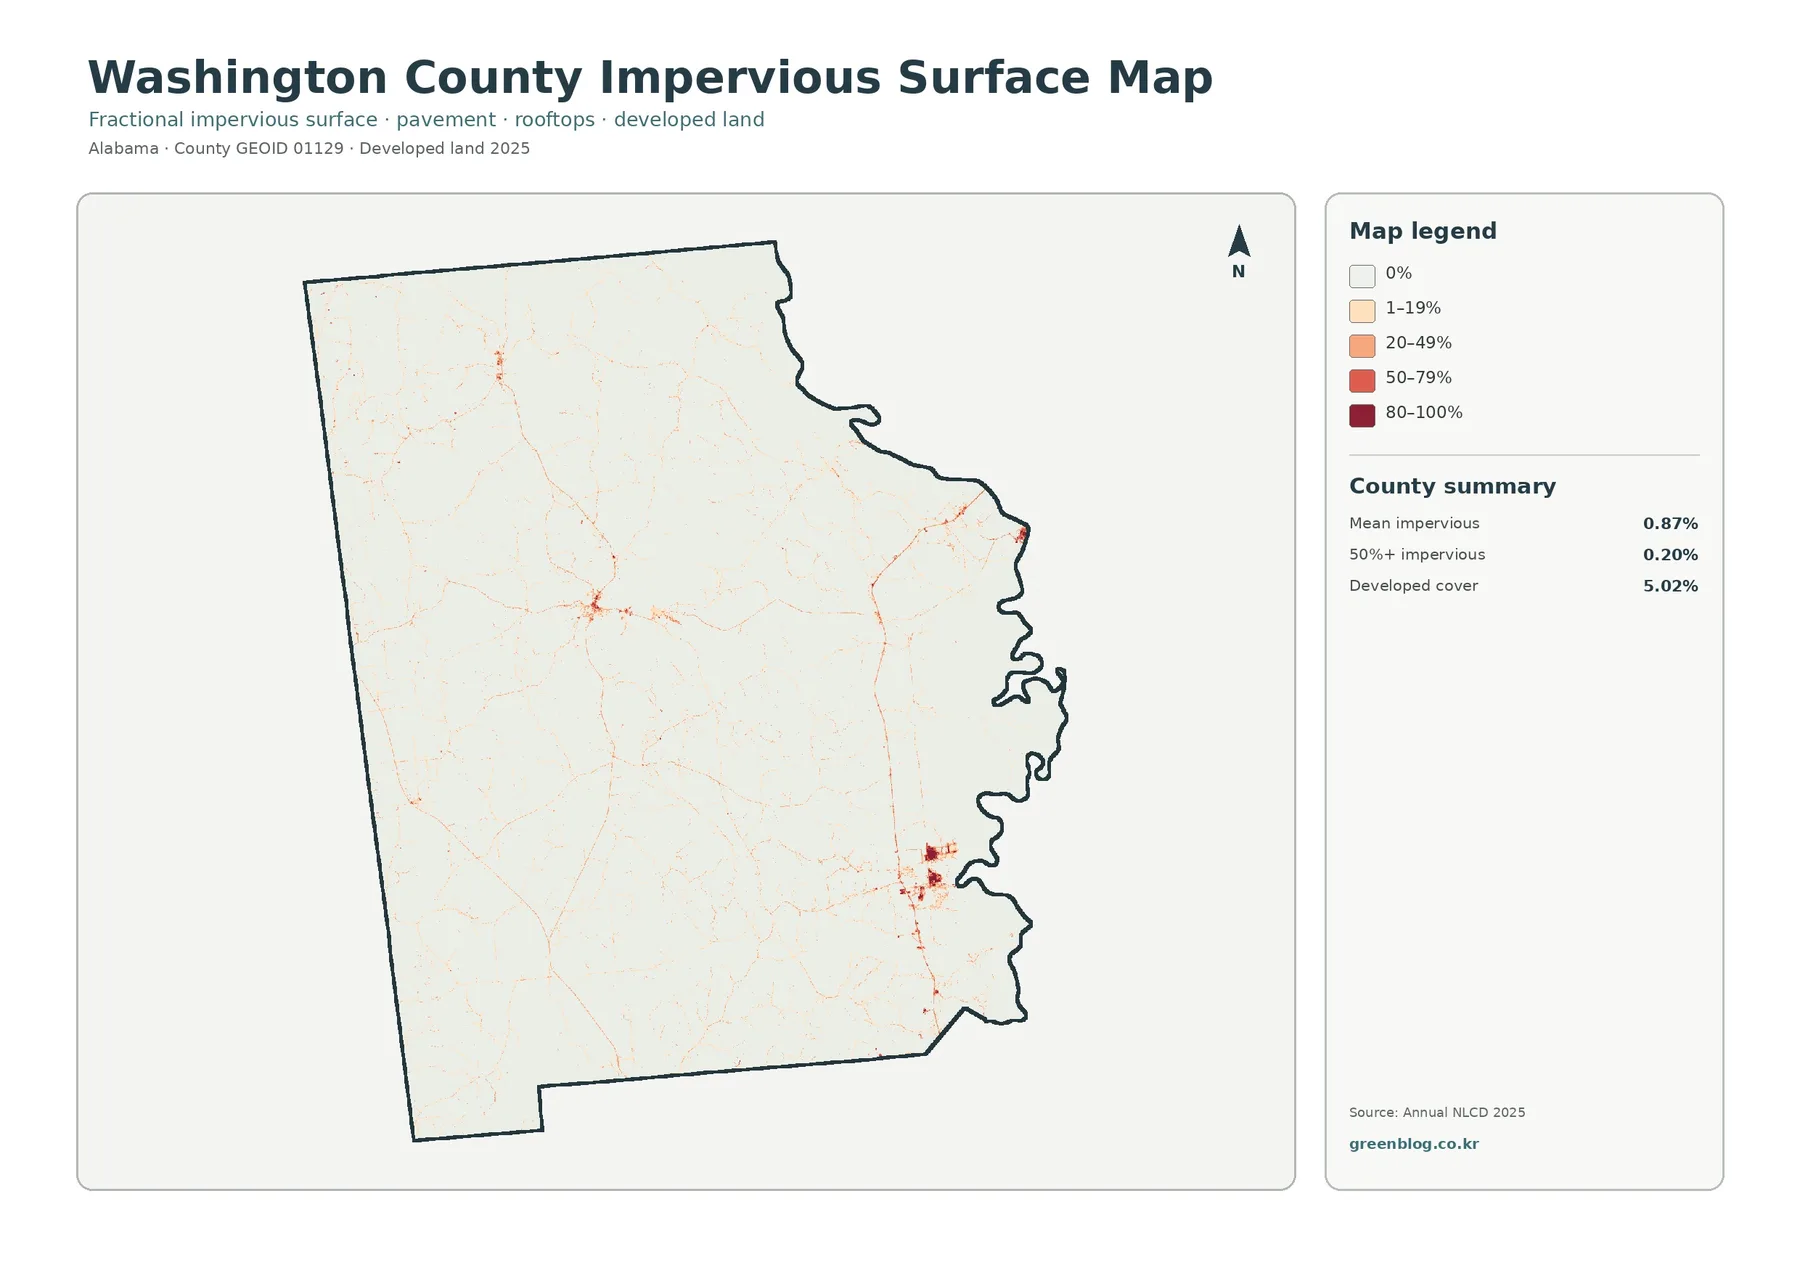
The impervious map is much lighter than the general land-cover map because most of Washington County has little mapped pavement or rooftop cover. Mean imperviousness is 0.87%, and only 0.20% of the county is mapped at 50% or greater impervious surface. Those values fit the visual impression of a largely forested and wetland county with small developed centers rather than a broad urbanized area.
The most visible high-impervious cluster sits in the southeastern portion of the county, with thinner linear traces extending away from it. Smaller clusters appear farther inland and toward the north. A trusted county reference places McIntosh in southeastern Washington County and notes that U.S. 43 runs north-south through the town, which provides a useful geographic reference for the southeast pattern. The map itself does not label towns or roads, however, so it would be too specific to assign every red cell to one facility, street, or industrial site.
The 1985–2025 map records 27.64% class difference, not 27.64% development
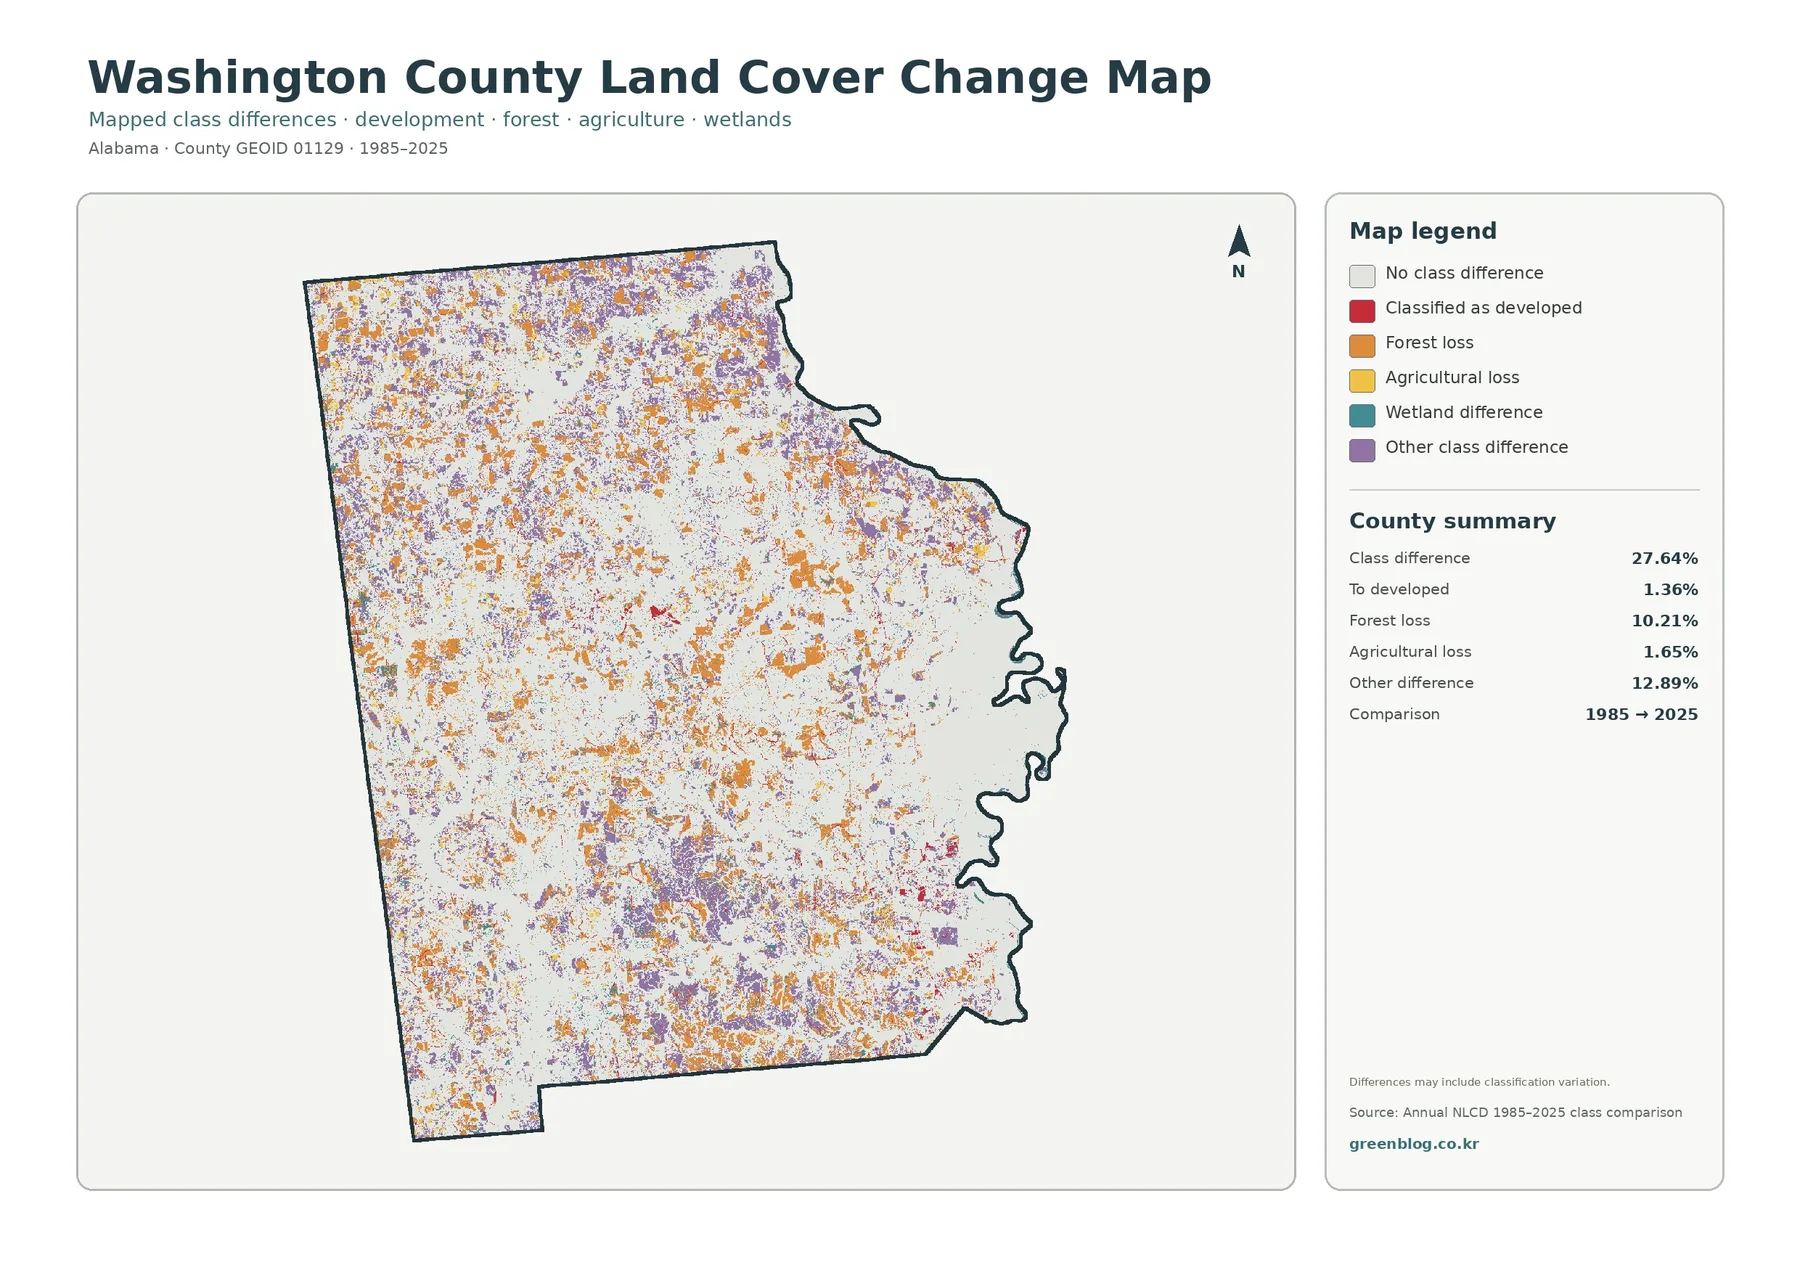
The largest number on the change summary is 27.64%, but it represents all mapped class differences between 1985 and 2025. It is not a development rate. The summary separately identifies 1.36% as cells classified to developed, 10.21% as forest loss, 1.65% as agricultural loss, and 12.89% as other difference. Wetland difference is also shown as its own map color even though the preview summary does not provide a separate percentage for it.
Forest-loss orange and other-difference purple are scattered across the county rather than confined to one corner. They appear in the north, west, center, and south, indicating that the class comparison is spatially widespread. Red development-transition cells are less common and are easier to notice near the southeastern cluster and around a few smaller settlement areas. This broad distribution is one reason the overall class-difference percentage is much larger than the to-developed percentage.
A practical order for comparing all four Washington County maps
A useful way to read the set is to begin with the general 2025 land-cover map. It establishes the big pattern: forest and wetlands dominate, agriculture and grassland are secondary, and developed land is limited. Next, the forest-and-farmland map makes the boundary between forest, agriculture, pasture or grass, shrubland, wetlands, and water easier to separate. The impervious map then answers a more specific question about where hard surfaces such as pavement and rooftops are concentrated. Finally, the change map adds the time comparison without replacing the current-condition maps.
Downloading and using the four original JPG maps
The WebP images in the article are viewing previews. The download contains the four original JPG maps, each measuring 2480 × 1754 pixels. The supplied asset manifest specifically marks these files as original resolution but not as meeting the package’s A3 high-resolution reference. They work well for screen reference, classroom handouts, slides, and moderate-size printing, but a large poster should be tested at the intended physical size before production.
What the percentages and colors can—and cannot—tell you
County percentages summarize generalized raster cells. Very small roads, narrow streams, individual buildings, field edges, or mixed patches may not be represented at their exact real-world dimensions. Wetlands and open water must also be kept separate: wetlands cover 34.27%, while open water is only 0.88%. Combining them would erase one of the most distinctive features of the Washington County pattern.
These maps are not parcel surveys, wetland-jurisdiction maps, flood maps, zoning maps, or construction documents. They should not be used to decide whether a property can be developed, whether a site is regulated as a wetland, or where a legal boundary lies. Their strength is county-scale comparison: they show where broad covers cluster, where impervious surfaces are concentrated, and where the long-term class comparison flags areas for closer study.
Frequently Asked Questions
What is the dominant land cover in Washington County?
Forest is the largest 2025 class at 43.84%, followed by wetlands at 34.27%. Together they account for most of the mapped county and create the strongest visual contrast between the forested interior and the broad wetland areas in the east and southeast.
Does 5.02% developed cover mean 5.02% of the county is impervious?
No. Developed cover is a land-cover class, while mean imperviousness is 0.87%. Developed cells can contain lawns, trees, soil, and other permeable surfaces mixed with buildings and pavement, so the two values measure different things.
Does the 27.64% class difference represent confirmed physical change everywhere?
Not necessarily. The change map separates development, forest loss, agricultural loss, wetland difference, and other difference, and it warns that classification variation may contribute to the comparison. Use it as a screening view, then check additional dated imagery or local records for a specific site.
Map File Information
Washington County Land Cover Map Files
- Included Files: Use only the versions confirmed in the article and supplied images
- File Type: Use the confirmed download contents
- Intended Use: Printing, education, presentations, and map-based projects
Related Maps
- Autauga County Alabama Land Cover Map
- Baldwin County Alabama Land Cover Map
- Barbour County Alabama Land Cover Map
Sources
- MRLC Annual NLCD Data — source portal for Annual NLCD land cover and related products
- USGS Annual NLCD Land Cover Classification — definitions for mapped land-cover classes
- U.S. Census Bureau TIGER/Line Shapefiles — county boundary reference
- Encyclopedia of Alabama: Washington County — county geography, waterways, Chatom, and local background
Green Map creates custom-edited map images using open geographic data sources such as geoBoundaries, Natural Earth, OpenStreetMap, and government open data.
These maps are edited visual materials, not raw data files, and are provided for education, documents, presentations, and graphic reference.