Dougherty County has an unusually balanced land-cover mix for a county anchored by a sizable city. Forest is the largest 2025 class at 27.73%, yet wetlands account for 23.36%, agriculture for 23.28%, and developed land for 20.65%. This Dougherty County Georgia Land Cover Map set makes that contrast easy to see: Albany forms a broad built concentration while wooded, wet, and agricultural surfaces become much more prominent outside the urban core.
Four views are included on the page: current land cover, forest and farmland, impervious surface and developed land, and a 1985–2025 class comparison. The original 2480 × 1754-pixel JPGs are available together in one download, so readers can use the map set for county profiles, classroom work, presentations, or broad environmental comparisons without saving each preview separately.
Table of Contents
A county where four major cover types are all substantial
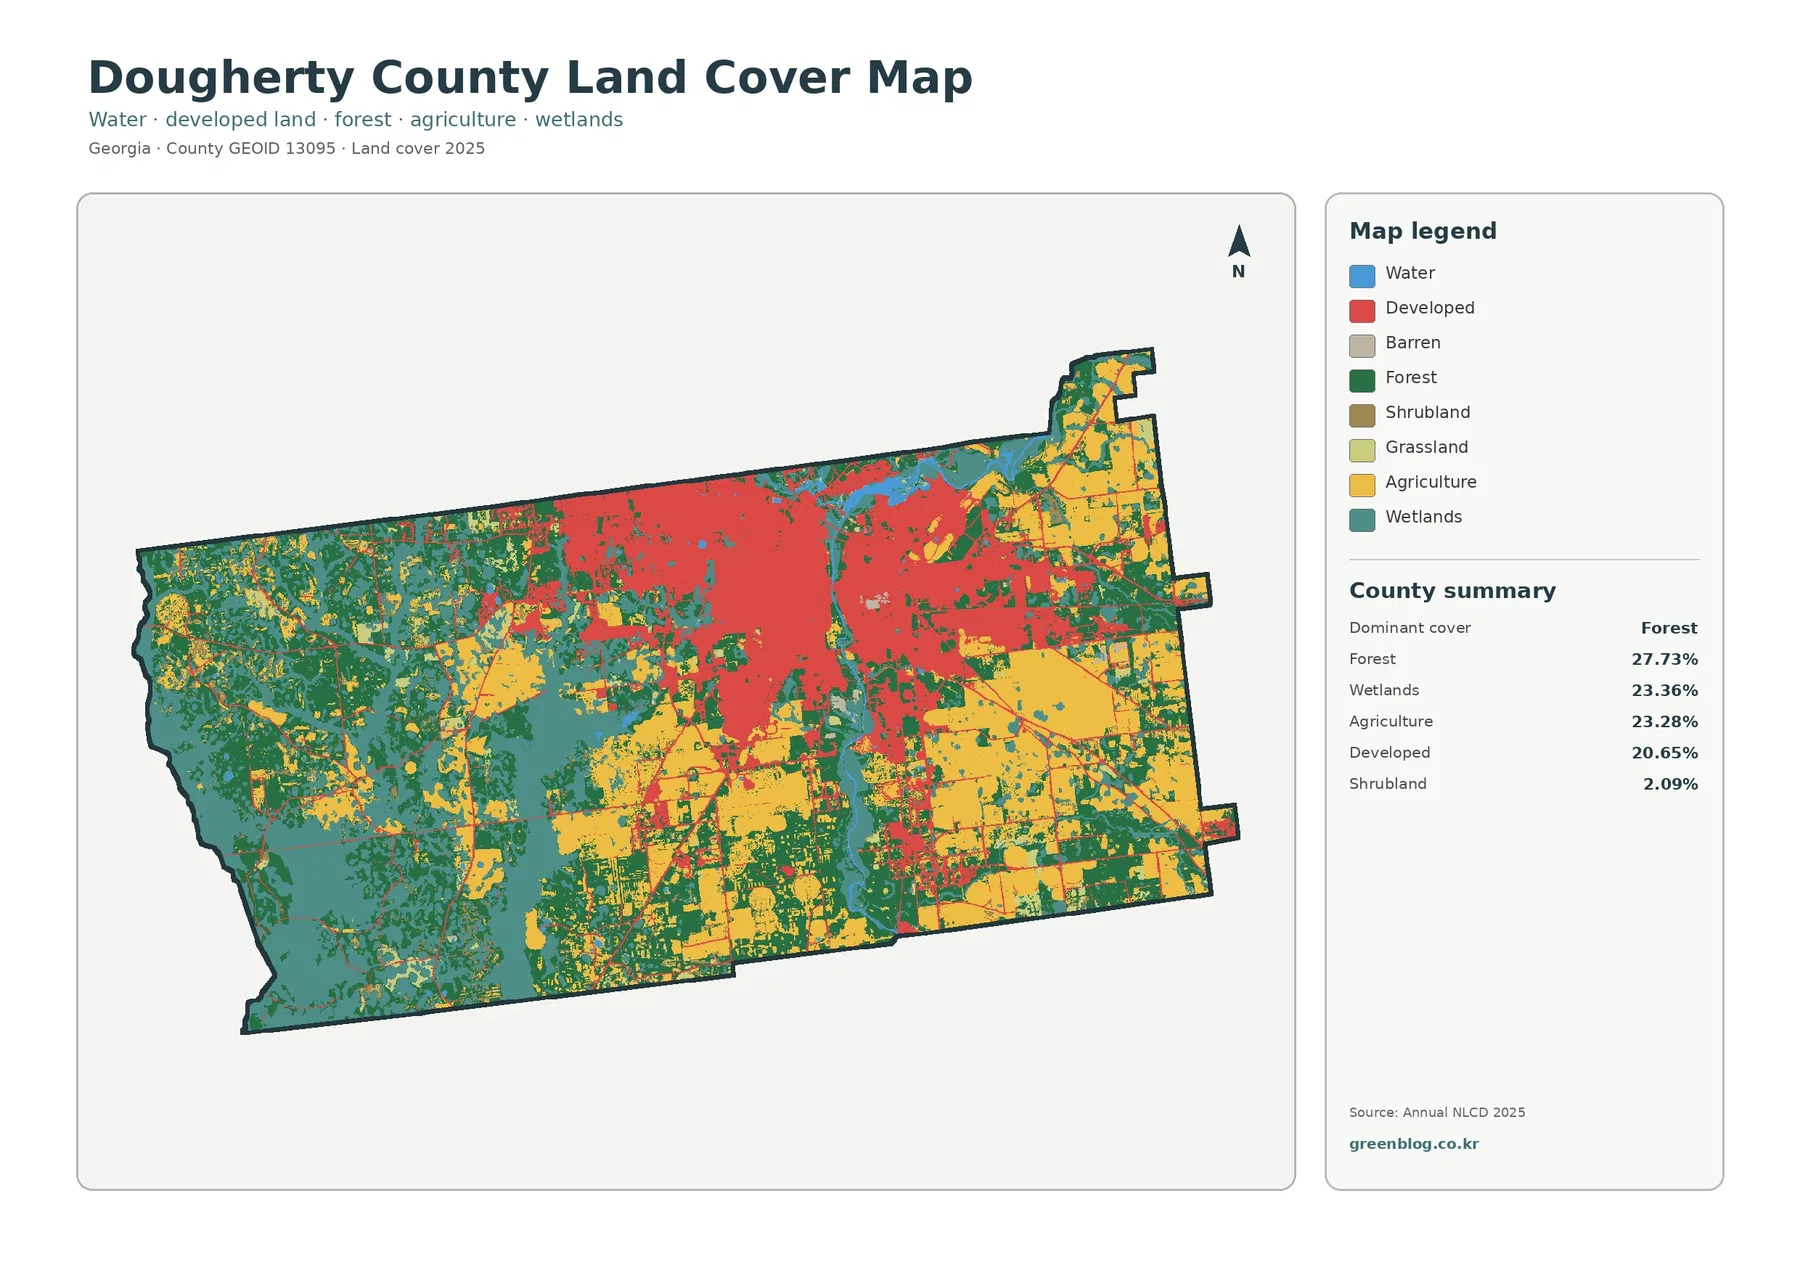
The county summary does not describe a landscape dominated by a single class. Forest leads at 27.73%, but the gap between forest, wetlands, and agriculture is only a few percentage points. Developed land also occupies more than one-fifth of the county. That balance matters because a quick glance at Albany can make the county seem more urban than it is, while a quick glance at the western side can make it seem more heavily forested and wet than the countywide totals support.
The largest red developed area stretches across the north-central and east-central part of the map, matching the broad location of Albany. Outside that concentration, the county changes rapidly. Forest and wetlands become more common toward the west and southwest, while large agricultural blocks stand out across the east and southeast. Southern areas contain a finer mix of fields, woods, wetlands, and scattered development rather than one continuous cover type.
Water itself represents only 0.89% on the forest-and-farmland summary, so the blue class is limited. Wetlands tell a different story. At 23.36%, they occupy a large share of the county and form broad teal areas on the western and southwestern side. Dougherty County’s own county overview highlights the Flint River and cypress swamps as local natural and recreational features. The map is useful for that broad context, but it does not label individual wetland boundaries or establish legal wetland status.
Small classes still add useful detail. Shrubland accounts for 2.09%, while grassland is 1.84% in the forest-and-farmland view. These categories appear as scattered pieces rather than county-defining zones. They are most useful when a reader wants to understand why a field edge, open tract, or transitional area does not match the larger forest, agriculture, wetland, or developed classes around it.
Forest, fields, and wet ground become clearer when Albany is muted
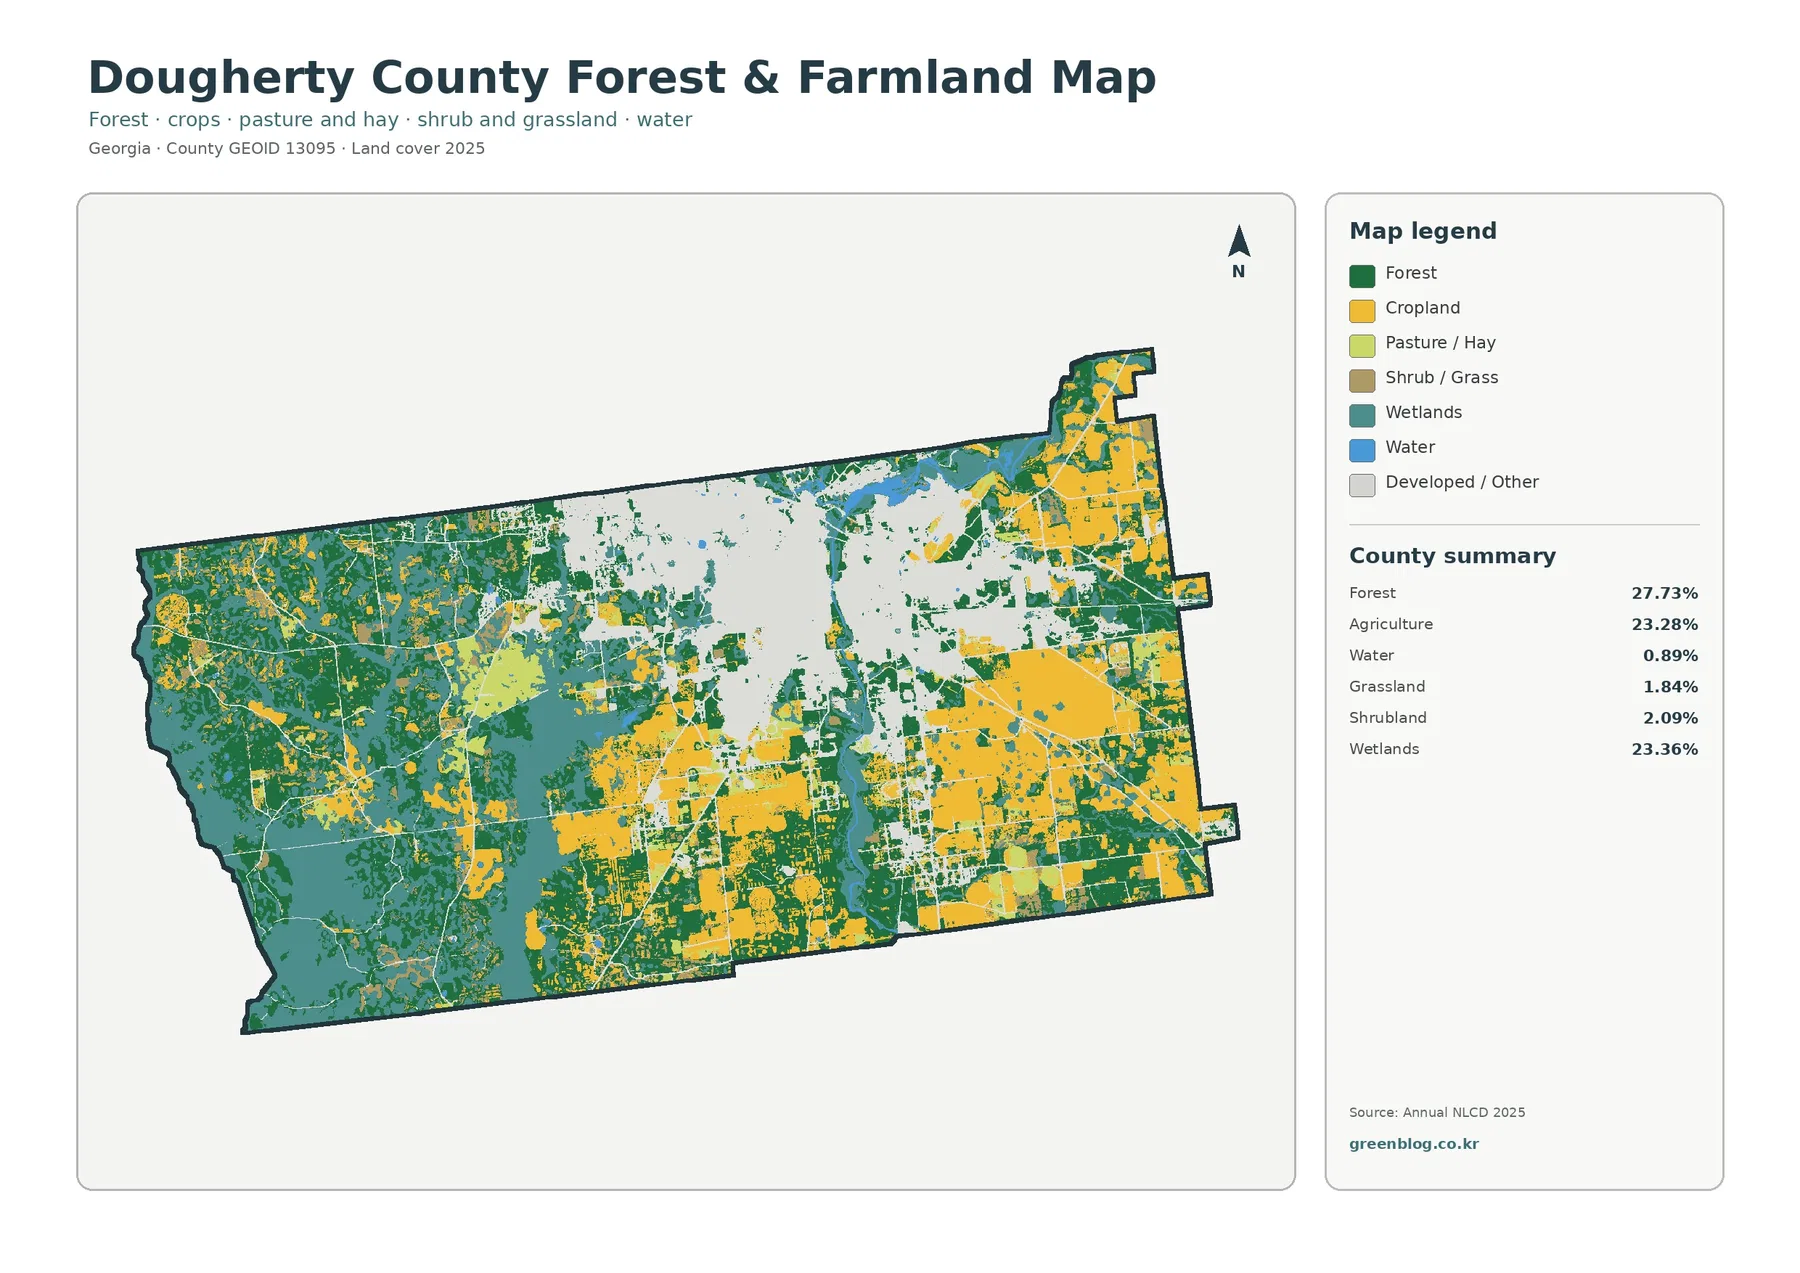
Removing most of the visual weight of developed land changes the way the county reads. The western half becomes a mosaic of dark green forest and teal wetlands, with especially broad wet areas toward the southwest. Farmland is more prominent on the eastern side, where yellow blocks are larger and more continuous. Agricultural patches also appear in the south-central and northeastern portions, so farming is not confined to one corner of Dougherty County.
The near tie between agriculture at 23.28% and wetlands at 23.36% is important for anyone making a county profile. One percentage alone can hide how differently those classes are arranged. Agricultural land often appears in large, simple blocks, while wetlands tend to follow more irregular shapes and mingle with forest. That difference in form is easier to see on this focused view than on the full land-cover map, where Albany’s developed classes draw much of the eye.
Local context supports the importance of both farming and natural resources. UGA Extension in Dougherty County maintains agriculture and natural-resources programs that include row crops, pecans, livestock and pastures, as well as homeowner and landscape topics. That source does not turn the map into a crop inventory, but it helps explain why a separate forest-and-farmland view is useful for this county.
This map is also a good reminder that land cover and land use are not the same thing. A cell classified as agriculture does not tell you which crop is present or whether the parcel is actively farmed on a particular day. A forest cell does not identify ownership, management status, or timber plans. Wetland color does not replace a jurisdictional wetland determination. The image describes the surface classification at the mapped scale, not property rights or regulatory status.
The 1985–2025 comparison is broader than urban growth alone
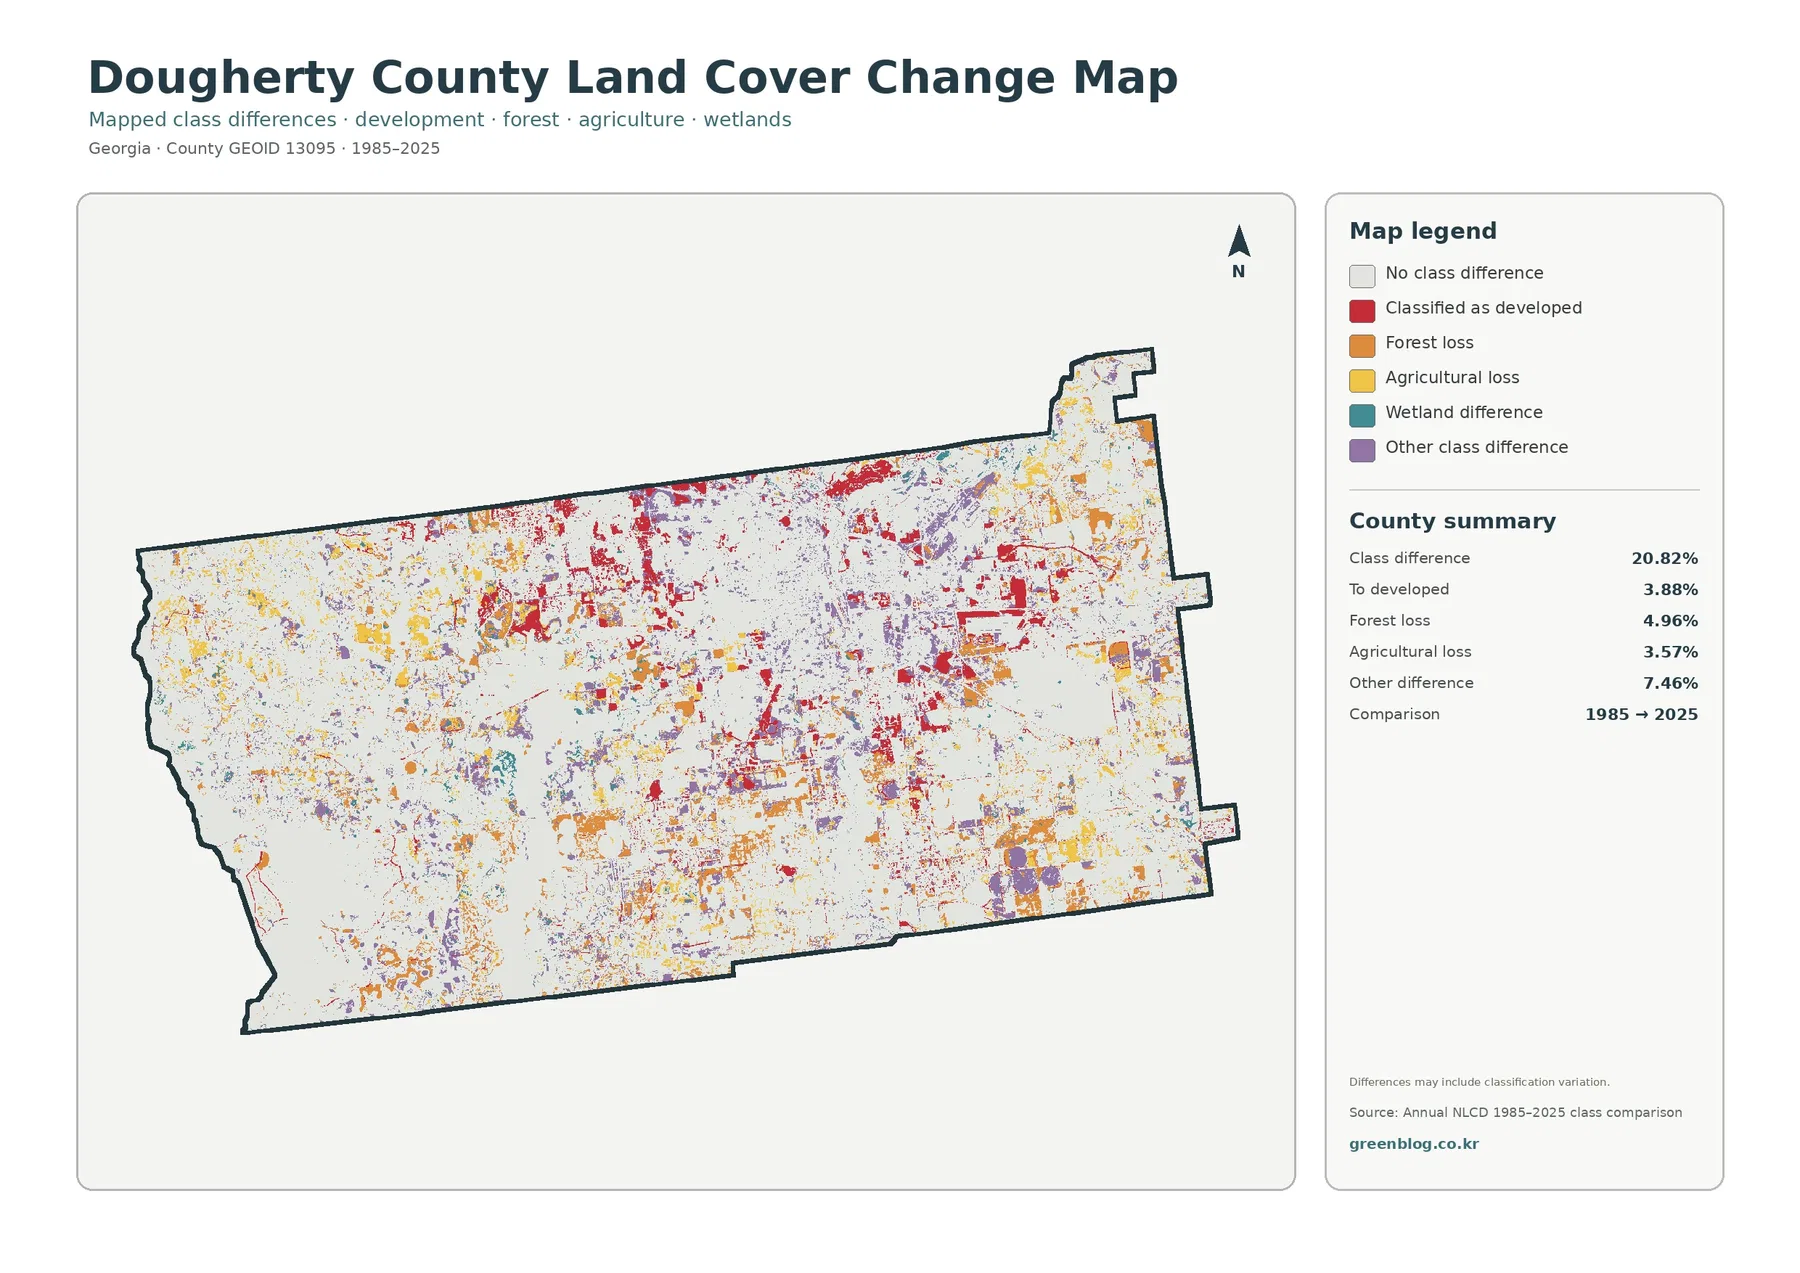
About 20.82% of the county is marked as having a different class at the two endpoints. The summary separates 3.88% classified as developed, 4.96% forest loss, 3.57% agricultural loss, and 7.46% other class difference. The pattern is scattered across the county. Red developed-change cells are more noticeable around the Albany area, but orange, yellow, purple, and occasional wetland-difference cells also appear well beyond the city.
Those numbers should not be treated as a continuous forty-year timeline. The graphic compares 1985 with 2025; it does not identify the year in which a cell changed. A place may have gone through several conditions between those endpoints. The map itself also notes that differences can include classification variation, which means some cells may change category because of imagery or classification conditions rather than a straightforward physical conversion on the ground.
That is why the change layer works best as a screening tool. A reader can identify areas that deserve a closer look and then use dated aerial photography, intermediate land-cover products, or planning records to investigate them. The City of Albany’s Plans & Special Studies page includes the Albany-Dougherty County Comprehensive Plan 2026–2046, which covers current planning topics such as land use, transportation, housing, facilities, and growth. Those documents answer different questions from an endpoint land-cover comparison.
For a presentation, the safest wording is to say that 20.82% of mapped cells received a different class in 2025 than in 1985. It is more precise than saying that one-fifth of the county was “developed” or “lost.” Development accounts for only one part of the difference, and the map separates forest loss, agricultural loss, and other class differences for exactly that reason.
Hard surfaces reveal the Albany footprint more precisely
Developed land covers 20.65% of Dougherty County, but developed land is not the same as pavement and rooftops. Residential lots can contain trees, lawns, gardens, bare soil, and other surfaces that absorb water. The impervious layer isolates the harder surfaces more directly. In plain terms, impervious surface means roofs, streets, parking lots, and similar materials that make it difficult for rainfall to soak into the ground.
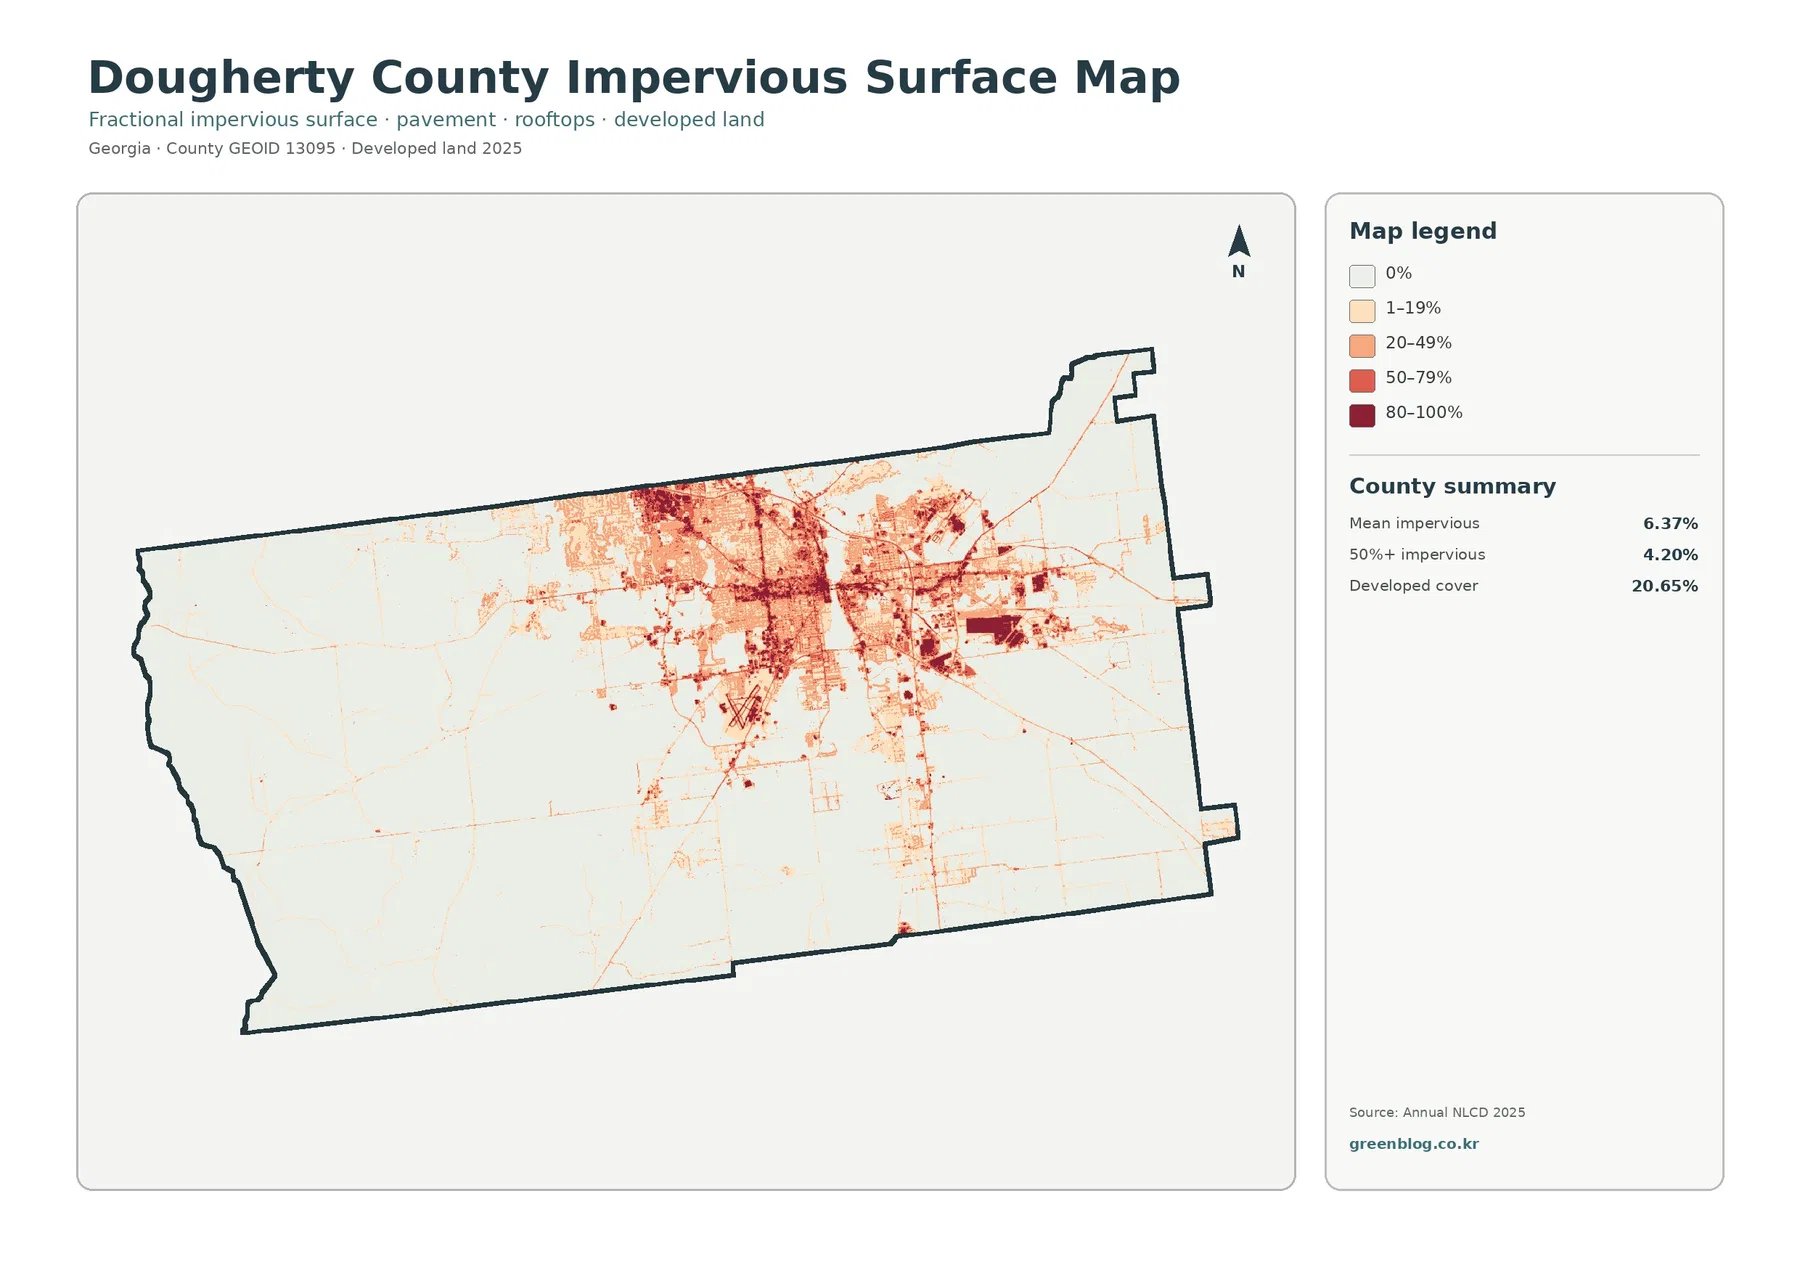
Mean impervious cover is 6.37%, and 4.20% of the county falls in cells that are at least 50% impervious. Darker reds are concentrated in the broad Albany footprint and in a few smaller high-intensity patches. Thin developed lines extend outward from the main cluster, while much of the county outside that area stays pale or nearly white. The contrast makes the city’s hard-surface footprint much more obvious than it is in the general land-cover view.
The difference between 20.65% developed cover and 6.37% mean impervious cover is not a contradiction. They measure different things. Developed classes describe a broader land-cover setting, while the impervious percentage estimates the portion of a cell occupied by hard surfaces. This distinction is useful when comparing urban form, discussing runoff in a classroom, or deciding which map belongs in a report about roads and buildings rather than general land cover.
Even so, the impervious layer is not a parcel or engineering map. Narrow roads, small roofs, drainage features, and property boundaries may be generalized at the 30-meter cell scale. For current zoning, site-plan, subdivision, and floodplain rules, the Albany Planning & Zoning page is the appropriate official starting point for both the city and unincorporated Dougherty County.
Choosing the right map for a report, lesson, or county profile
The four views are most effective when they are not used as four versions of the same illustration. A county overview should begin with the current land-cover map because it establishes the balance among forest, wetlands, agriculture, and development. A natural-resources discussion benefits from the forest-and-farmland view because it removes much of the visual competition from Albany. A development-focused page needs the impervious layer, and a historical comparison should add the 1985–2025 change map with a clear explanation of its endpoint limitation.
For watershed or wetland education, compare the 23.36% wetland share with the 0.89% open-water share. That pairing helps students see why water-related landscapes can cover far more ground than visible lakes and channels. For urban studies, compare 20.65% developed land with 6.37% mean impervious cover. For agriculture, use the forest-and-farmland layer to show how large eastern fields meet wooded and wet areas rather than presenting the county as a uniform farming district.
The JPG files are 2480 × 1754 pixels each. They work well for screens, handouts, and many standard presentation layouts. The package does not identify them as meeting a high-resolution A3 printing standard, so a large poster should be test-printed before final production. Keeping the legend visible is especially important because developed land, impervious cover, wetlands, and water answer different questions even when they appear near one another.
Scale, classification, and what the maps cannot decide
Annual NLCD products use 30-meter raster cells. A raster cell is simply a square area in a grid. One square may contain trees, pavement, grass, a ditch, and a small building, yet the land-cover product still has to represent that area in a simplified way. Mixed pixels are therefore normal, especially along field edges, residential neighborhoods, wetland margins, and narrow roads.
Zooming the JPG does not create parcel-level detail that was absent from the source. If a decision depends on an individual property, a current aerial image, survey, parcel record, or field inspection is more appropriate. The same caution applies to the 2025 date: construction, harvest, vegetation recovery, storms, or standing-water conditions after the observation period may not appear in this map set.
For source definitions and boundary checks, readers can consult MRLC Annual NLCD Data, the USGS Annual NLCD Land Cover Classification documentation, and U.S. Census Bureau TIGER/Line Shapefiles. These sources explain the data and official geography more directly than the downloadable graphics can.
Most importantly, land cover should not be read as zoning, ownership, development permission, flood insurance status, or a wetland-jurisdiction decision. The maps are county-scale reference graphics. Their strength is comparison: where built surfaces cluster, where forest is broad, where fields are prominent, where wet areas are common, and where the two endpoint classifications differ.
What is included in the JPG download
The download contains one original JPG for 2025 land cover, one forest-and-farmland map, one impervious-surface and developed-land map, and one 1985–2025 land-cover-change map. Use the overview for general context, then add the specialized image that matches the question. This keeps a report or lesson focused while still giving access to all four views when a deeper comparison is needed.
Frequently Asked Questions
Is Dougherty County mostly urban because Albany is so prominent on the map?
No. Developed land is 20.65%, while forest, wetlands, and agriculture each occupy larger countywide shares. Albany creates the strongest single developed concentration, but the outer county contains extensive wooded, wet, and agricultural areas.
Why are wetlands 23.36% when open water is only 0.89%?
Open water and wetlands are different land-cover classes. Water represents exposed water surfaces, while wetlands can include vegetated or saturated ground affected by water. A county can therefore have a large wetland share without a similarly large open-water share.
Does the 20.82% class difference mean that one-fifth of the county was physically transformed?
Not necessarily. It is the share of cells that received a different class in 2025 than in 1985. Real land-cover change can contribute, but classification variation may also be included. Intermediate imagery and local records are needed to determine timing and cause.
Sources and Reference Data
- MRLC Annual NLCD Data – official access point for annual land-cover and comparison products
- USGS Annual NLCD Land Cover Classification – land-cover class definitions and interpretation guidance
- U.S. Census Bureau TIGER/Line Shapefiles – official county-boundary reference
- Dougherty County Government – About Dougherty County – local context on the Flint River, cypress swamps, and county setting
- UGA Extension – Dougherty County Agriculture & Natural Resources – local agriculture and natural-resource programs
- City of Albany – Plans & Special Studies – Albany-Dougherty comprehensive planning and Flint River planning resources
Map File Information
The ZIP contains four original JPG maps for comparing Dougherty County’s 2025 land cover, forest and farmland, Albany-area hard surfaces, and 1985–2025 class differences.
- Included Files: Four original JPG land-cover maps
- File Type: JPG files in one ZIP archive
- Intended Use: Printing, education, presentations, and map-based projects
Related Maps
- Appling County Georgia Land Cover Map
- Atkinson County Georgia Land Cover Map
- Bacon County Georgia Land Cover Map
Green Map creates custom-edited map images using open geographic data sources such as geoBoundaries, Natural Earth, OpenStreetMap, and government open data. These maps are edited visual materials, not raw data files, and are provided for education, documents, presentations, and graphic reference.