Agriculture is the defining surface in Dooly County in 2025, covering 53.27% of the mapped area. Wetlands account for 16.56%, forest for 15.82%, and developed land for 7.64%. This Dooly County Georgia Land Cover Map focuses on where those classes occur, how the county’s hard surfaces cluster around towns and major roads, and what the 1985–2025 comparison can and cannot tell us. The four original JPG maps used for this page can be downloaded together in one ZIP below.
The county does not look like one uninterrupted farm field. Large agricultural blocks are broken by wet corridors, wooded patches, small developed centers, and a network of roads. That mixture matters when the map is used for a county profile or a classroom lesson because the percentages describe area totals, while the map itself shows how quickly one surface can give way to another.
Dooly County’s comprehensive planning material provides useful context for the visible built pattern. The county includes Vienna, Unadilla, Pinehurst, Lilly, Byromville, and Dooling, and the plan notes about 19 miles of exposure to Interstate 75 with five interchanges. That helps explain why a narrow north–south hard-surface line and several compact development clusters stand out inside a predominantly agricultural county, without assuming that every red or orange pixel is caused by the interstate.
Table of Contents
A countywide view dominated by fields, not pavement
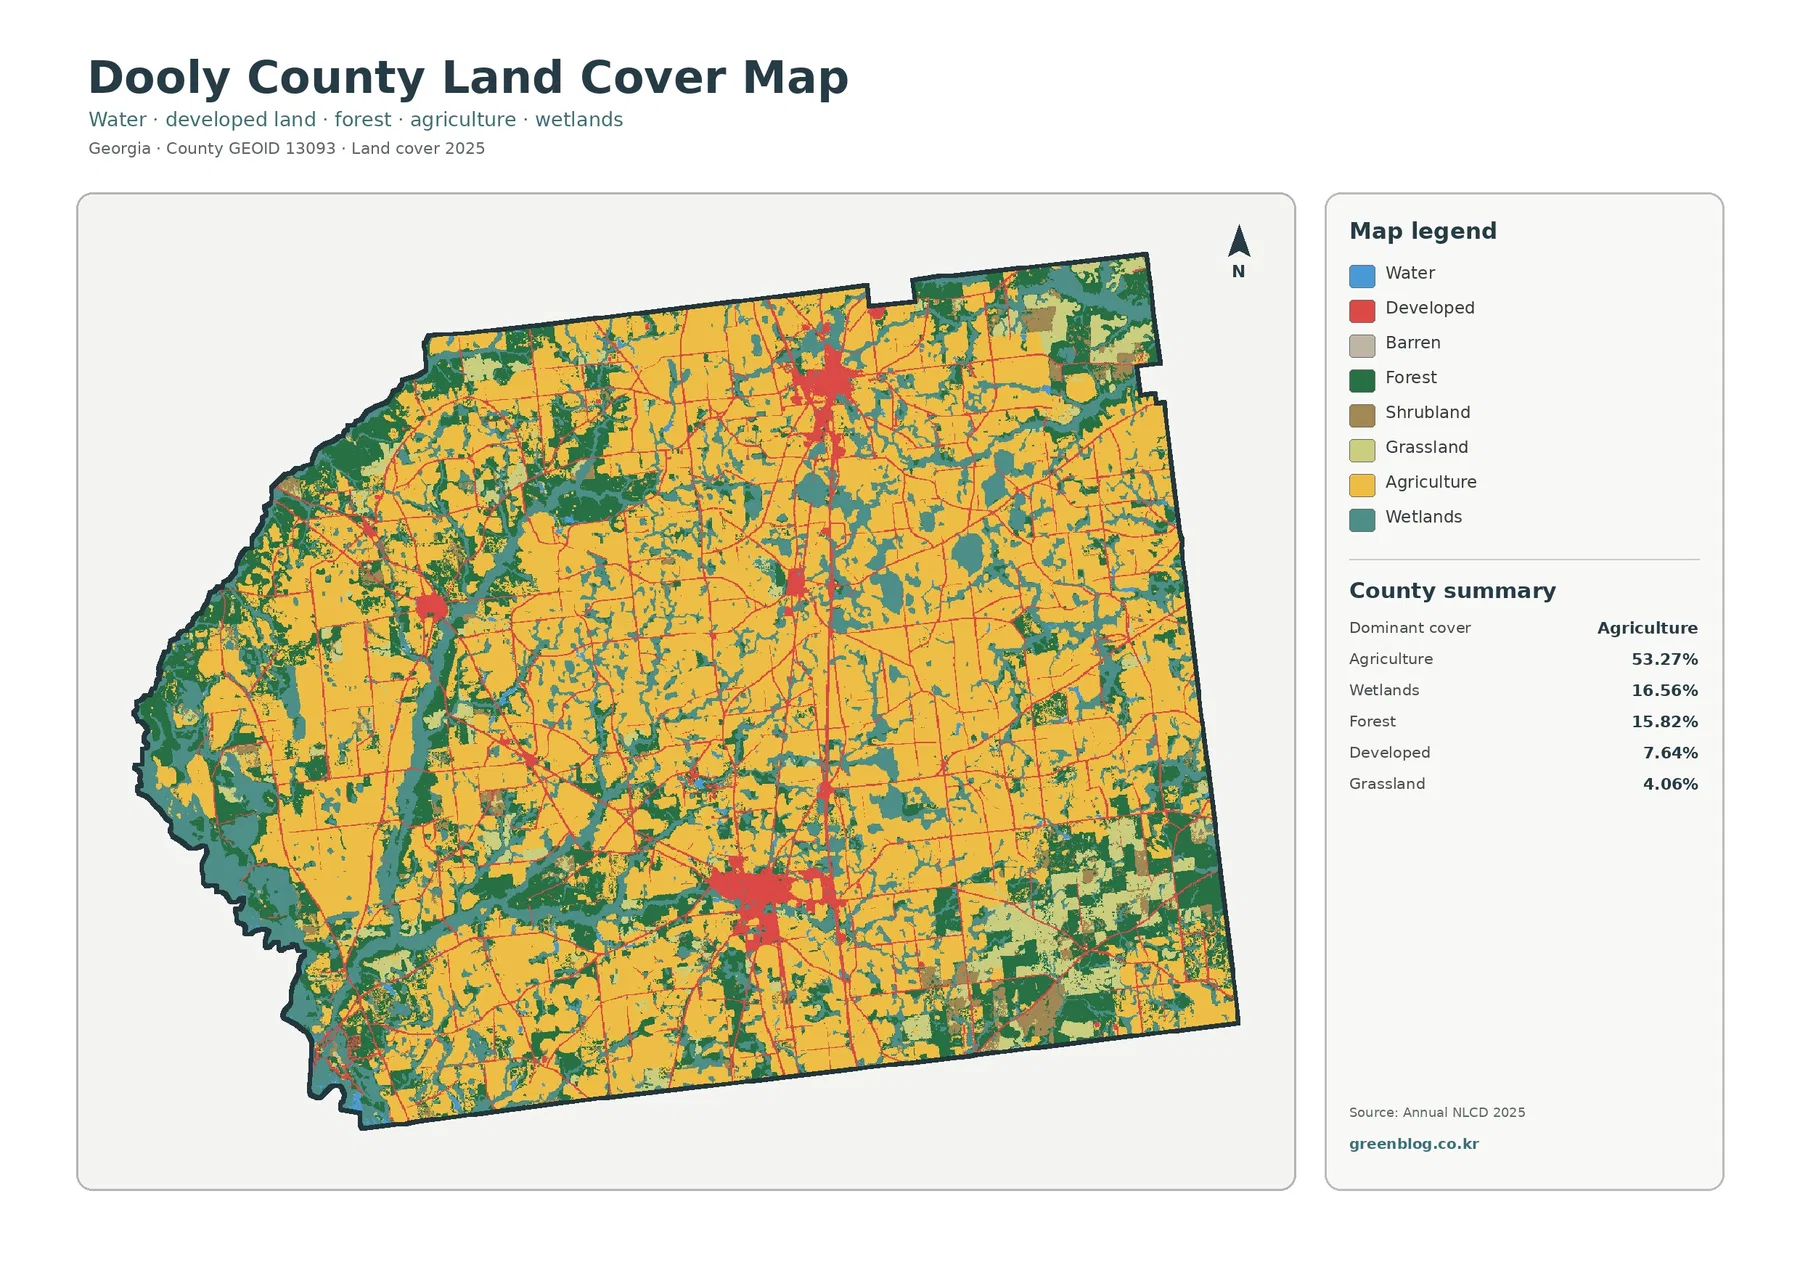
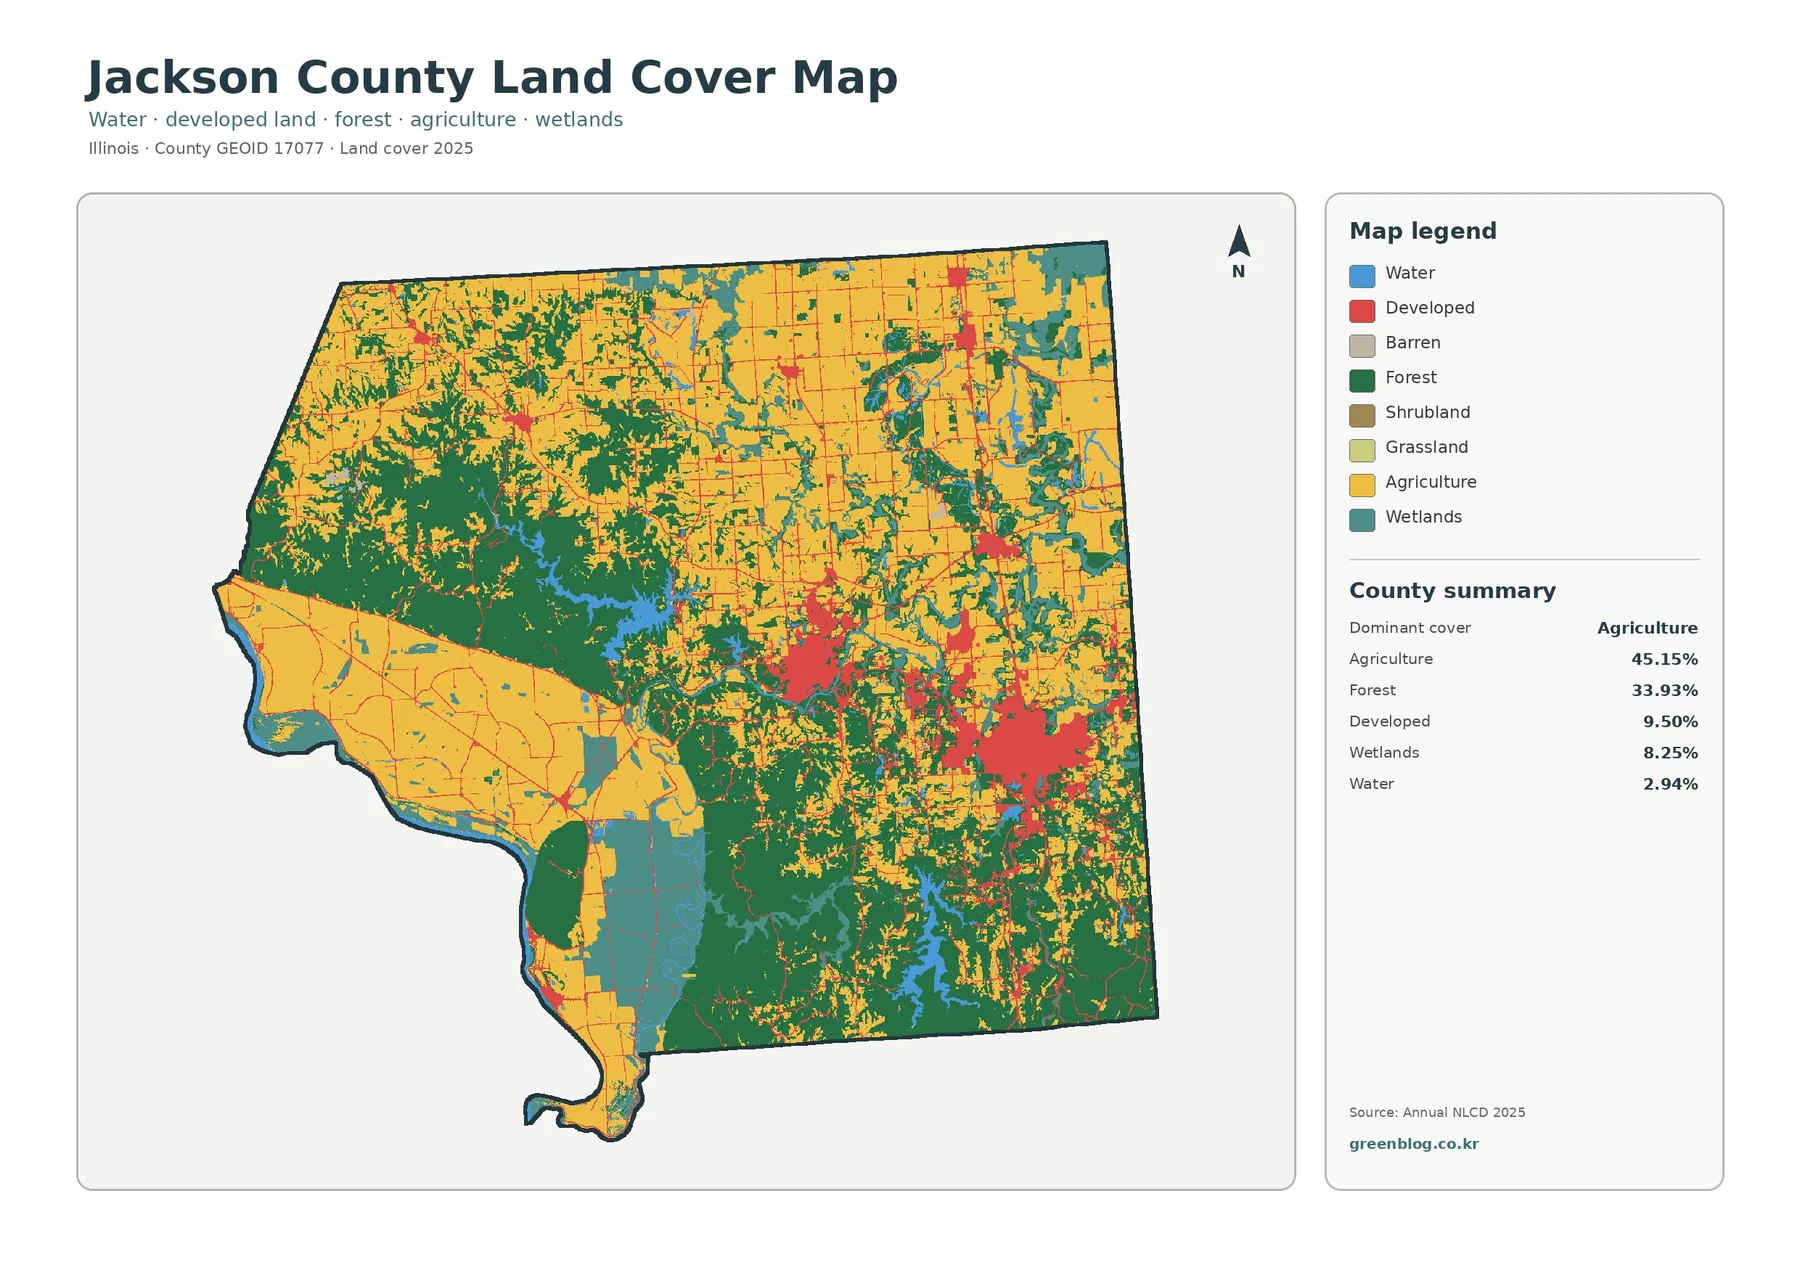
Yellow agricultural cells cover broad parts of the north, center, east, and south. They form the largest blocks on the map and account for more than half of the county. Wetlands and forest repeatedly interrupt those fields, however, so the countywide pattern is better described as a farm landscape crossed by wooded and wet drainage areas than as a uniform agricultural plain.
Wetlands are the second-largest class at 16.56%. They are especially noticeable toward the west and southwest, and thinner wet strips extend into the interior. Dooly County planning documents identify the Flint River along part of the western boundary and describe drainage toward the Flint, Ocmulgee, and Alapaha systems. That watershed setting is useful background for the mapped wet areas, but the land-cover class is not a legal wetland determination.
Forest covers 15.82%. The darker green areas are more fragmented than the farm blocks, yet they remain substantial along the western side, near wet corridors, and in scattered tracts throughout the county. Developed land is only 7.64% countywide, but its red tones are visually strong because they are concentrated in a few small centers and along roads rather than spread evenly across the landscape.
The smaller 2025 categories round out the picture: grassland is 4.06%, shrubland 2.12%, and open water 0.52%. Together they bring the mapped classes to essentially the full county after rounding. These smaller classes are useful for interpreting transitions at field edges and around wet or wooded areas, but they should not be treated as parcel boundaries or zoning categories.
Hard surfaces reveal the transportation and town pattern
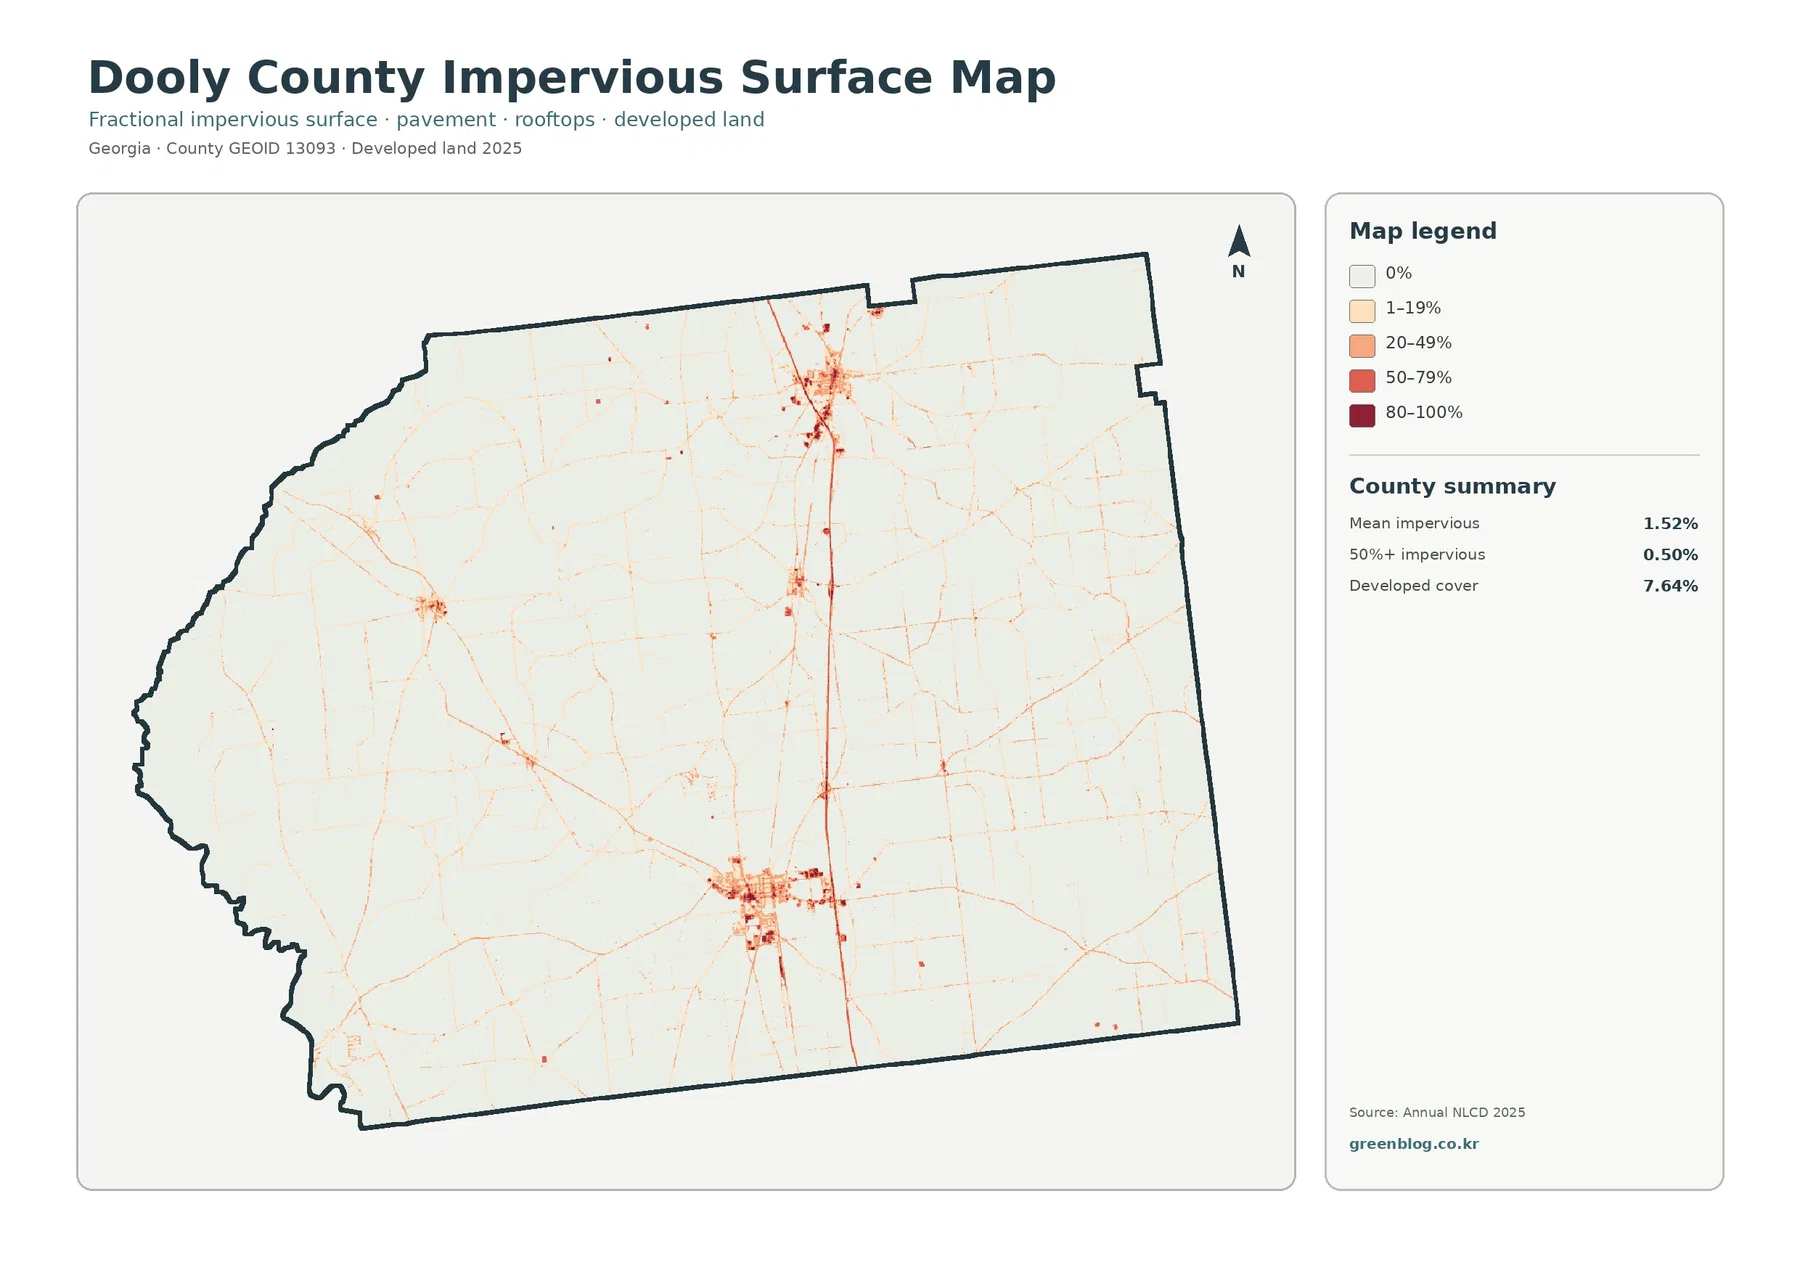
The impervious-surface map strips away much of the land-cover color and makes roads and compact built areas easier to see. Mean impervious cover is 1.52%, and only 0.50% of the county is mapped at 50% impervious or higher. Those figures are much lower than the 7.64% developed-cover total because developed classes can contain lawns, trees, bare soil, and other surfaces that still allow water to infiltrate.
A prominent north–south line crosses the central to eastern portion of the county, with brighter concentrations at several points along it. The county comprehensive plan describes five I-75 interchanges and identifies interstate gateways serving Pinehurst, Unadilla, and Vienna. The visible hard-surface line is consistent with that corridor. For exact road names, interchange locations, or municipal limits, the county road maps or Georgia DOT data should be used instead of relying on this generalized raster alone.
Outside the main corridor and town centers, most roads appear as very thin lines and many rural properties barely register. That contrast is useful when explaining the difference between a developed classification and a truly impervious surface. A farmstead may be part of a developed pixel even though much of the cell remains soil, grass, or vegetation; a highway interchange or large parking area, by comparison, can produce a much stronger impervious signal.
This map can support a broad discussion of runoff and development concentration, but it is not a drainage model. A higher impervious percentage generally means more pavement and roofs, yet flood behavior also depends on slope, soils, ditches, culverts, stream capacity, rainfall, and floodplain position. Dooly County’s Zoning & Floodplain Department should be consulted for current regulatory or permit questions.
Farmland, forest, and wetlands form the rural matrix
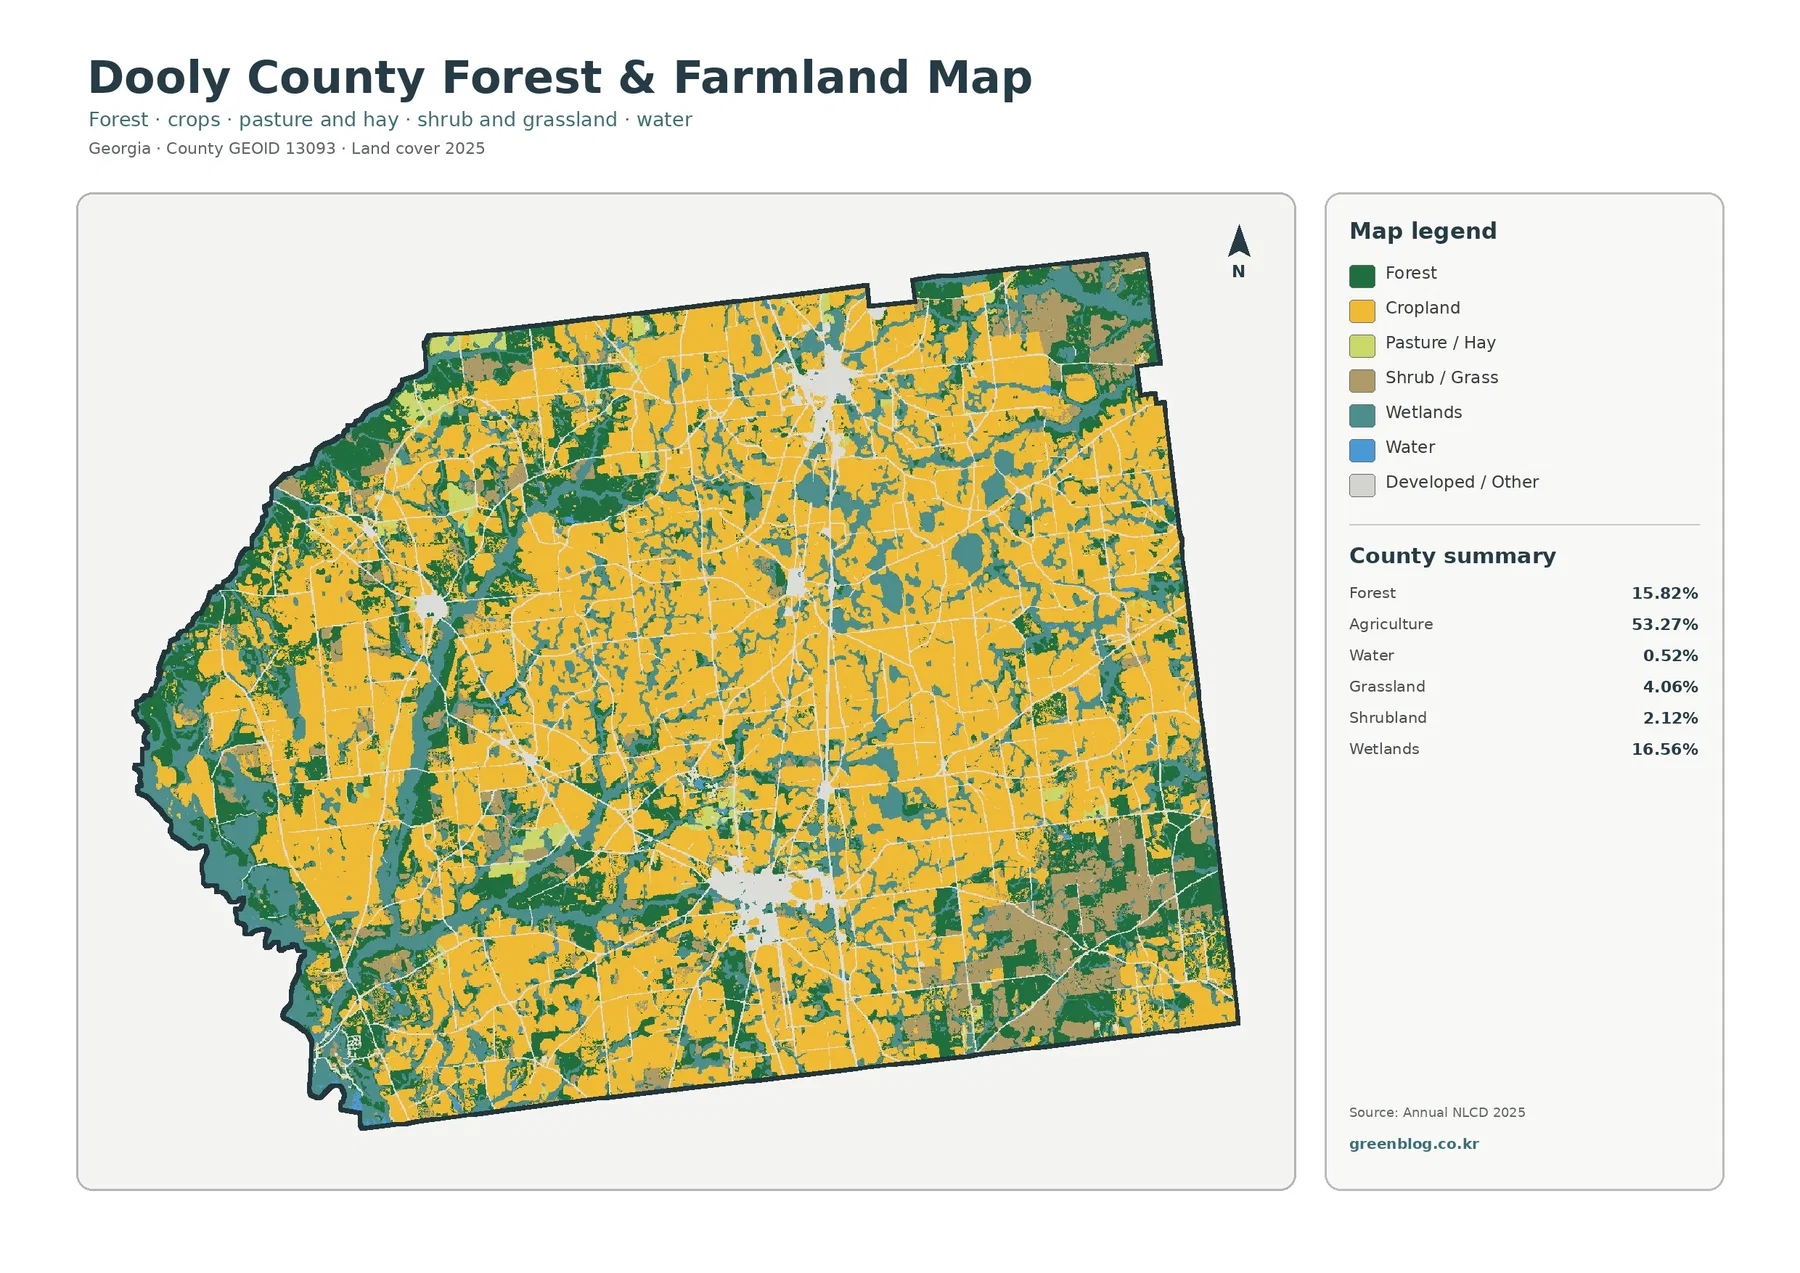
Removing most of the urban detail makes the agricultural dominance even clearer. Crop areas occupy 53.27% of the county, while forest and wetlands together account for 32.38%. That means nearly one-third of the mapped area is either wooded or wet even in a county where farming is the single largest cover type. The result is a patchwork rather than a simple split between farms and towns.
Local agricultural context supports that reading. UGA Cooperative Extension in Dooly County provides crop information for producers and highlights cotton and peanuts among the county’s important agricultural activities. The land-cover map does not identify crop species, so an agricultural pixel should not be labeled as cotton, peanuts, or any other specific crop without a separate agricultural dataset.
The western edge deserves separate attention because the Flint River forms part of the county boundary. Planning documents also note several tributaries and broader drainage toward major river basins. On the map, wetland cells become more extensive near that side and follow branching paths elsewhere. Those shapes are useful for watershed discussion, but narrow streams and small wet features may be simplified or missed at the source resolution.
Annual NLCD is a raster product, meaning the county is divided into square cells rather than surveyed parcels. The land-cover classification is based on 30-meter cells, so a single cell can include crop rows, trees, a ditch, grass, a road, and a small building even though it receives one predominant label. Zooming in makes the cells larger on screen; it does not create parcel-level detail that was never present in the source.
What changed between 1985 and 2025
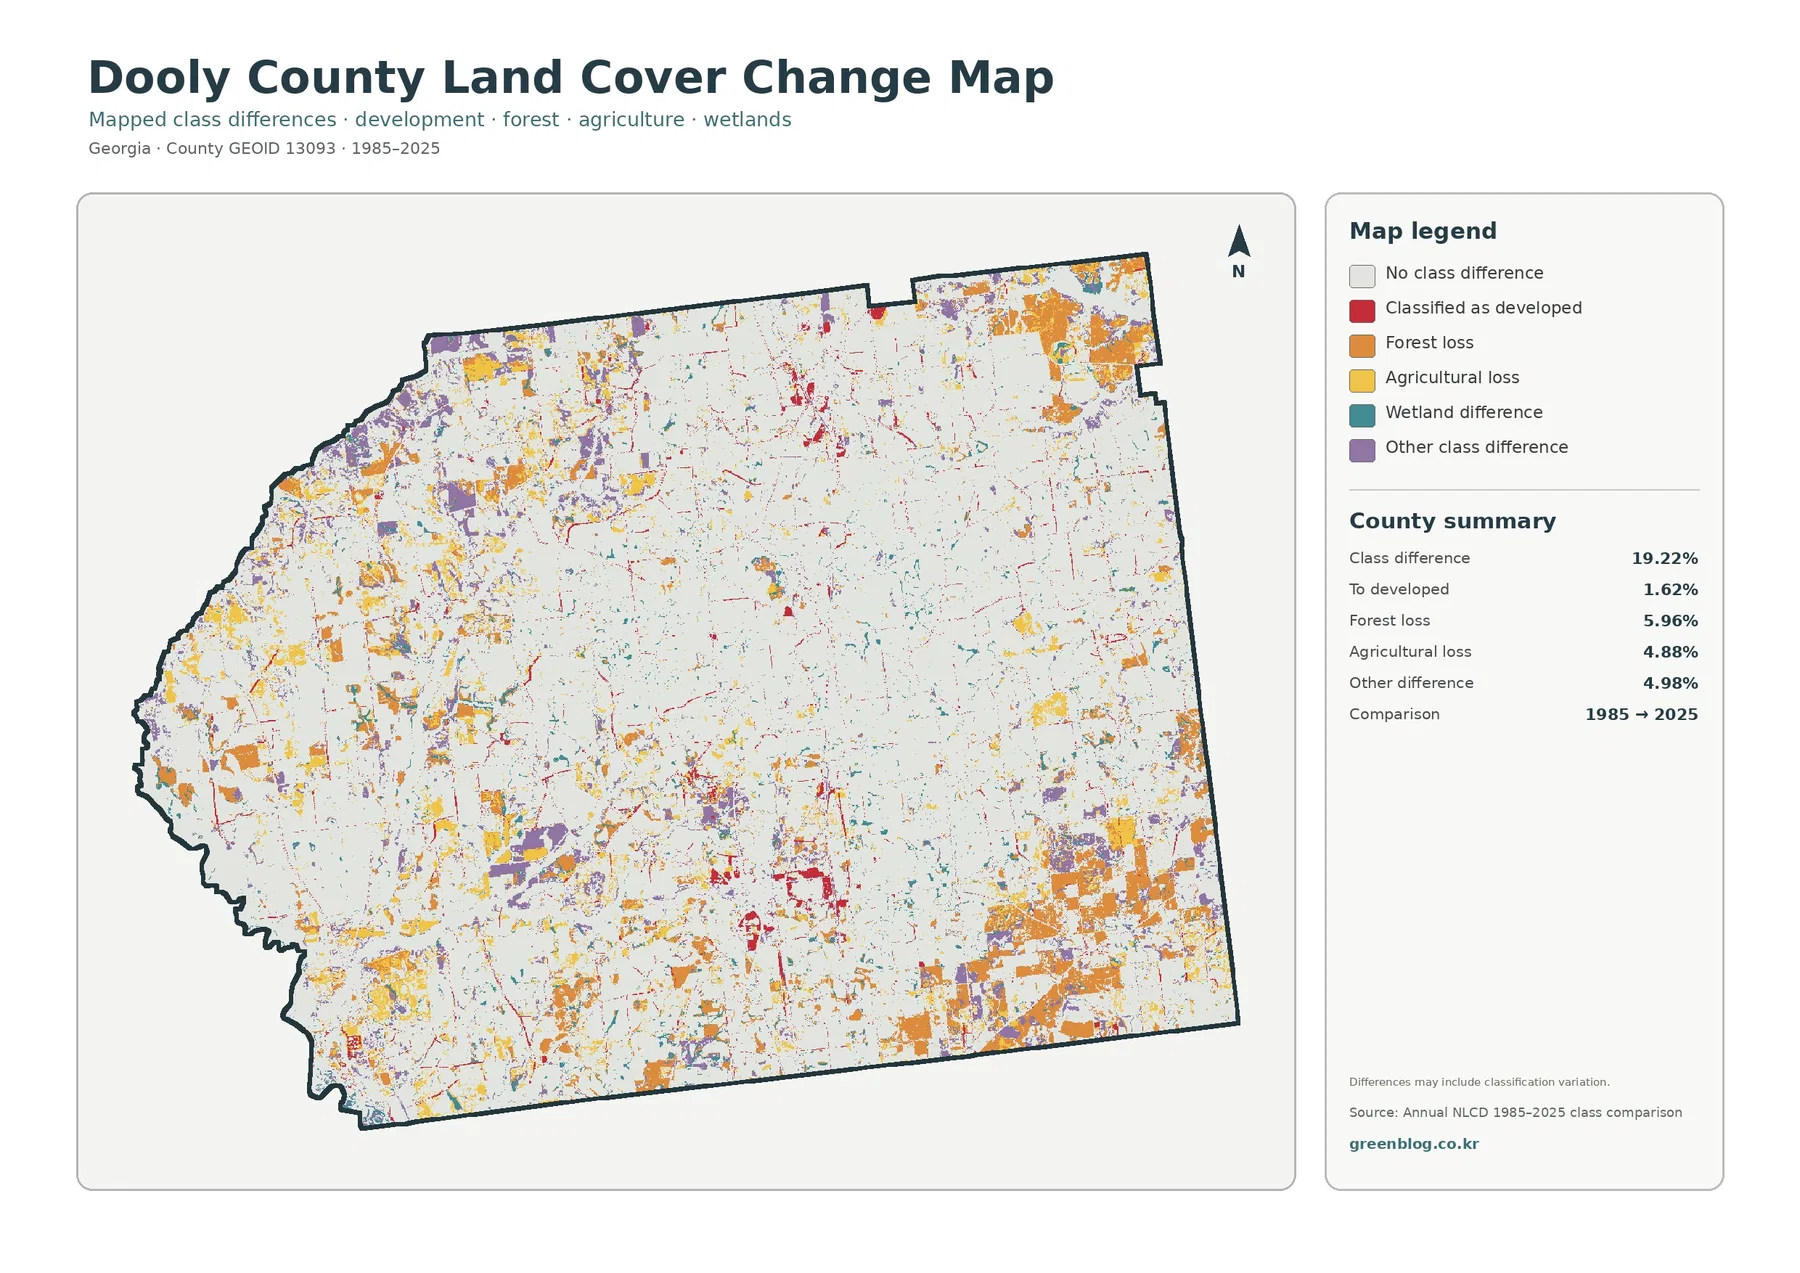
The supplied change map reports a class difference for 19.22% of the county. Forest loss is listed at 5.96%, agricultural loss at 4.88%, conversion to developed at 1.62%, and other difference at 4.98%. Large pale areas represent cells with no class difference between the two endpoints, while the colored areas identify places worth checking more closely.
Those labels need cautious interpretation. A cell categorized as forest in 1985 and something else in 2025 is counted as forest loss in this comparison, but the map does not show the year of change or prove a permanent clearing. Timber harvest followed by regrowth, field rotation, wetness changes, sensor differences, and classification uncertainty can all complicate a two-date comparison.
The developed-change category is relatively small countywide, yet its red patches tend to appear near existing built centers and transportation lines. That association can help a researcher decide where to look next, but it does not establish which highway project, subdivision, or business created a particular change. Intermediate imagery, parcel history, building records, and local planning documents are needed for that level of explanation.
Forest and agricultural differences are scattered much more broadly. Because farm and forest boundaries are common across Dooly County, even modest shifts at those edges can produce many small colored cells. When using the map in a report, it is more useful to separate large contiguous change areas from isolated speckles than to treat every colored cell as an equally important event.
Choosing the right map for a report, class, or comparison
For a quick county introduction, begin with the 2025 land-cover map. It explains the basic hierarchy immediately: agriculture first, then wetlands and forest, with compact developed areas. Once readers understand that structure, the forest-and-farmland view can be used to simplify the rural pattern, while the impervious map can isolate roads, town centers, and other hard surfaces.
A watershed or environmental lesson benefits from comparing the western wet areas with the large agricultural interior. The Flint River boundary and branching wetland pattern provide a clear example of how water-related cover can exist inside a farm-dominated county. The map is suitable for broad visual comparison, but any statement about a specific wetland, stream setback, or floodplain should be checked against current regulatory data.
For transportation or growth discussions, the impervious map is the most direct starting point. It shows why countywide averages can be low even when a major route and several town centers are clearly visible. Pairing that map with Dooly County’s official road maps or comprehensive plan can help distinguish the broad land-cover signal from named roads and local jurisdiction boundaries.
The 1985–2025 comparison is most useful as a screening tool. It can point to areas where the endpoint classifications differ, allowing a researcher to select a few locations for closer review. It should not be presented as a year-by-year history, and the 19.22% class-difference figure should never be restated as the amount of land that was developed or damaged.
Resolution, date, and other limits to keep in mind
Each original JPG in the download measures 2480 × 1754 pixels. That size works well for web pages, normal documents, classroom slides, and many presentation graphics. The package does not identify these files as meeting an A3 high-resolution standard, so users planning a large poster should test the output at the intended print size before relying on fine labels or boundaries.
The 2025 map is a snapshot of the supplied observation year. Construction, harvest, crop rotation, timber activity, vegetation recovery, and water conditions after that date may not be represented. A current planning or property question therefore needs more recent imagery and official local records even when the countywide pattern remains useful.
Land cover should also be kept separate from land use, zoning, ownership, and development rights. A crop class describes what covers the surface in the satellite-based classification; it does not say who owns the property or whether a particular use is legally permitted. Dooly County’s official zoning and map resources are the appropriate place to begin those questions.
Finally, class boundaries are generalized. Mixed pixels are unavoidable where fields, woods, roads, ditches, and buildings share a small area. That is why the maps work best for county-scale context, comparisons, and educational graphics rather than surveying, engineering design, legal wetland delineation, or parcel-level decisions.
Download the four original JPG maps
The ZIP contains one JPG for 2025 land cover, one for forest and farmland, one for impervious surface and developed land, and one for the 1985–2025 class comparison. Use the countywide image for the overall story, the rural-cover image for farm and wetland discussion, the impervious image for roads and towns, and the change image when you need to locate endpoint differences.
Frequently Asked Questions
What is the largest land-cover class in Dooly County in 2025?
Agriculture is the largest class at 53.27%. Wetlands are second at 16.56%, followed by forest at 15.82%. The county is therefore strongly agricultural, but the map also shows extensive wet and wooded areas that break up the farm blocks, especially toward the western side and along branching drainage features.
Why is developed cover 7.64% when mean impervious cover is only 1.52%?
Developed land is broader than pavement and rooftops. Developed classes may contain lawns, trees, bare ground, and other permeable surfaces around buildings and roads. The impervious layer isolates hard materials such as pavement, parking areas, and roofs, so its countywide mean is much lower.
Does the 19.22% class difference mean that 19.22% of Dooly County was developed after 1985?
No. The 19.22% figure includes every cell that received a different land-cover class at the two endpoints. Only 1.62% is summarized as conversion to developed in the supplied map. Forest loss, agricultural loss, wetland differences, and other classification changes are separate parts of the total.
Sources and Reference Data
- MRLC Annual NLCD Data – official access to Annual NLCD land-cover and comparison products
- USGS Annual NLCD Land Cover Classification – classification definitions and guidance for forest, agriculture, wetlands, developed land, and related classes
- U.S. Census Bureau TIGER/Line Shapefiles – official county-boundary reference for Dooly County
- Georgia DCA – Dooly County & Cities Comprehensive Plan – local planning context for I-75, incorporated places, development, and natural resources
- UGA Cooperative Extension – Dooly County Agriculture & Natural Resources – county-specific agricultural information and producer resources
- Dooly County Maps – official local maps for roads, zoning, and other county reference needs
Map File Information
The ZIP contains four original JPG maps for comparing Dooly County agriculture, wetlands, forest, I-75-area hard surfaces, and 1985–2025 class differences.
- Included Files: 4 original JPG land cover map files shown in this article
- File Type: JPG files in a ZIP archive
- Intended Use: Printing, education, presentations, and map-based projects
Related Maps
- Appling County Georgia Land Cover Map
- Atkinson County Georgia Land Cover Map
- Bacon County Georgia Land Cover Map
Green Map creates custom-edited map images using open geographic data sources such as geoBoundaries, Natural Earth, OpenStreetMap, and government open data. These maps are edited visual materials, not raw data files, and are provided for education, documents, presentations, and graphic reference.