Dodge County does not read as one simple block of forest or farmland on the 2025 data. Forest is the largest class at 29.79%, but wetlands follow at 23.66% and agriculture at 21.39%. Together they create a patchwork in which wooded tracts, wet ground, fields, grass, and smaller developed areas meet repeatedly across the county. This Dodge County Georgia Land Cover Map focuses on that mixture rather than treating the county as a single rural land-cover type. The four original JPG map files used on this page are also available to download together in one ZIP.
One feature is much more concentrated than the others: the developed footprint around Eastman, the county seat. The hard-surface map shows a compact center with thin road-like lines extending outward, while most of the county remains lightly impervious. Farther from that core, broad forest and wetland areas reappear alongside working agricultural land.
The page uses four supplied views: 2025 land cover, forest and farmland, impervious surface and developed land, and a 1985–2025 class-difference comparison. The WebP versions are placed with the discussion, and the four original 2480 × 1754-pixel JPGs are packaged together in one ZIP for county profiles, classroom material, reports, and visual comparisons.
Table of Contents
A compact built center stands out in a mostly low-impervious county
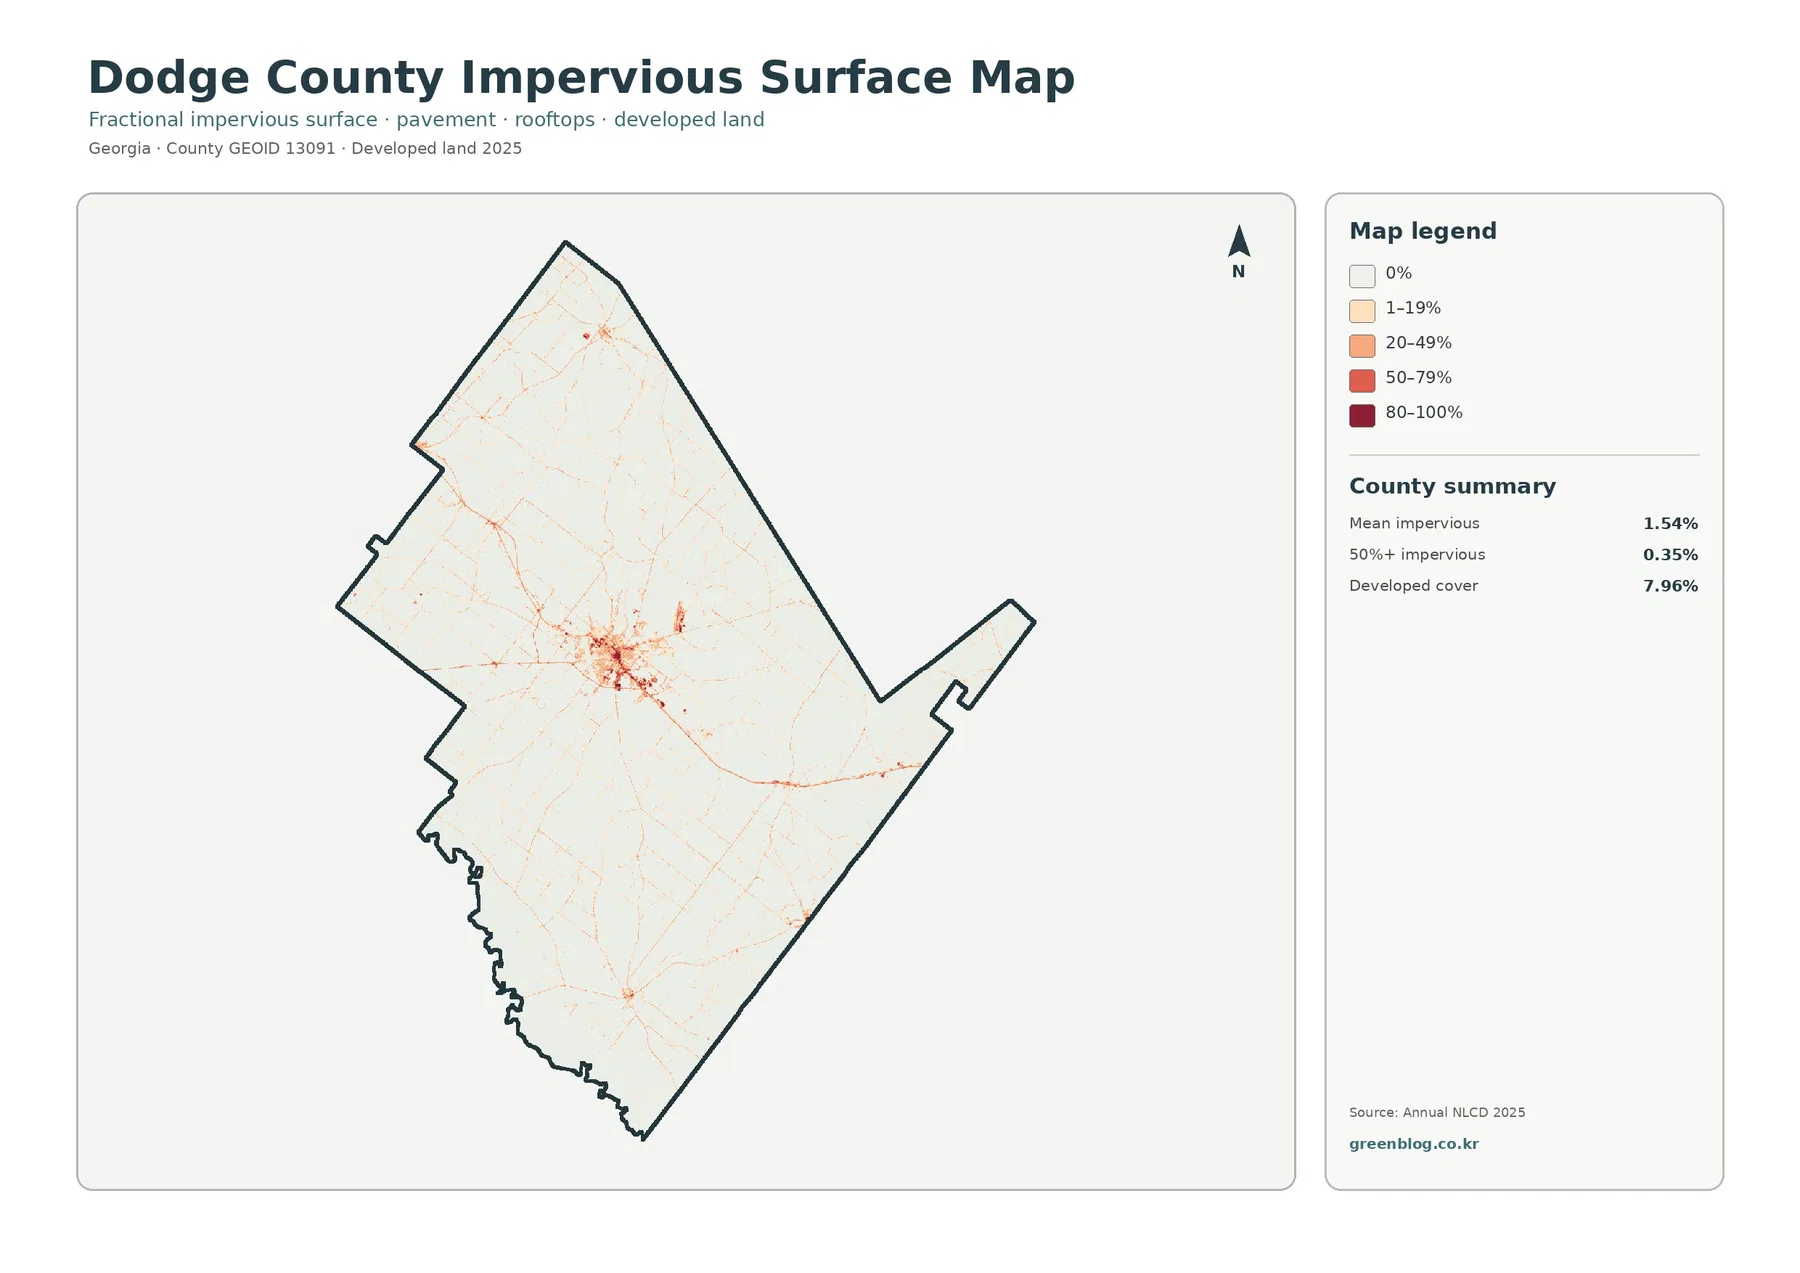
The impervious map is a useful starting point because it separates a small urbanized center from a much larger rural landscape. Mean impervious cover is only 1.54% countywide, and cells with at least 50% impervious cover account for 0.35%. Most of the map therefore stays near the light end of the legend, while a more intense cluster appears near the middle of the county.
Eastman sits in that central concentration. From the core, narrow lines extend in several directions, consistent with roads and the development that follows major local travel routes. The map is not a road map and does not label individual streets, so those lines should not be used to identify a specific highway. Their value is in showing that paved and built surfaces are concentrated rather than spread evenly across Dodge County.
Developed land covers 7.96% of the county, which is much higher than the 1.54% mean impervious value. Those two numbers are not supposed to match. A developed land-cover class can include lawns, trees, bare soil, and other permeable surfaces around homes and businesses, while the impervious product isolates roofs, pavement, parking areas, and similar hard materials. Reading the two maps together gives a clearer picture of settlement than using either percentage alone.
Forest, wetlands, and farmland share most of the county
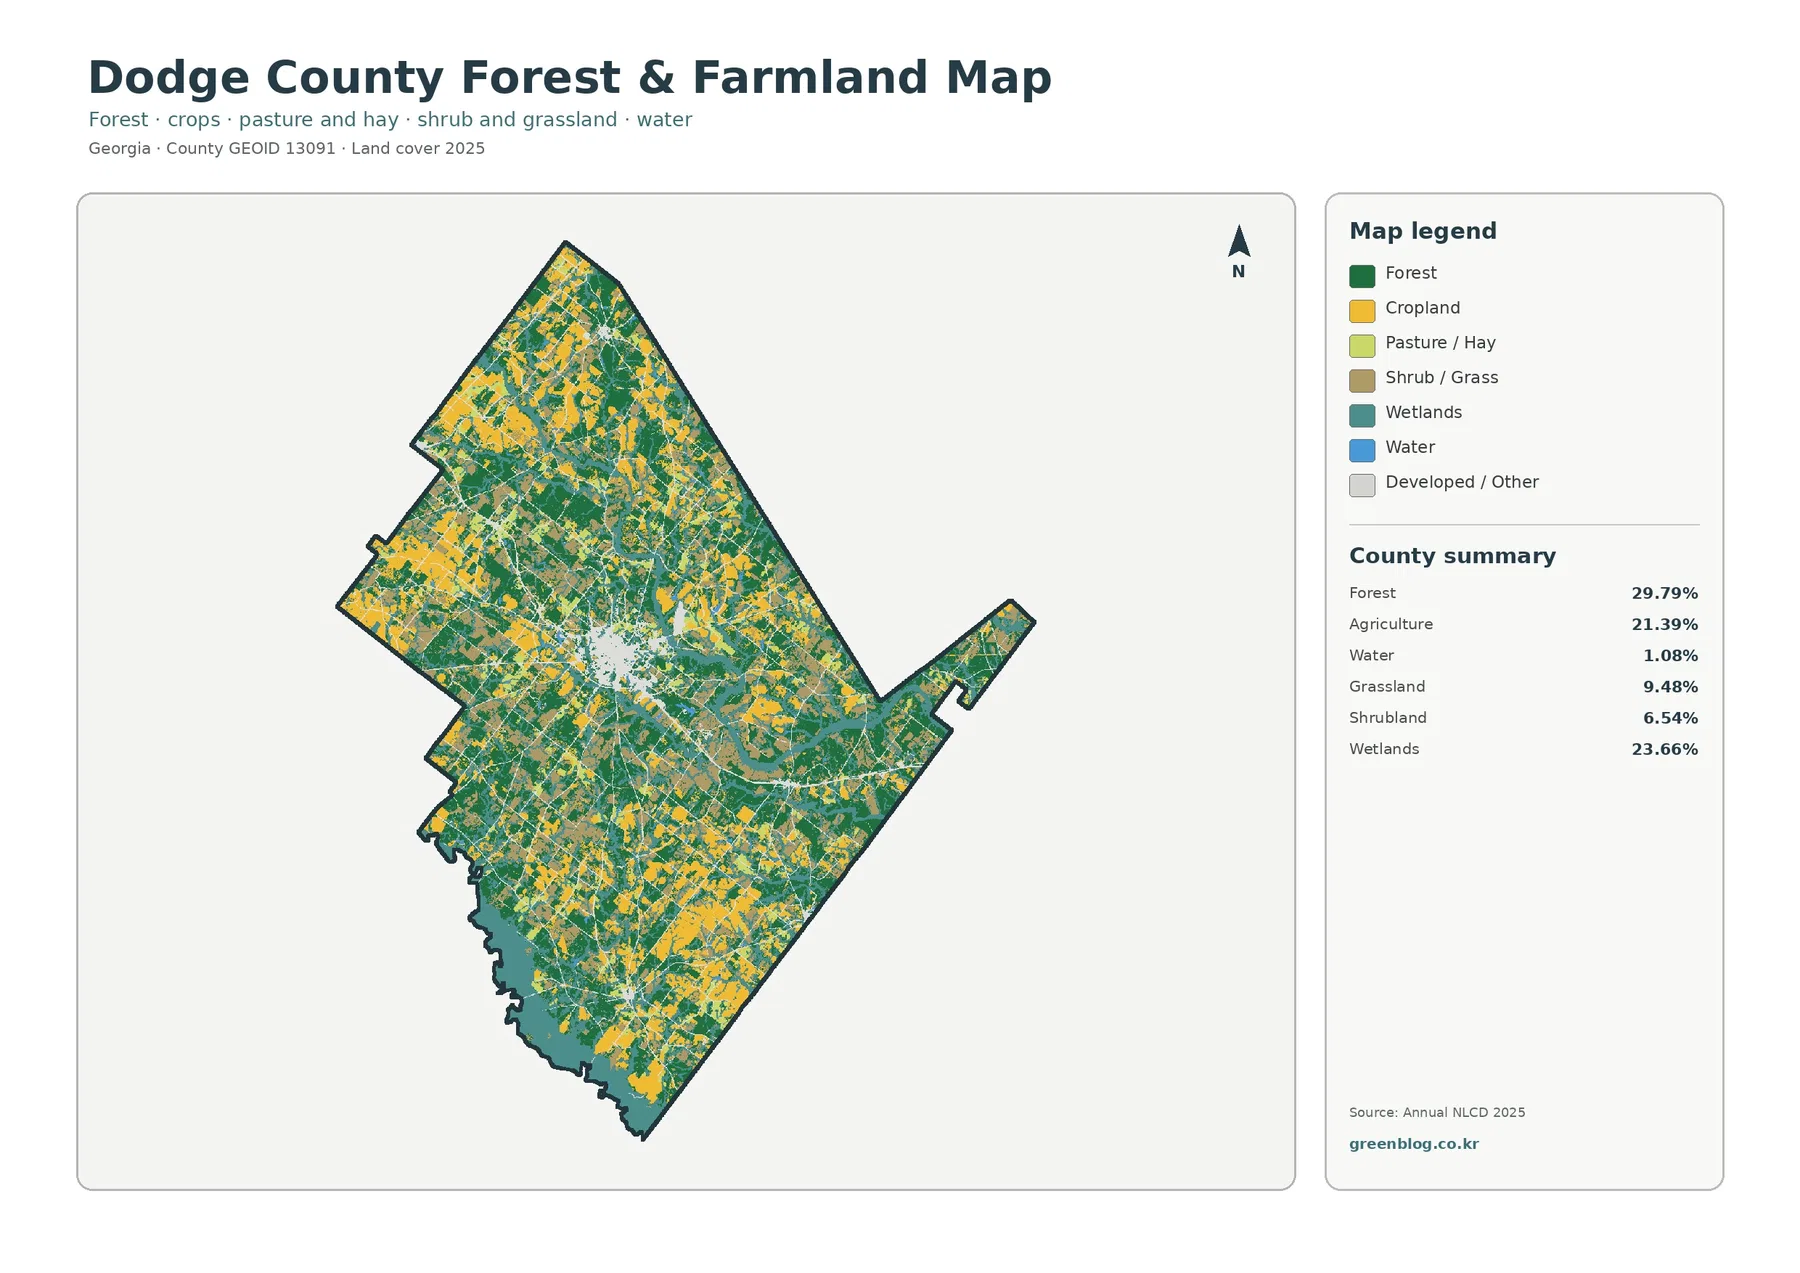
Forest leads the county summary at 29.79%, but the landscape is not dominated by one continuous wooded block. Dark-green forest appears throughout the county, often between farm fields and wet areas. Yellow agricultural patches are especially noticeable across the northern half and in broad parts of the west and southeast, yet they are broken by forest, wetlands, and other cover rather than forming a single uninterrupted farming plain.
Wetlands account for 23.66%, slightly more than agriculture at 21.39%. Teal wetland areas are particularly broad near the southern and southwestern edge and recur along internal low-lying corridors. Open water is only 1.08%, so the county should not be described as being dominated by lakes or large open-water surfaces. The much larger wetland percentage is the more important water-related land-cover signal.
Grassland adds 9.48% and shrubland 6.54%. Those classes help explain why the county cannot be reduced to a simple forest-versus-cropland comparison. Transitional areas, pasture-like cover, shrub and grass surfaces, wet ground, and forest edges occur repeatedly between larger field and woodland blocks. For a classroom or county profile, this map is useful when the goal is to explain how rural land covers interlock rather than simply list percentages.
The 2025 land-cover map brings the full mosaic back together
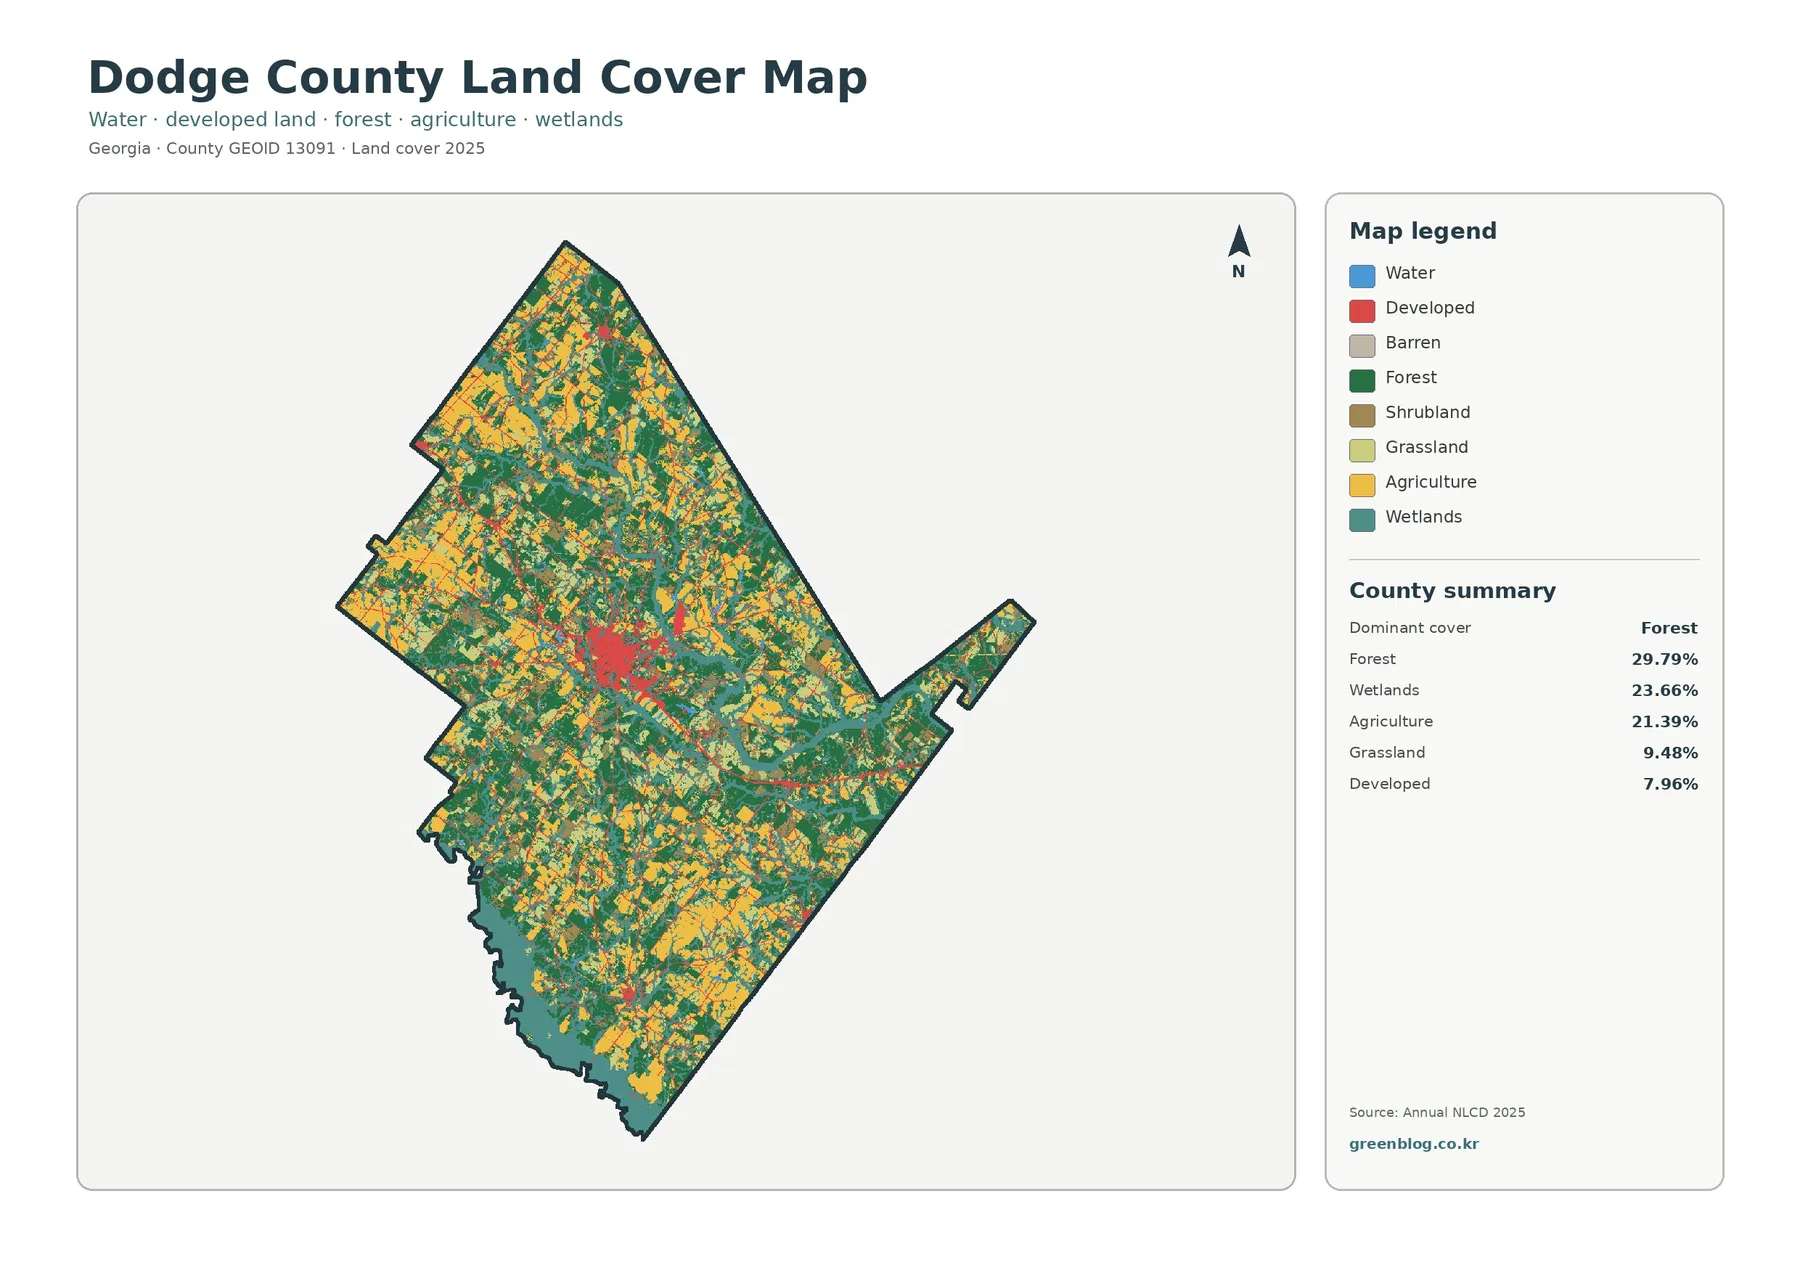
Once the simplified rural classes are understood, the general land-cover map shows how they fit around the developed center. The red Eastman area is clearly visible, but it occupies only a small share of a map filled with green, teal, and yellow. Agricultural blocks are often bordered by forest or wetlands, and wet areas frequently form irregular bands rather than neat rectangular patches.
This pattern matters because percentages alone can hide location. Two counties can have similar forest totals while arranging that forest very differently. In Dodge County, forest is distributed through much of the interior and outer areas, while agriculture and wetlands repeatedly interrupt it. The result is a fine-grained rural mosaic rather than a county split into a forest side and a farming side.
Land cover should not be confused with zoning, ownership, or legal land use. A cell classified as agriculture tells the reader what the surface was classified as in the dataset, not whether a parcel is legally zoned for agriculture or whether it can be developed. Likewise, a wetland-colored cell on this generalized map is not a substitute for an official wetland delineation or permitting decision.
What the 1985–2025 comparison does and does not show
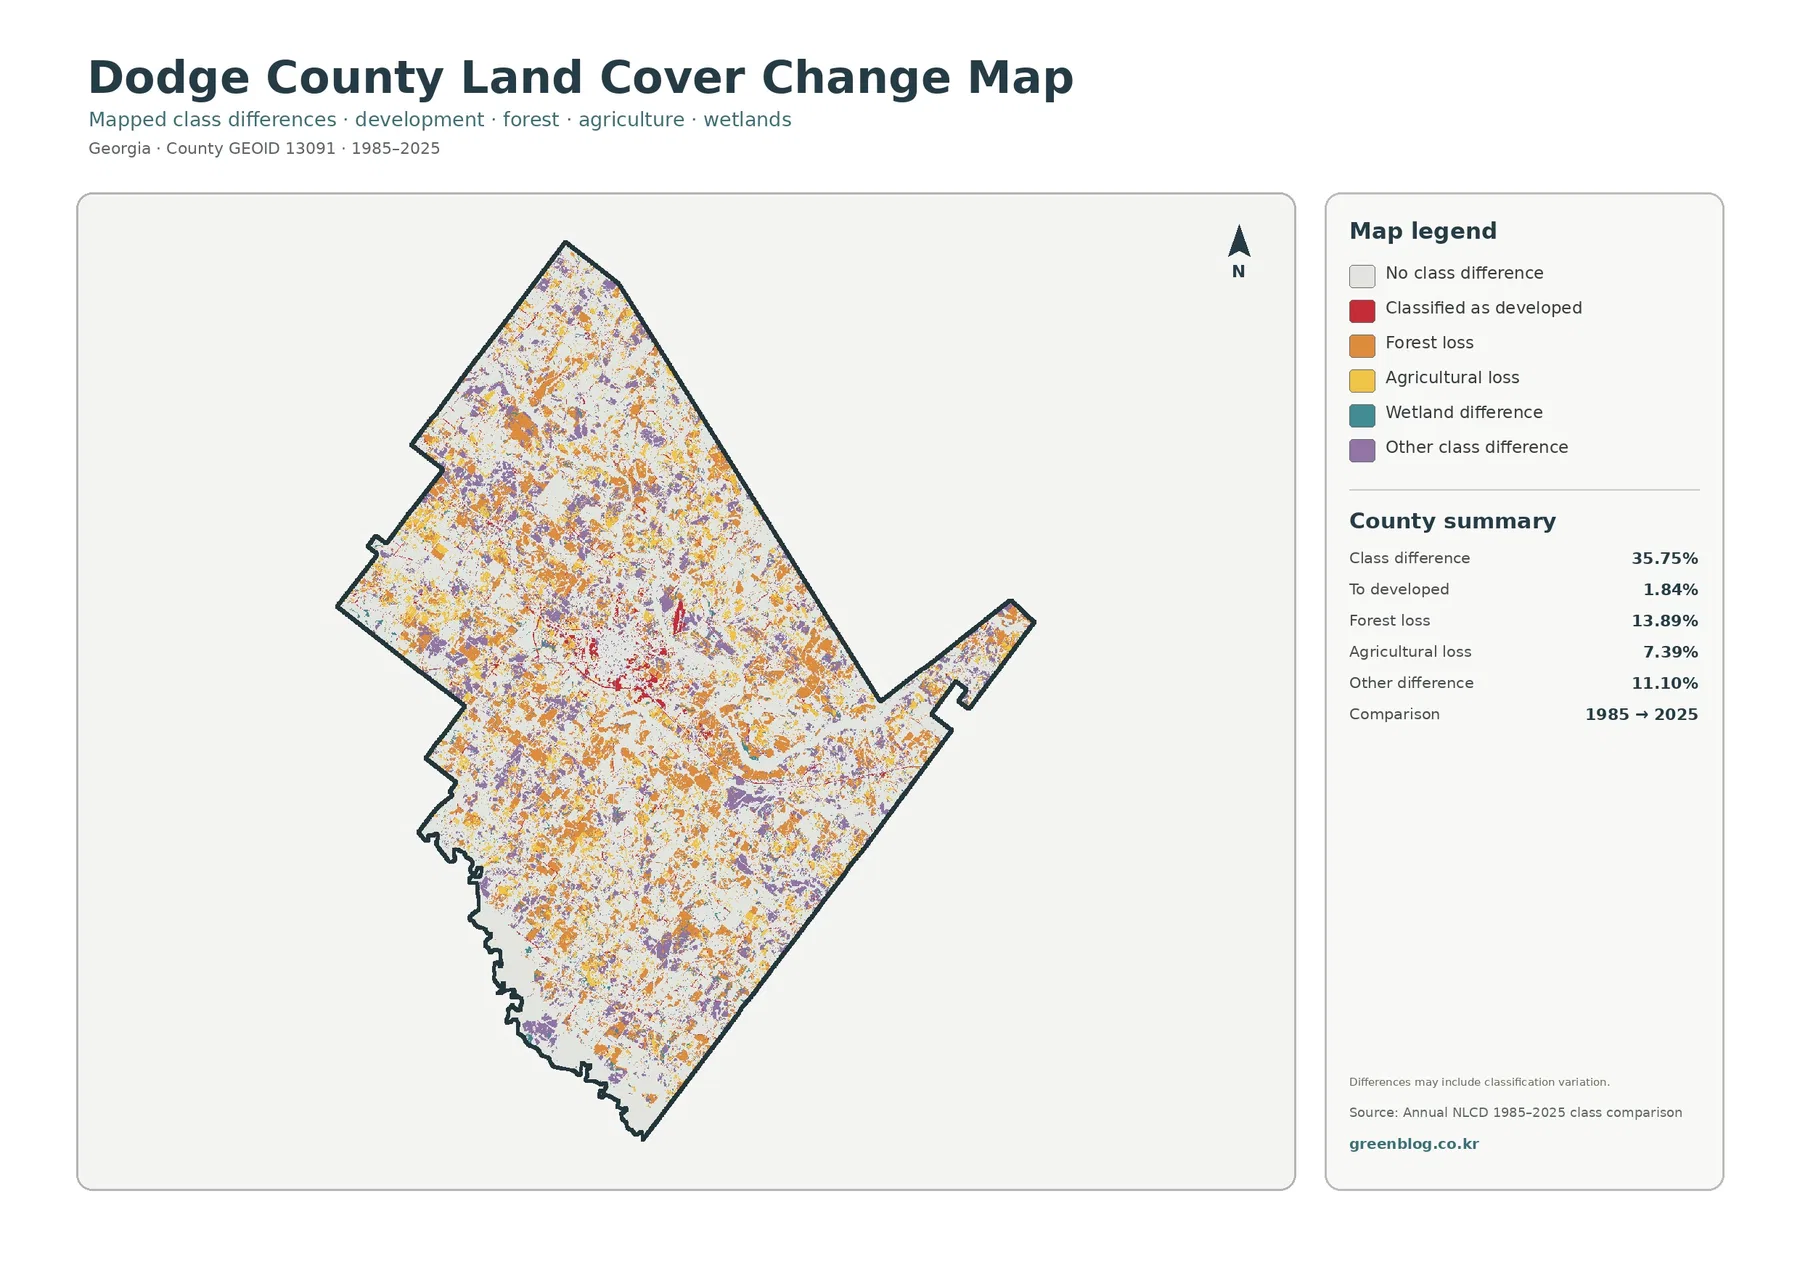
The change map reports a 35.75% class difference between the 1985 and 2025 endpoints. Forest loss accounts for 13.89%, agricultural loss for 7.39%, cells classified as developed for 1.84%, and other class differences for 11.10%. Those figures make it clear that the comparison is not simply a map of urban expansion. Development is one component of a much broader set of class changes.
Forest loss in this context should not automatically be read as permanent deforestation at every marked cell. Timber management, agricultural rotation, vegetation recovery, moisture conditions, differences between image dates, and classification variation can all affect an endpoint comparison. The map itself notes that differences may include classification variation, so a local explanation requires intermediate imagery and records rather than a conclusion based on two dates alone.
The most useful way to use this image is as a screening layer. Areas covered by the no-difference class stayed in the same mapped category at both endpoints, while colored cells identify places where the endpoint classes differ. A researcher can use those concentrations to decide where to examine aerial photographs, annual land-cover products, local planning records, or field observations next.
How to choose the right map for a specific question
For a quick county overview, start with the full 2025 land-cover map because it shows all major classes together. When the topic is rural land, the forest and farmland view removes some of the visual competition and makes fields, forest, wetlands, grass, and shrub cover easier to compare. For settlement and paved surfaces, the impervious map is more direct because Eastman and the thin connecting corridors stand out immediately.
The change map works best after the current pattern is understood. It answers a different question: where the 1985 and 2025 endpoint classes are different. That distinction helps avoid a common mistake in which the change layer is treated as a current land-cover map or every colored cell is described as a development project. Pairing the current map with the change map keeps present-day cover and historical comparison separate.
For a short presentation, one current map and one specialized map are usually enough. A lesson on agriculture might pair the full map with the forest and farmland version, while a discussion of Eastman could pair the full map with impervious surface. A longer report can use all four, provided each image introduces new information instead of repeating the same county description.
Scale, resolution, and practical limits
Annual NLCD is a generalized raster product built for consistent regional and national comparison. A mapped cell represents a classified surface area rather than a surveyed parcel boundary. Small buildings, narrow strips of vegetation, farm edges, drainage features, and mixed surfaces can therefore be generalized into the predominant class. Zooming the JPG does not create parcel-level information that was not present in the original data.
The maps are best treated as county-scale reference graphics. They are useful for broad land-cover comparison, environmental education, county profiles, presentations, and identifying areas for follow-up. They should not replace cadastral surveys, zoning maps, official wetland determinations, flood products, engineering plans, or current permit information. For a site-specific decision, use current high-resolution imagery and the appropriate local or agency records.
Four original JPG files included in the ZIP
The package contains one JPG each for 2025 land cover, forest and farmland, impervious surface and developed land, and the 1985–2025 land-cover comparison. Each file measures 2480 × 1754 pixels and is kept at the supplied original resolution. The package does not mark these files as meeting an A3 high-resolution reference, so a test print is sensible before enlarging them for a large poster.
For screen use, the files are large enough to show the county outline, legend, summary values, and broad spatial pattern clearly. They also work well as figures in ordinary documents when the main purpose is to compare forest, wetland, agriculture, development, impervious surface, or endpoint change. Keep the legend with the map whenever possible so colors are not interpreted without their original class labels.
Frequently Asked Questions
Is Dodge County mostly forest?
Forest is the largest single 2025 class at 29.79%, but it does not cover a majority of the county. Wetlands account for 23.66% and agriculture for 21.39%, so the county is better described as a mixture of forest, wet ground, and working land.
Why is developed cover 7.96% when mean impervious cover is only 1.54%?
Developed land-cover classes can include lawns, trees, soil, and other permeable surfaces around buildings and roads. Impervious cover focuses on roofs, pavement, parking areas, and similar hard surfaces, so its countywide mean is much lower.
Does the 35.75% class difference mean that much land was developed after 1985?
No. Only 1.84% is summarized as becoming developed in the endpoint comparison. The larger 35.75% value also includes forest loss, agricultural loss, other class differences, and possible classification variation. Intermediate imagery and local records are needed to explain specific changes.
Sources and Reference Data
- MRLC Annual NLCD Data – official access point for annual land-cover and comparison products
- USGS Annual NLCD Land Cover Classification – definitions and guidance for mapped forest, agriculture, wetlands, developed land, and related classes
- U.S. Census Bureau TIGER/Line Shapefiles – official county-boundary reference for Dodge County
- Dodge County Georgia Official Site – county government and local information
- UGA Extension – Dodge County Agriculture & Natural Resources – local agriculture, soil, water, and natural-resource information
- City of Eastman – official information for the Dodge County seat
Map File Information
The ZIP contains four original JPG maps for comparing Dodge County's 2025 land cover, forest and farmland, Eastman-centered impervious surfaces, and 1985–2025 class differences.
- Included Files: Four original JPG land-cover maps
- File Type: JPG files in one ZIP archive
- Intended Use: Printing, education, presentations, and map-based projects
Related Maps
- Appling County Georgia Land Cover Map
- Atkinson County Georgia Land Cover Map
- Bacon County Georgia Land Cover Map
Green Map creates custom-edited map images using open geographic data sources such as geoBoundaries, Natural Earth, OpenStreetMap, and government open data. These maps are edited visual materials, not raw data files, and are provided for education, documents, presentations, and graphic reference.