A four-map A3 JPG set for Bee County, Texas is available here as one ZIP download, covering the county and road layout, the ranked city view, waterways, and elevation. The maps are most useful when read together: Beeville sits near the center of the county road pattern, smaller communities extend north and south from it, the Aransas River system occupies the lower and eastern side of the county, and the terrain generally falls from the higher northwest toward the southeast.
Bee County is not difficult to recognize once a few landmarks are fixed in place. Beeville is the main reference point; Pettus lies to the north, Skidmore to the south, Pawnee toward the northwest, and Tynan near the southern edge. US 181 provides the clearest north-south route through this pattern, while US 59, SH 202, SH 72, and SH 359 help explain the other directions. The sections below follow what is actually labeled in the supplied maps rather than treating the county as a generic South Texas outline.
Table of Contents
Begin with Beeville and the north–south settlement pattern
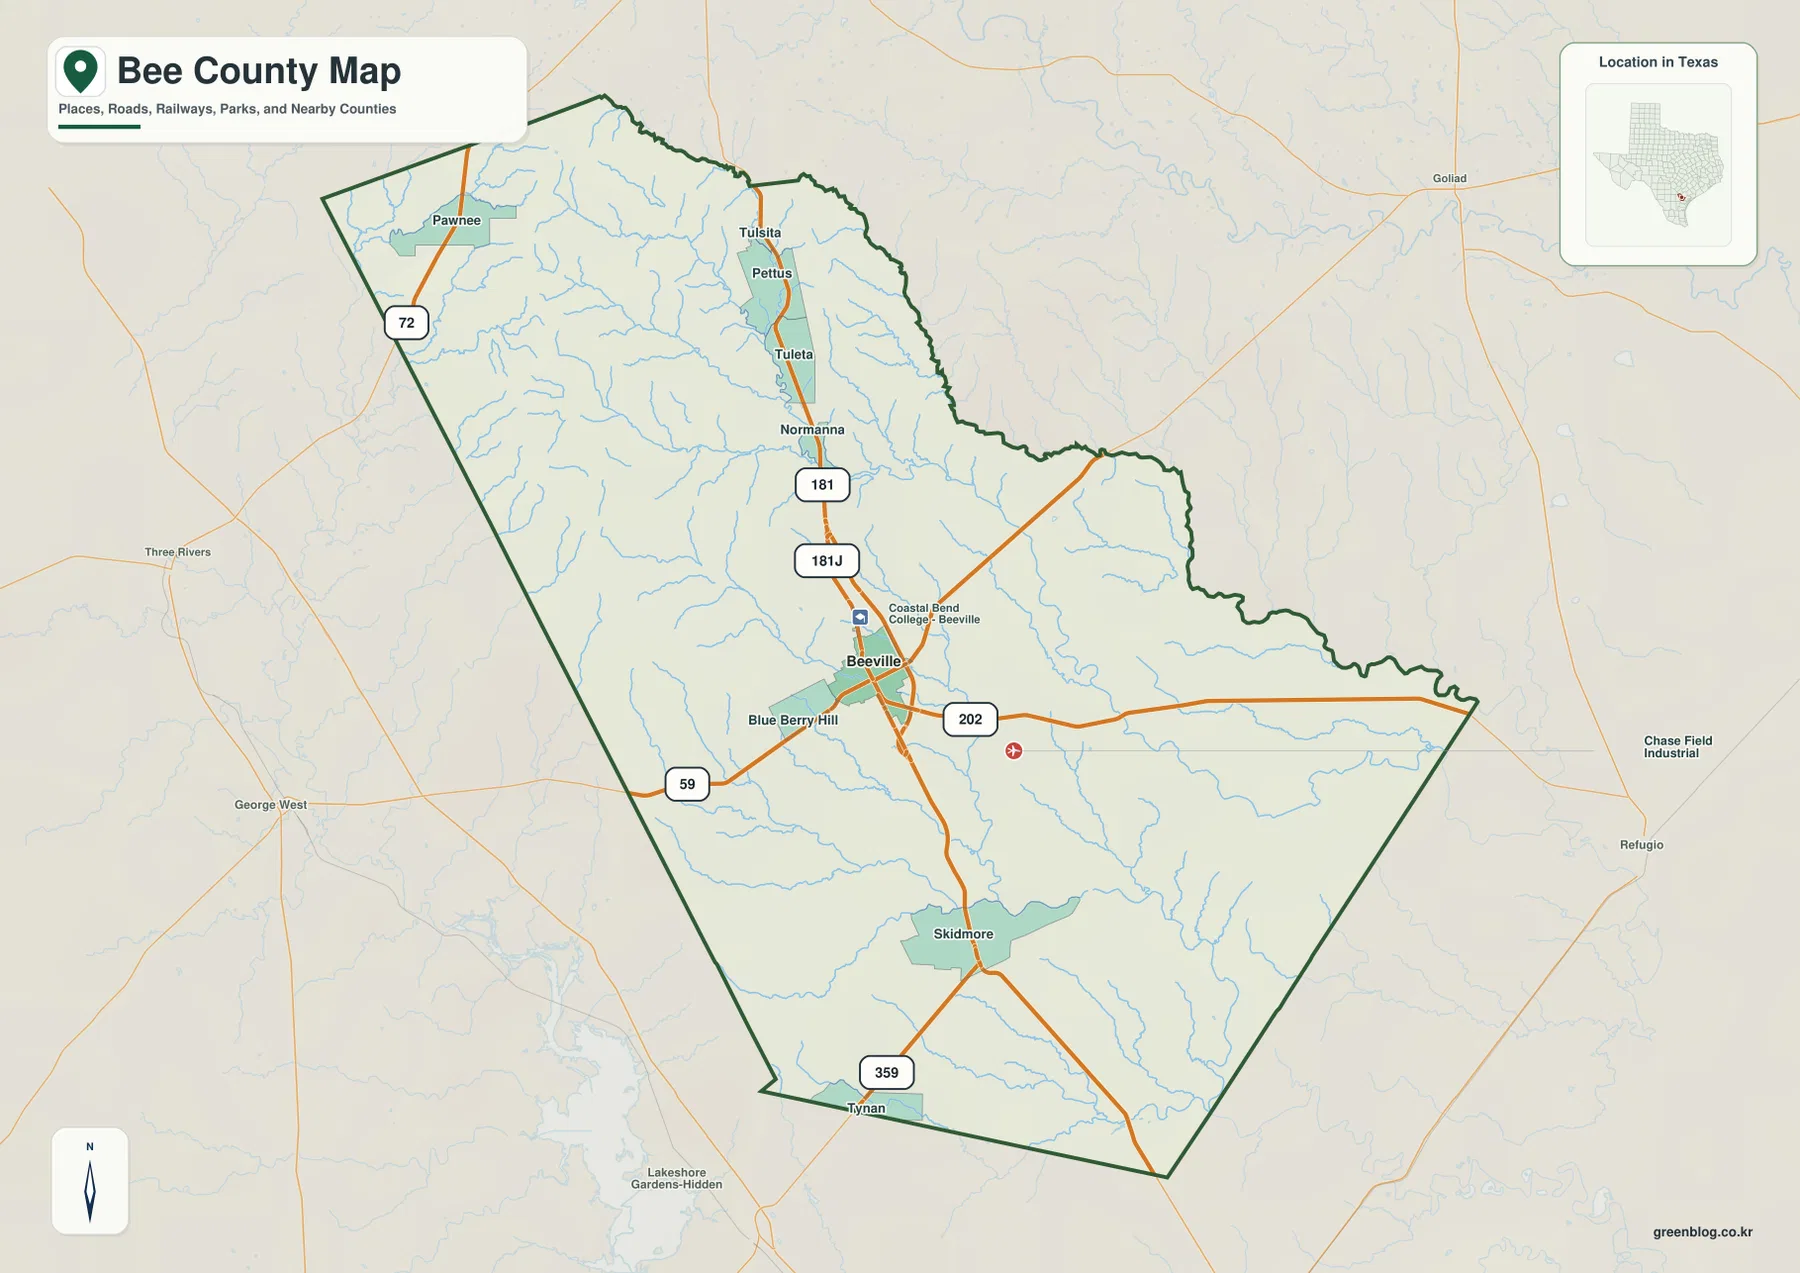
The general county map makes Beeville the easiest place to start. Roads converge around the city, and several named communities line up north and south of it. Moving north from Beeville, the map labels Normanna, Tuleta, Pettus, and farther northwest Pawnee. South of Beeville, Skidmore and Tynan provide two more anchors near the lower half of the county. Blue Berry Hill is marked immediately west of Beeville, giving another local reference point close to the county seat.
This distribution matters because the county is not represented as a single continuous urban area. Large parts of the boundary contain streams and lightly labeled land between communities. The most detailed road concentration is around Beeville, while the outer portions of the county are easier to understand by following highways, creeks, and the county line. Coastal Bend College–Beeville is also labeled on the general map, reinforcing Beeville’s role as a recognizable center without turning the map into a street-level guide.
The county outline itself is irregular along much of the north and east, while the southern and western edges are more angular. That shape is useful when matching this map with surrounding-county maps. It also helps when printing the page for a class or reference binder because the labeled communities can be placed against a boundary that is distinctive enough to recognize at a glance.
Why the ranked city map shows only Beeville
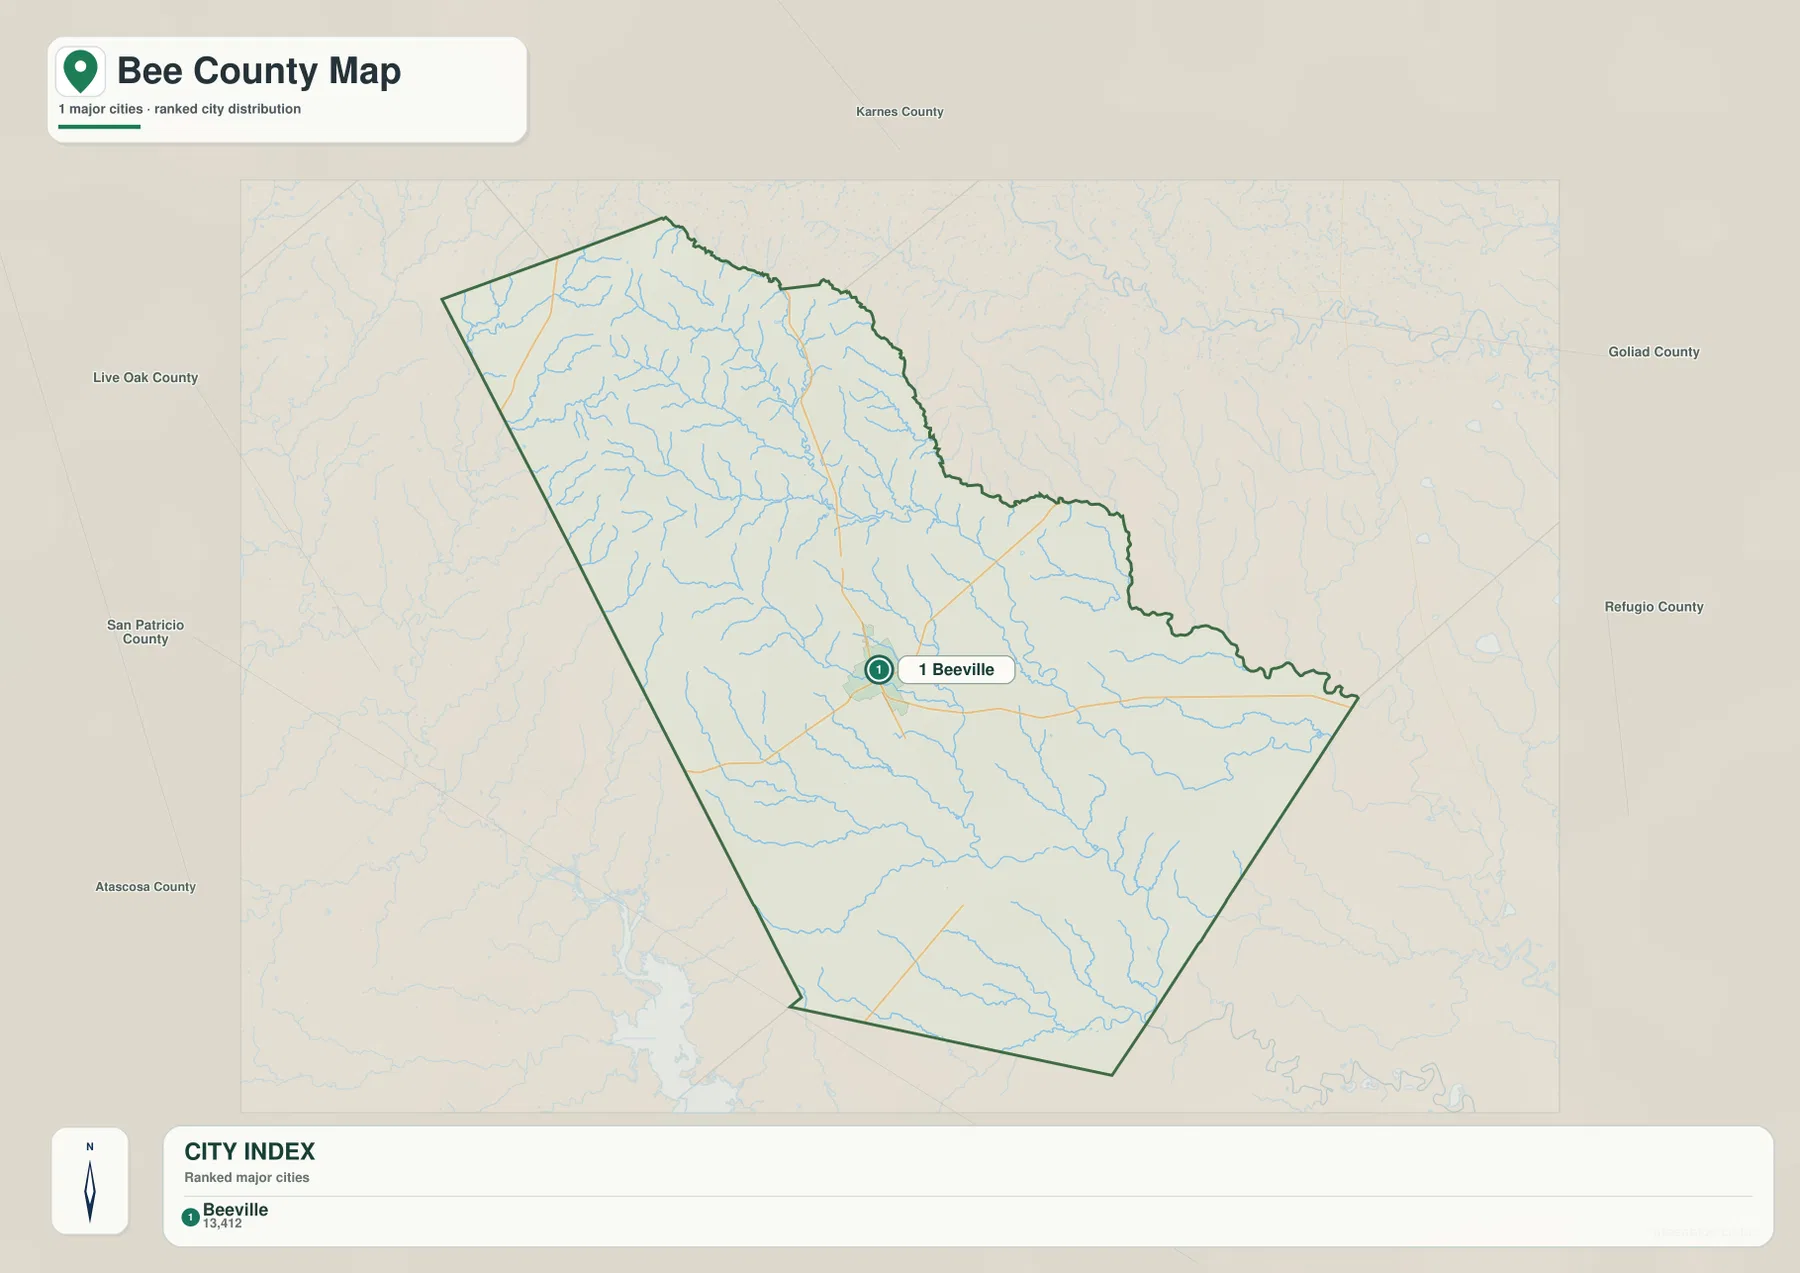
The city map is intentionally much simpler than the general county map. Its ranked city index contains one entry: Beeville, shown as number 1 with a displayed value of 13,412. That does not mean the other communities disappear from Bee County. It means that, under the ranking used for this map, only Beeville is included as a major city while places such as Pettus, Skidmore, and Tynan remain better suited to the general county map.
Because there is only one ranked city, there are no city-to-city connector lines or straight-line distance labels to interpret. The map instead emphasizes where Beeville sits inside the county. It is placed near the middle of the outline, with Karnes County to the north, Goliad County to the northeast, Refugio County to the east, Live Oak County to the west, and San Patricio County to the south.
This version is useful when the question is simply, ‘Which city functions as the main urban reference on this map?’ For locating smaller named places, the general county map is the better choice. Using the two maps for different questions avoids the misleading impression that a simpler city layer contains every settlement in the county.
US 181 organizes the county while other highways fan out from Beeville
US 181 is the strongest north-south line on the supplied road map. It comes down through the Pettus–Tuleta–Normanna side of the county, reaches Beeville, and continues south toward Skidmore. That one route makes it possible to orient several communities without first learning every local road. Once Beeville is found, the other labeled highways explain the east-west and outer-county directions.
US 59 approaches Beeville from the west, while SH 202 runs eastward from the Beeville area across the eastern half of Bee County. SH 72 is labeled near Pawnee in the northwest. SH 359 appears near Tynan in the south. Together these labels give the map a practical reading order: use US 181 for the central north-south chain, then use the numbered routes to branch toward Pawnee, the western edge, the eastern boundary, or Tynan.
The map should not be treated as a live navigation service. It is better for understanding where communities and major routes sit relative to one another. Current closures, lane conditions, turn restrictions, and detailed local access can change, so driving decisions should be checked with up-to-date transportation information. For geographic orientation, however, the road pattern explains why Beeville stands out so clearly in the county.
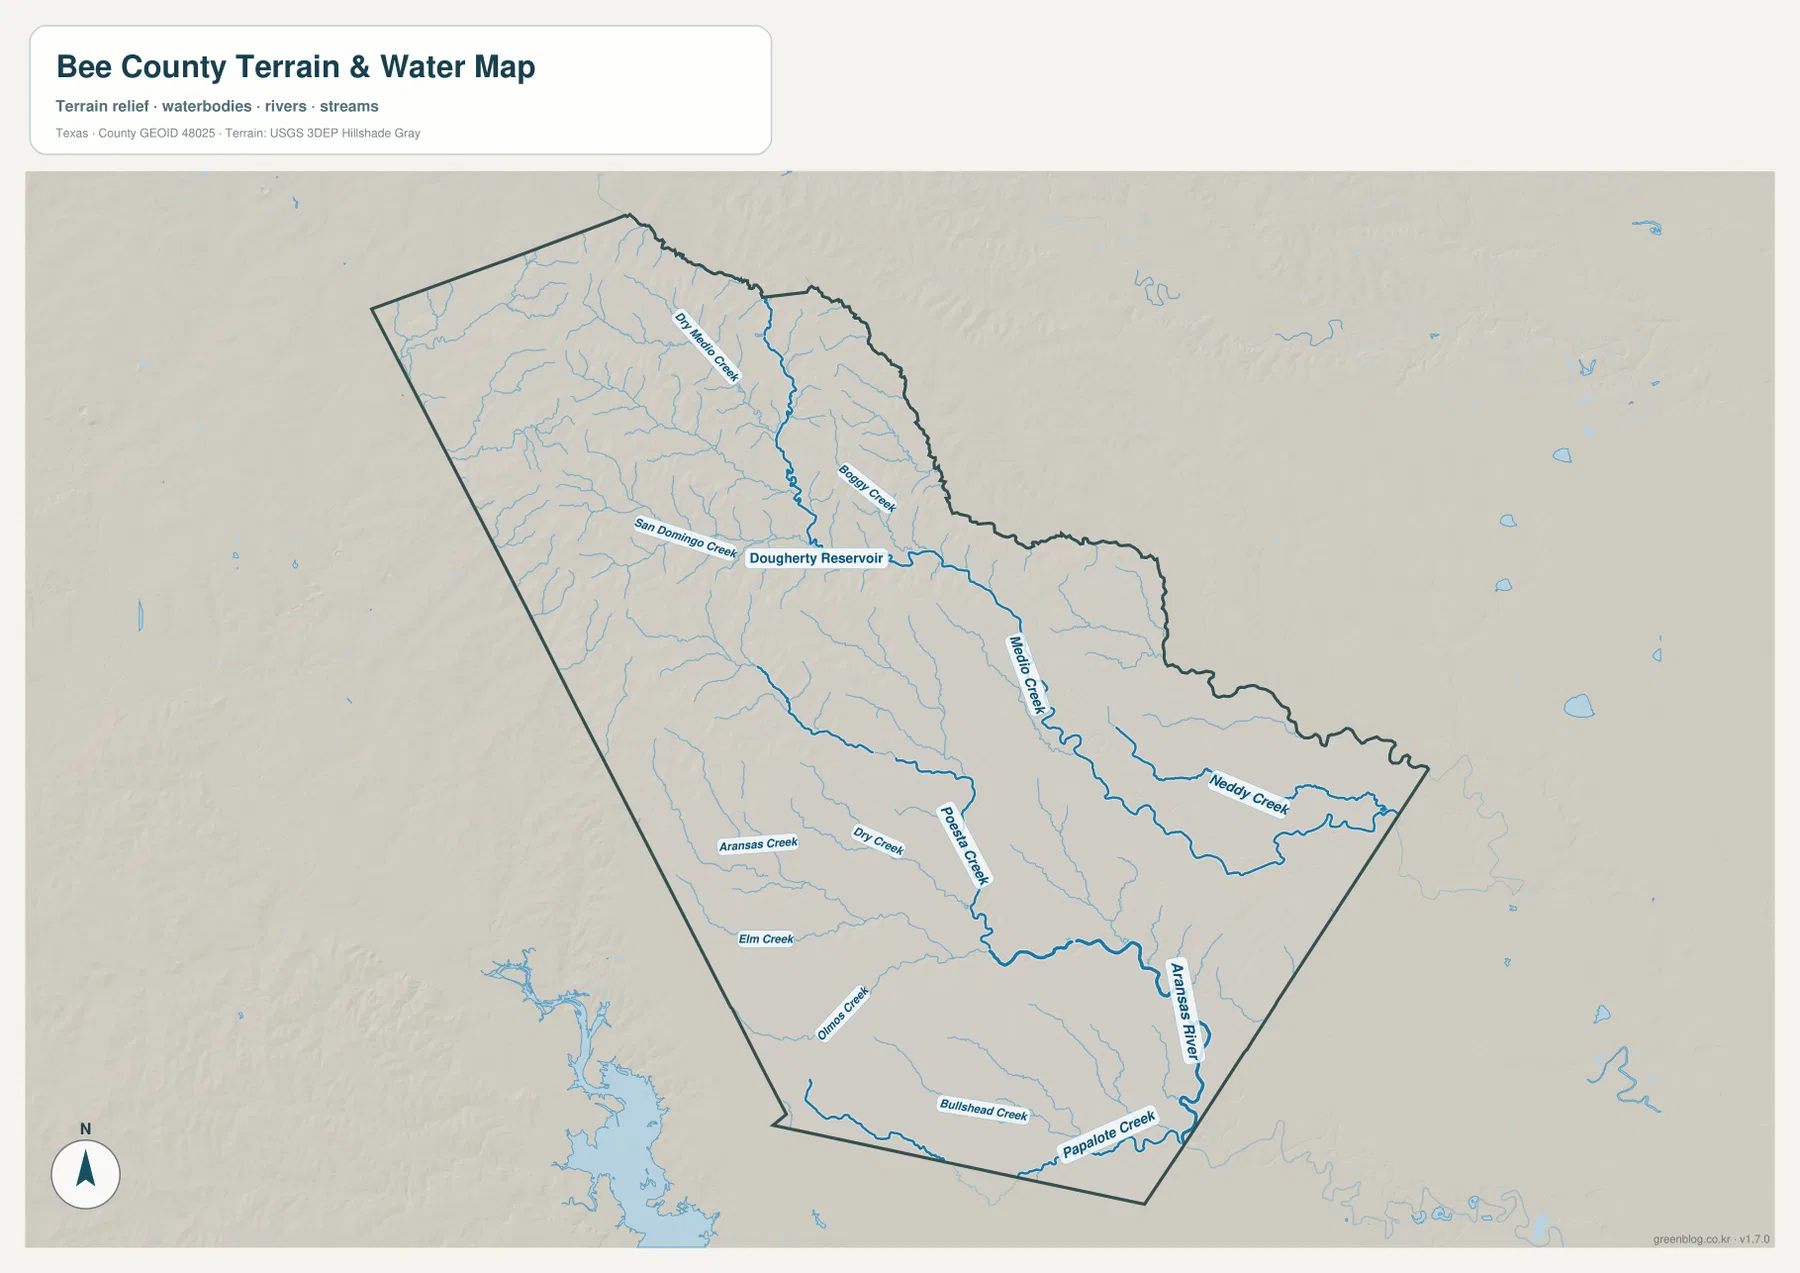
The water map reveals a network of creeks feeding the Aransas side
Bee County looks quite different when the road labels are removed and water features are emphasized. The Aransas River is labeled in the southeastern part of the county, with Papalote Creek and Bullhead Creek approaching that lower drainage area. Across the middle and east, Medio Creek and Neddy Creek are prominent. Farther south and west, the map names Poesta Creek, Dry Creek, Aransas Creek, Elm Creek, and Olmos Creek among the many smaller channels.
The northern half has its own set of named features. Dry Medio Creek runs through the upper part of the county, and San Domingo Creek is labeled near Dougherty Reservoir. The reservoir is shown as one feature within a broader drainage network rather than as a dominant countywide lake. That distinction is helpful because it keeps the focus on how numerous creeks cross the county rather than suggesting that one large water body defines Bee County.
This map is a hydrographic reference, not a flood map. The presence of a blue line does not establish flood frequency, navigability, legal access, or a property boundary. Its value here is positional: readers can see which waterways are north or south of Beeville, how the named creeks occupy different parts of the county, and where the Aransas River appears near the southeastern side.
Elevation falls from the northwest toward the southeast
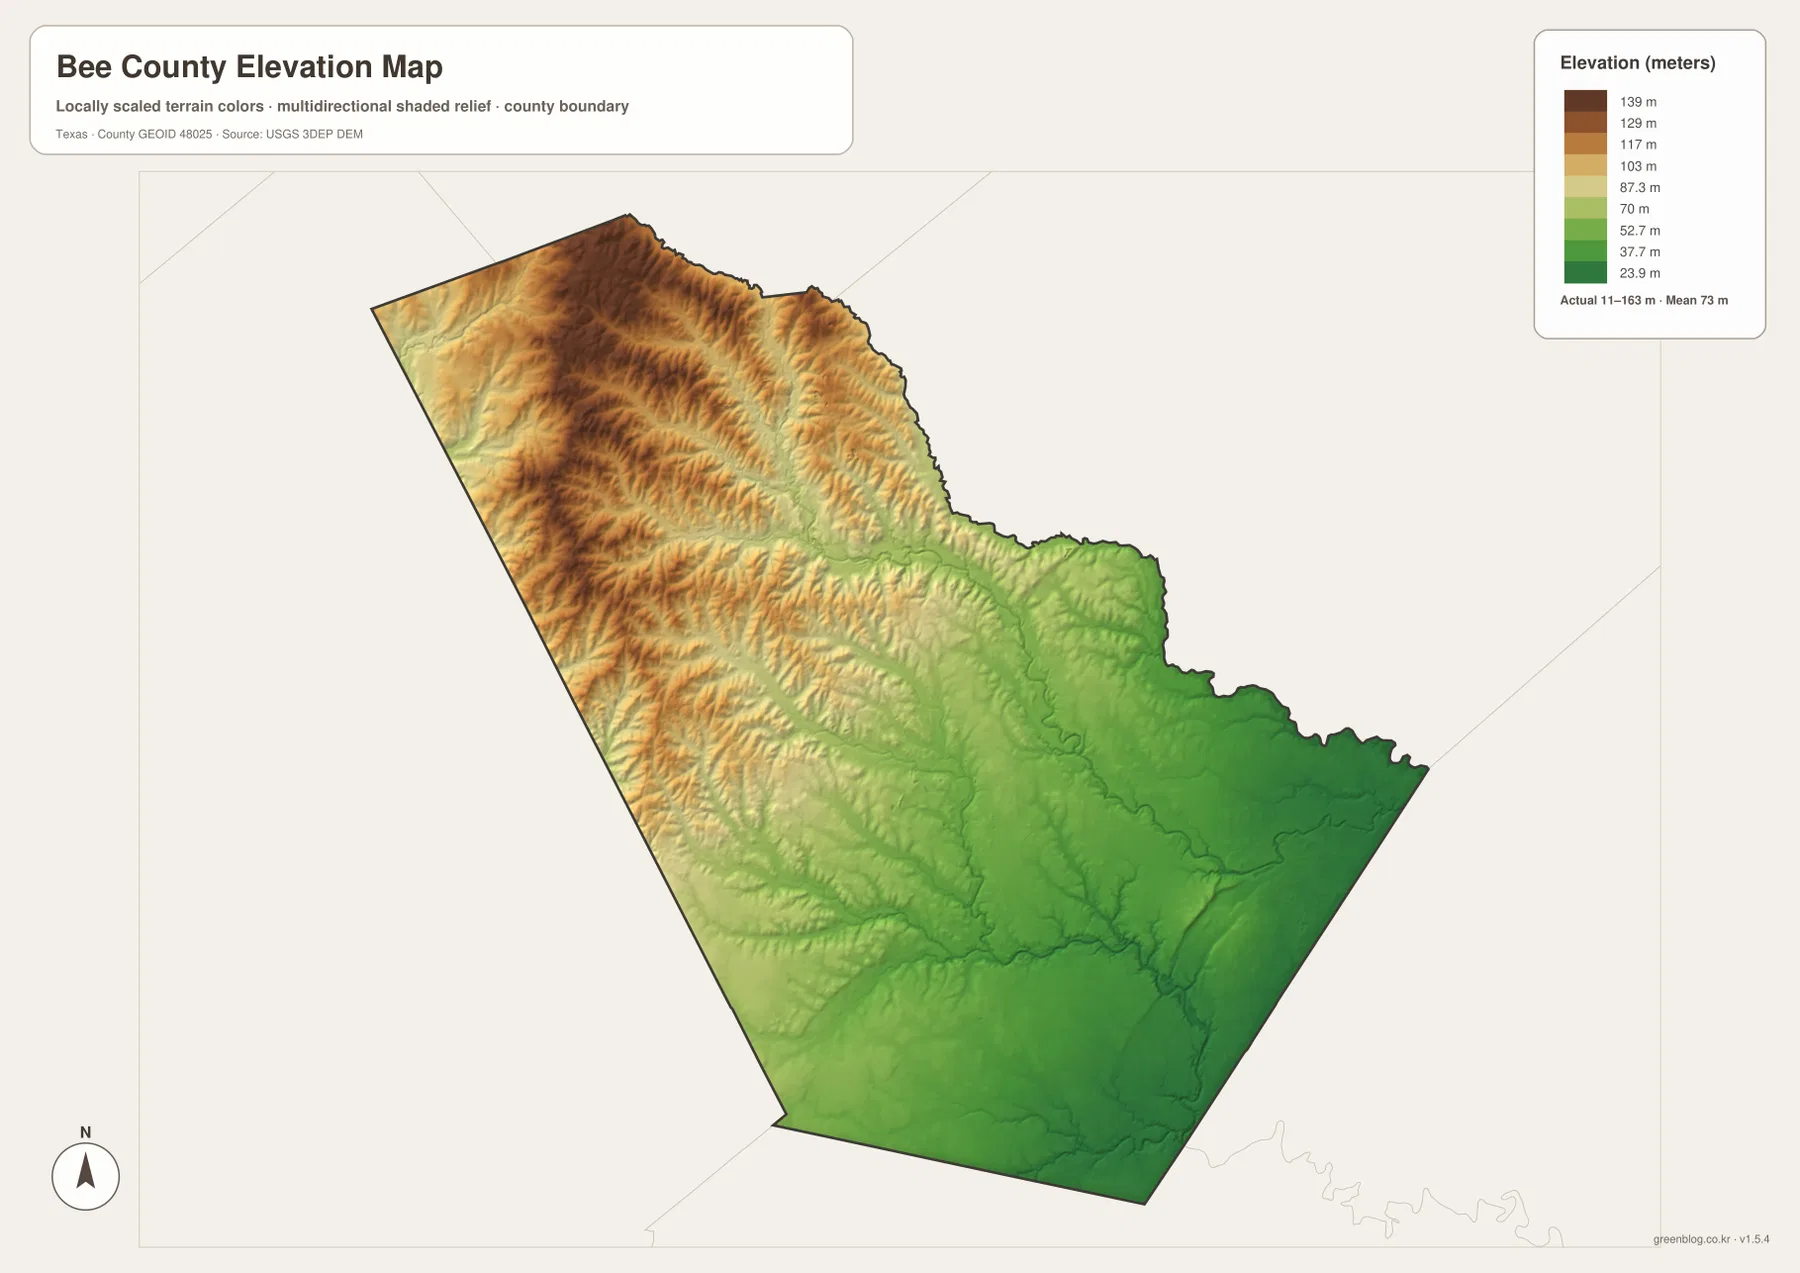
The elevation map adds a clear directional pattern that is easy to miss on the road map. Its legend reports an actual range of about 11 to 163 meters and a mean of 73 meters. Browns and warmer tones occupy much of the northwest and western side, while lower green tones spread across the eastern and southeastern portions of the county.
Bee County therefore should not be described as perfectly level even though it lacks the dramatic relief of a mountain county. The northwest contains visibly higher ridges and rolling ground, and the terrain becomes lower toward the Aransas side. When the elevation and water maps are compared, the creek network fits naturally into this broader change in height: many channels descend away from the higher northwest and continue across the lower central and southeastern landscape.
The shaded surface is generalized for county-scale viewing. It is useful for identifying relative highs and lows, but it is not survey-grade measurement for a parcel, road project, building site, or engineering decision. Those uses require more detailed elevation or field-survey data. For a regional map page, the 11–163 meter range and the northwest-to-southeast contrast provide the right level of interpretation.
The surrounding counties explain where Bee County routes lead
The city map includes neighboring county names outside the Bee County boundary, and those labels make the road directions easier to understand. Karnes lies across the north, Goliad is to the northeast, Refugio appears to the east, Live Oak is to the west, and San Patricio is to the south. These names provide a regional orientation without changing the Bee County boundary itself.
This context is especially useful for readers who know South Texas by counties rather than by individual creeks. A road leaving the Bee County outline can be followed toward the county name printed beyond the boundary, while a water feature can be compared with the lower terrain seen on the elevation map. For exact legal boundaries, the county outline on this page should be checked against official Census boundary data rather than used as a substitute for a legal survey.
Choose the map by the question, then use the full JPG set when needed
The four maps are designed to answer different practical questions without forcing every label onto one crowded image. The general map is best when you need Beeville, Pettus, Skidmore, Pawnee, Tynan, highways, and county shape in the same view. The ranked city map strips that detail away and makes Beeville the single focal city. The water map is the better reference for Aransas River tributaries and Dougherty Reservoir, while the elevation map shows why the northwest and southeast do not have the same terrain.
For classroom work, one useful sequence is to mark Beeville first, trace US 181 north and south, then switch to the water map and find Medio Creek, Poesta Creek, and the Aransas River. The elevation layer can be used last to explain why the drainage pattern is associated with a county that becomes lower toward the southeast. For general travel planning or county comparison, the road-and-place map is usually the quickest starting point.
The downloadable archive contains the original high-resolution JPG version of each map, rather than a screenshot of the page preview. That makes the set more suitable for A3 printing, personal reference sheets, teaching materials, or side-by-side county comparisons. The maps remain reference products: official legal, engineering, flood, and real-time transportation decisions should rely on the appropriate current agency source.
Frequently Asked Questions
Which map is best for finding Pettus, Skidmore, Pawnee, and Tynan?
Use the general county map. It includes the smaller named communities along with Beeville and the numbered highways. Start at Beeville, follow US 181 north toward Normanna, Tuleta, and Pettus, then south toward Skidmore; Pawnee and Tynan can be placed with SH 72 and SH 359. The ranked city map is intentionally simpler and lists only Beeville.
What is the main elevation pattern in Bee County?
The supplied elevation map reports an actual range of about 11–163 meters with a mean of 73 meters. The northwest and west are visibly higher, while the eastern and southeastern portions are lower. The change is moderate rather than mountainous, but it is strong enough to stand out when the county is viewed as a whole.
Can the water map be used to determine flood zones or property boundaries?
No. It is a reference map for the location of named water features such as the Aransas River, Medio Creek, Poesta Creek, Neddy Creek, and Dougherty Reservoir. Flood hazards, parcel boundaries, access rights, and engineering decisions require the relevant current official datasets and should not be inferred from this illustration.
Map File Information
The ZIP contains four high-resolution A3 JPG files for Bee County: the county map, ranked city map, water map, and elevation map.
- File Type: JPG
Related Maps
- Refugio County Texas map
- San Patricio County Texas map
- Victoria County Texas map
- Atascosa County Texas map
- Wilson County Texas map
Sources and references
The map set can be checked against the following official and county-specific resources for boundary, water, elevation, and local background information.
- Bee County official website — county government and local public information.
- Texas State Historical Association: Bee County — county history and regional background.
- U.S. Census Bureau TIGER/Line Shapefiles — official geographic boundary and feature data.
- USGS National Hydrography — official hydrography reference data.
- USGS 3D Elevation Program — elevation data and program information.
Green Map creates custom-edited map images using open geographic data sources such as geoBoundaries, Natural Earth, OpenStreetMap, and government open data.
These maps are edited visual materials, not raw data files, and are provided for education, documents, presentations, and graphic reference.