Download the Bell County Texas Map files here as one ZIP containing four A3 high-resolution JPG maps. The set includes a county reference map, a city map, a terrain-and-water map, and an elevation map. Together they let you compare Killeen, Harker Heights, Nolanville, Belton, Temple, and Morgan’s Point Resort with Belton Lake, Stillhouse Hollow Lake, the Leon and Lampasas rivers, and the county’s broad change in elevation.
Bell County is easiest to understand when the major places are read as a sequence rather than as isolated labels. Killeen and Harker Heights form the prominent western cluster, Nolanville and Belton sit farther east, and Temple becomes the major reference point toward the northeastern side of the central urban belt. The reference map then adds smaller places such as Troy, Salado, Holland, Rogers, and Little River-Academy, while the water and elevation views explain what lies between those communities.
Table of Contents
From Killeen through Belton to Temple
The county reference map places Killeen near the western side of Bell County, with Harker Heights immediately to its east and Nolanville beyond it. Belton sits farther east near the center of the mapped road network, while Temple is positioned to the northeast. A route labeled 190 runs across much of this urban sequence. Around Belton, the north-south route marked 35 comes up from the Salado area, and Temple is surrounded by additional numbered routes including 36, 53, and 81.
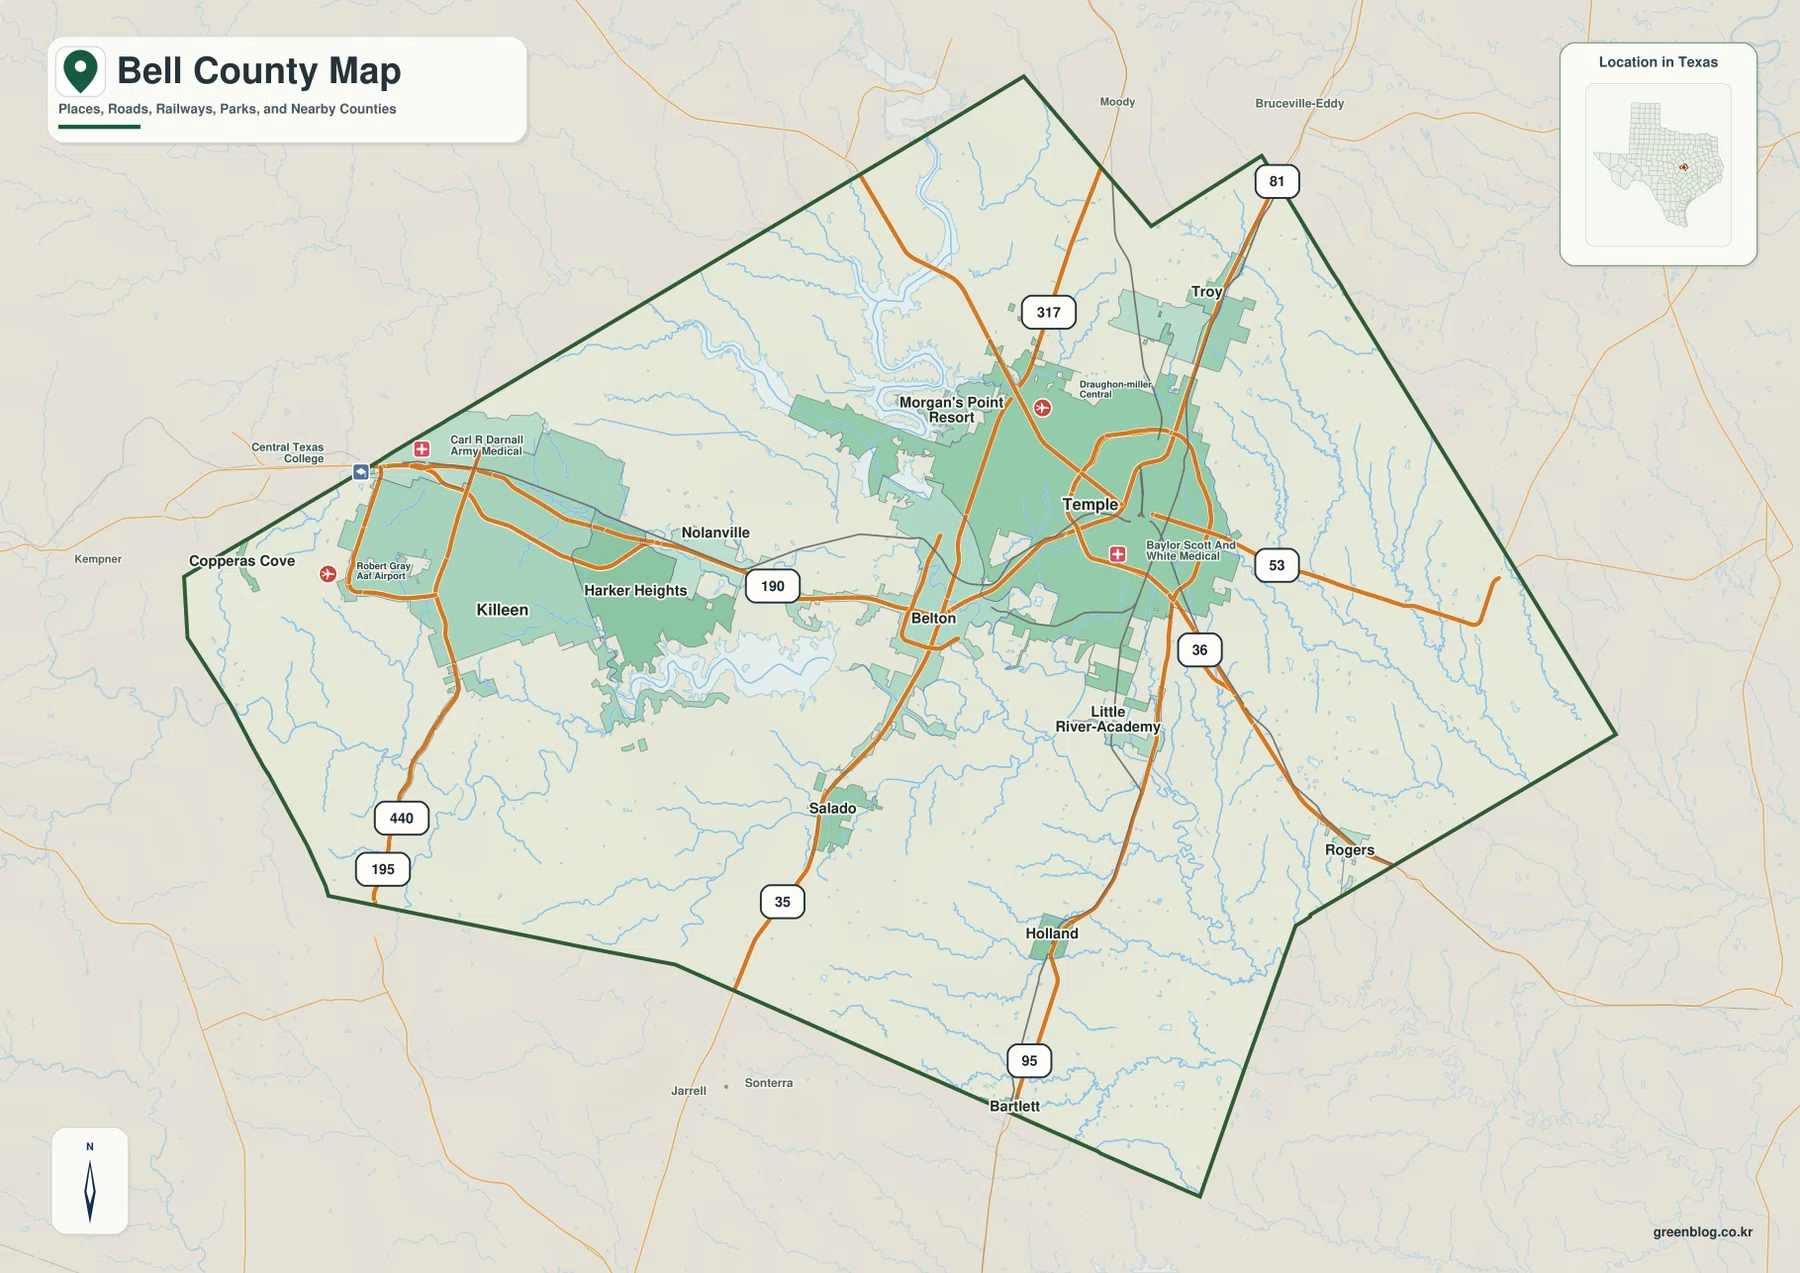
At the western edge, Copperas Cove appears close to the county line, and the map also labels Robert Gray AAF Airport and Carl R. Darnall Army Medical Center in that area. Moving east, the road network passes through Killeen, Harker Heights, and Nolanville before reaching Belton. North of Belton, Morgan’s Point Resort is shown near the southern side of Belton Lake. These labels make the reference map useful for practical orientation because roads, communities, water, and selected facilities can be seen in one view.
Temple has a different set of surrounding references. Troy is shown to the north, Little River-Academy lies to the southeast, and Rogers is farther east-southeast. South of the central urban area, Salado, Holland, and Bartlett provide additional orientation points. Instead of trying to memorize every road number at once, a first-time reader can locate Killeen, Belton, and Temple, then use the smaller towns to establish direction and distance within the county outline.
The six places highlighted by the city index
The city map removes much of the road detail and ranks six major places. Killeen is listed first with the value 158,159, followed by Temple at 89,602. Harker Heights appears third at 34,128, Belton fourth at 24,356, Nolanville fifth at 6,690, and Morgan’s Point Resort sixth at 4,750. Because those values are presented by the supplied map itself, they are best used here as map-index labels rather than as a claim about a separate current population dataset.
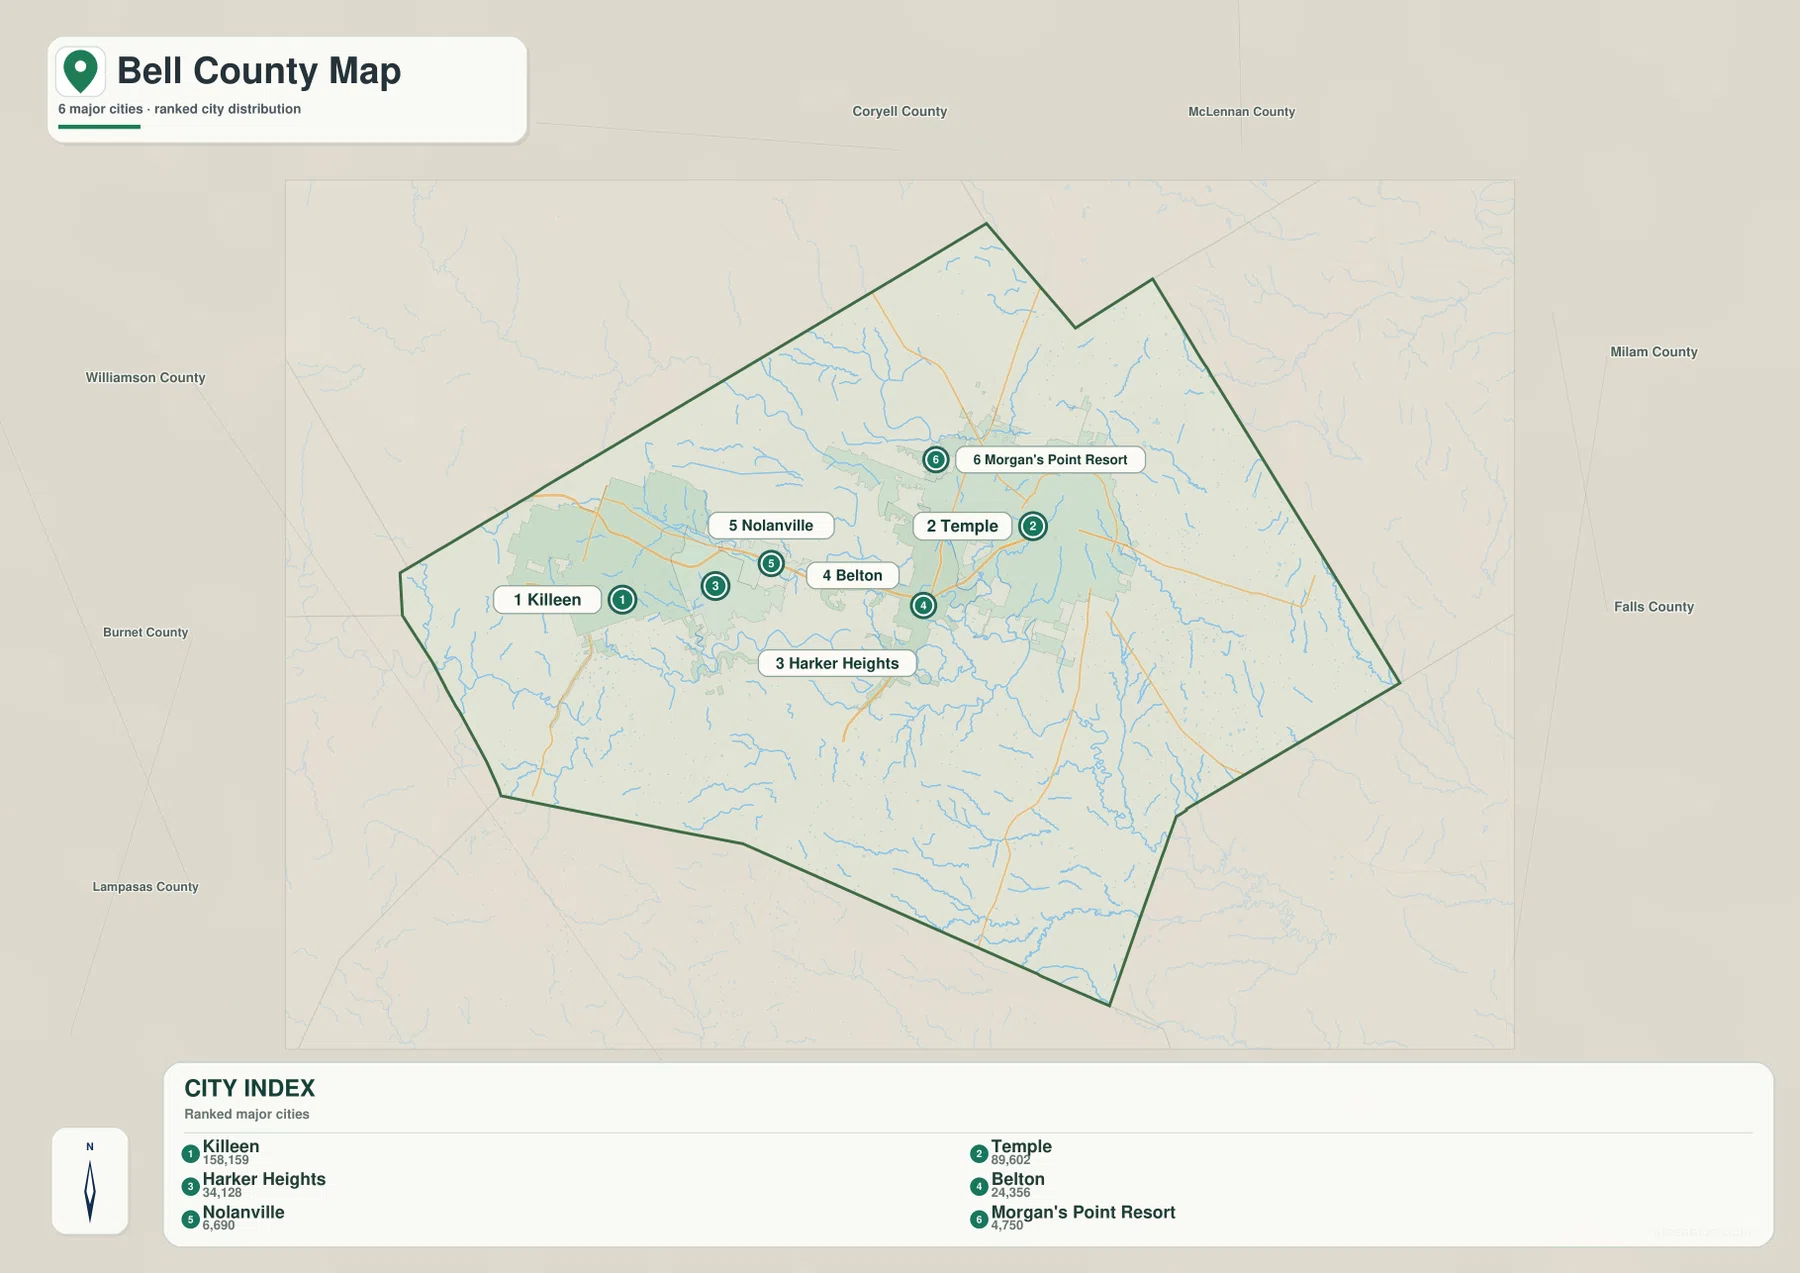
The pattern is strongly concentrated across the western and central parts of the county. Killeen and Harker Heights sit close together, Nolanville follows to the east, and Belton continues that chain toward Temple. Morgan’s Point Resort is separated to the north near the lake. This is a useful distinction because the county is not simply organized around one central city; the map shows several major communities forming a broad belt with different positions relative to roads and water.
Names of surrounding counties are printed outside the Bell County boundary, including Coryell, McLennan, Milam, Falls, Williamson, Burnet, and Lampasas. Their main value on this map is orientation: they show the wider setting without adding a dense road layer. The position of Killeen near the western side and Temple toward the northeast becomes easier to understand when the county outline is viewed together with those outside labels.
Belton Lake, Stillhouse Hollow Lake and the river network
The terrain-and-water map shifts attention from roads to drainage. Belton Lake dominates the north-central portion of the county and has a deeply indented shoreline where multiple valleys enter the reservoir. Stillhouse Hollow Lake is smaller and lies farther southwest. Between and around the two lakes, the map labels the Leon River, Lampasas River, Nolan Creek, and Salado Creek, giving the reader a clear set of water features that can be matched back to the city map.
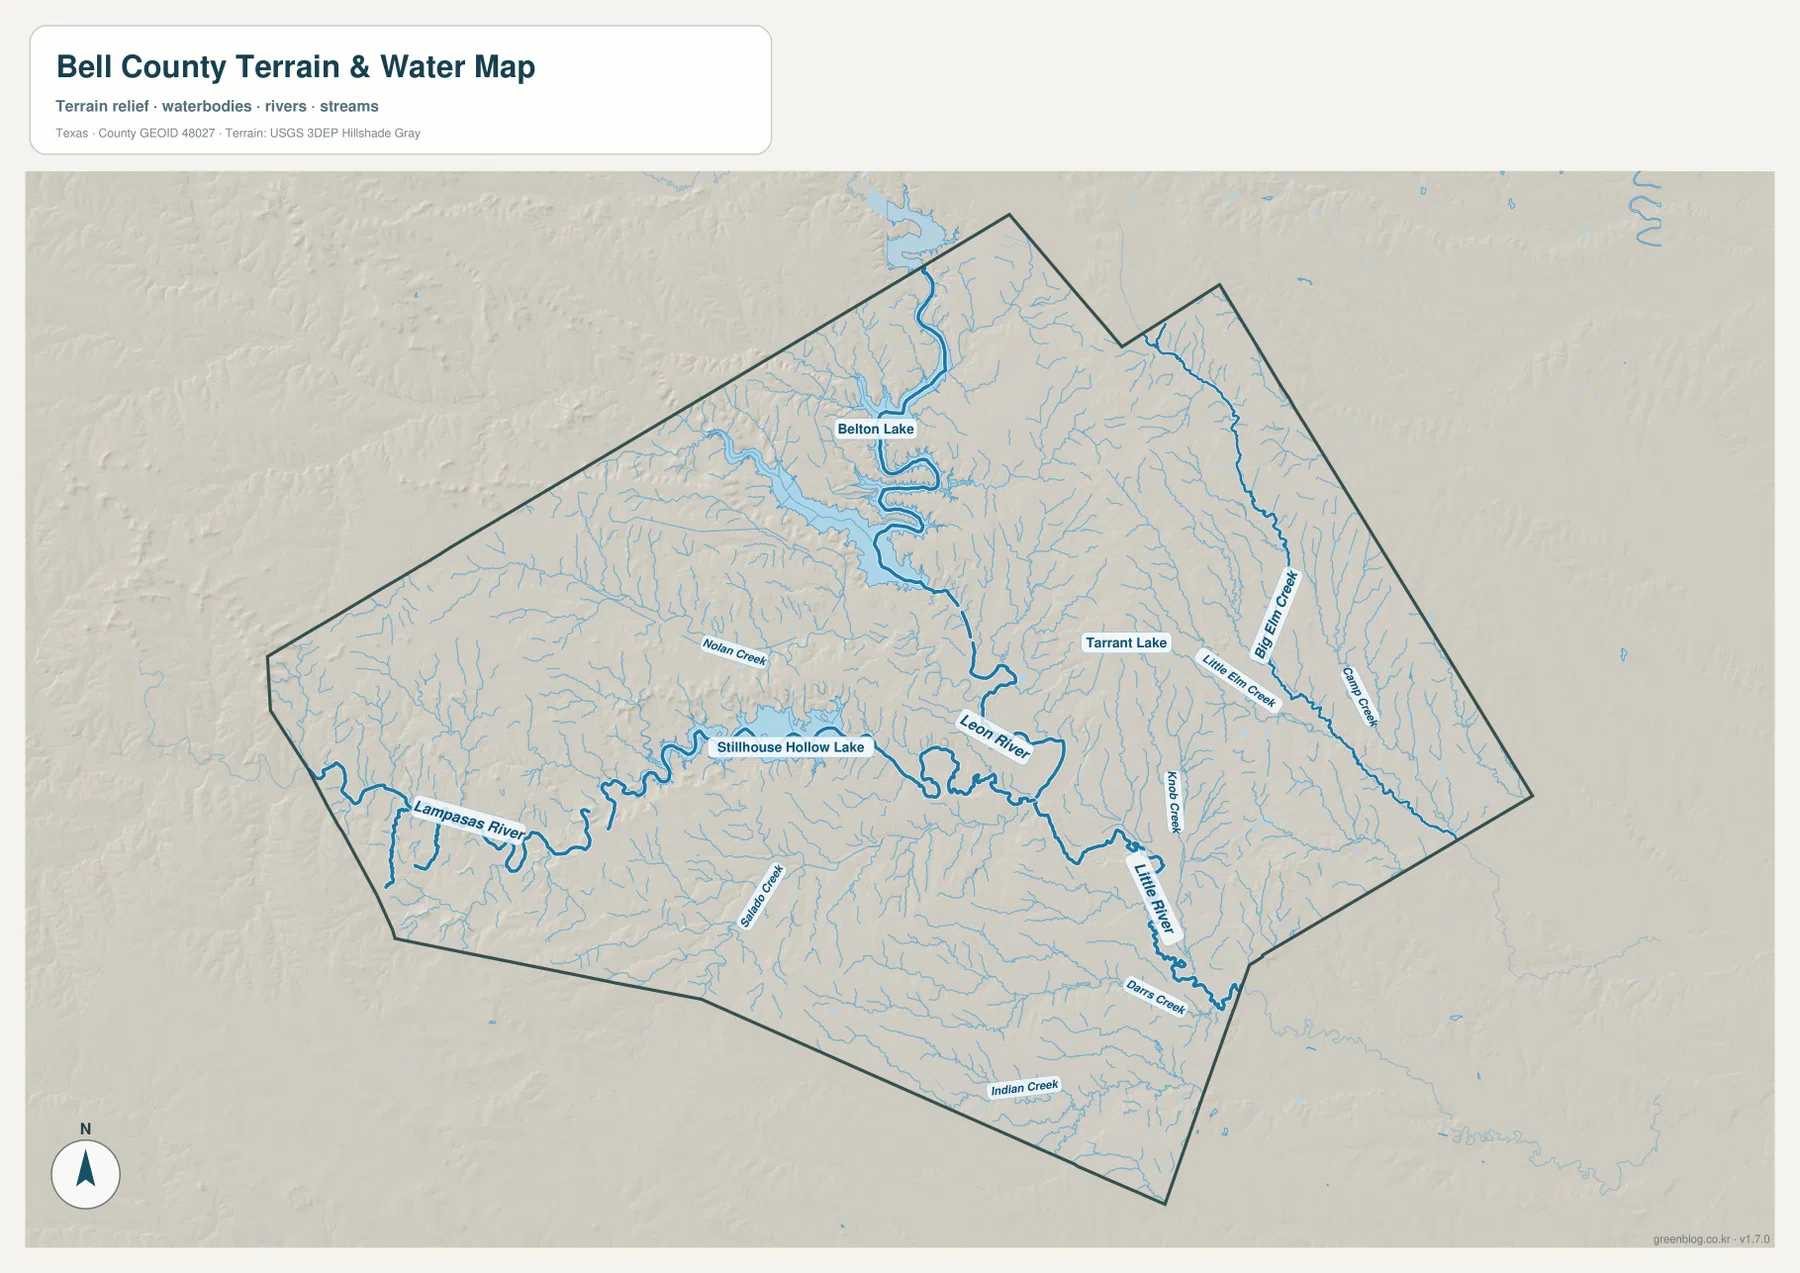
East of the central area, Big Elm Creek and Little Elm Creek form long, visible channels, with Pine Creek labeled farther to the east. The Little River runs through the southeastern part of the map and is joined by a network that includes Knob Creek and Darrs Creek. Indian Creek is labeled along the southern portion of the county. The abundance of named streams explains why the water map looks much more intricate than the general county map, even where the road map appears relatively open.
Tarrant Lake is labeled in the eastern interior and provides a useful example of scale. It is a small water body compared with Belton Lake and Stillhouse Hollow Lake, but the specialized water view still makes it easy to find. If a reader needs to locate a creek or small lake near a road or community, it helps to identify the large river or reservoir first and then trace the thinner tributary lines toward the target area.
This product is an overview map of named water features and terrain, not a navigation or flood-hazard chart. It can show where rivers, creeks, and lakes sit relative to one another, but it does not provide current flow, depth, flood probability, legal water boundaries, or survey-grade channel positions. Those questions require the appropriate official hydrologic or local records rather than an overview county map.
Elevation changes from western uplands to lower eastern valleys
The elevation map gives a numeric scale to the relief visible in the water map. Its legend states an actual elevation range of about 116 to 376 meters, with a mean of 204 meters. Lower areas are shown in green, while yellow, tan, and brown represent progressively higher ground. The western and northwestern parts of Bell County contain the broadest high-elevation colors, while the central and eastern parts contain larger areas of green.
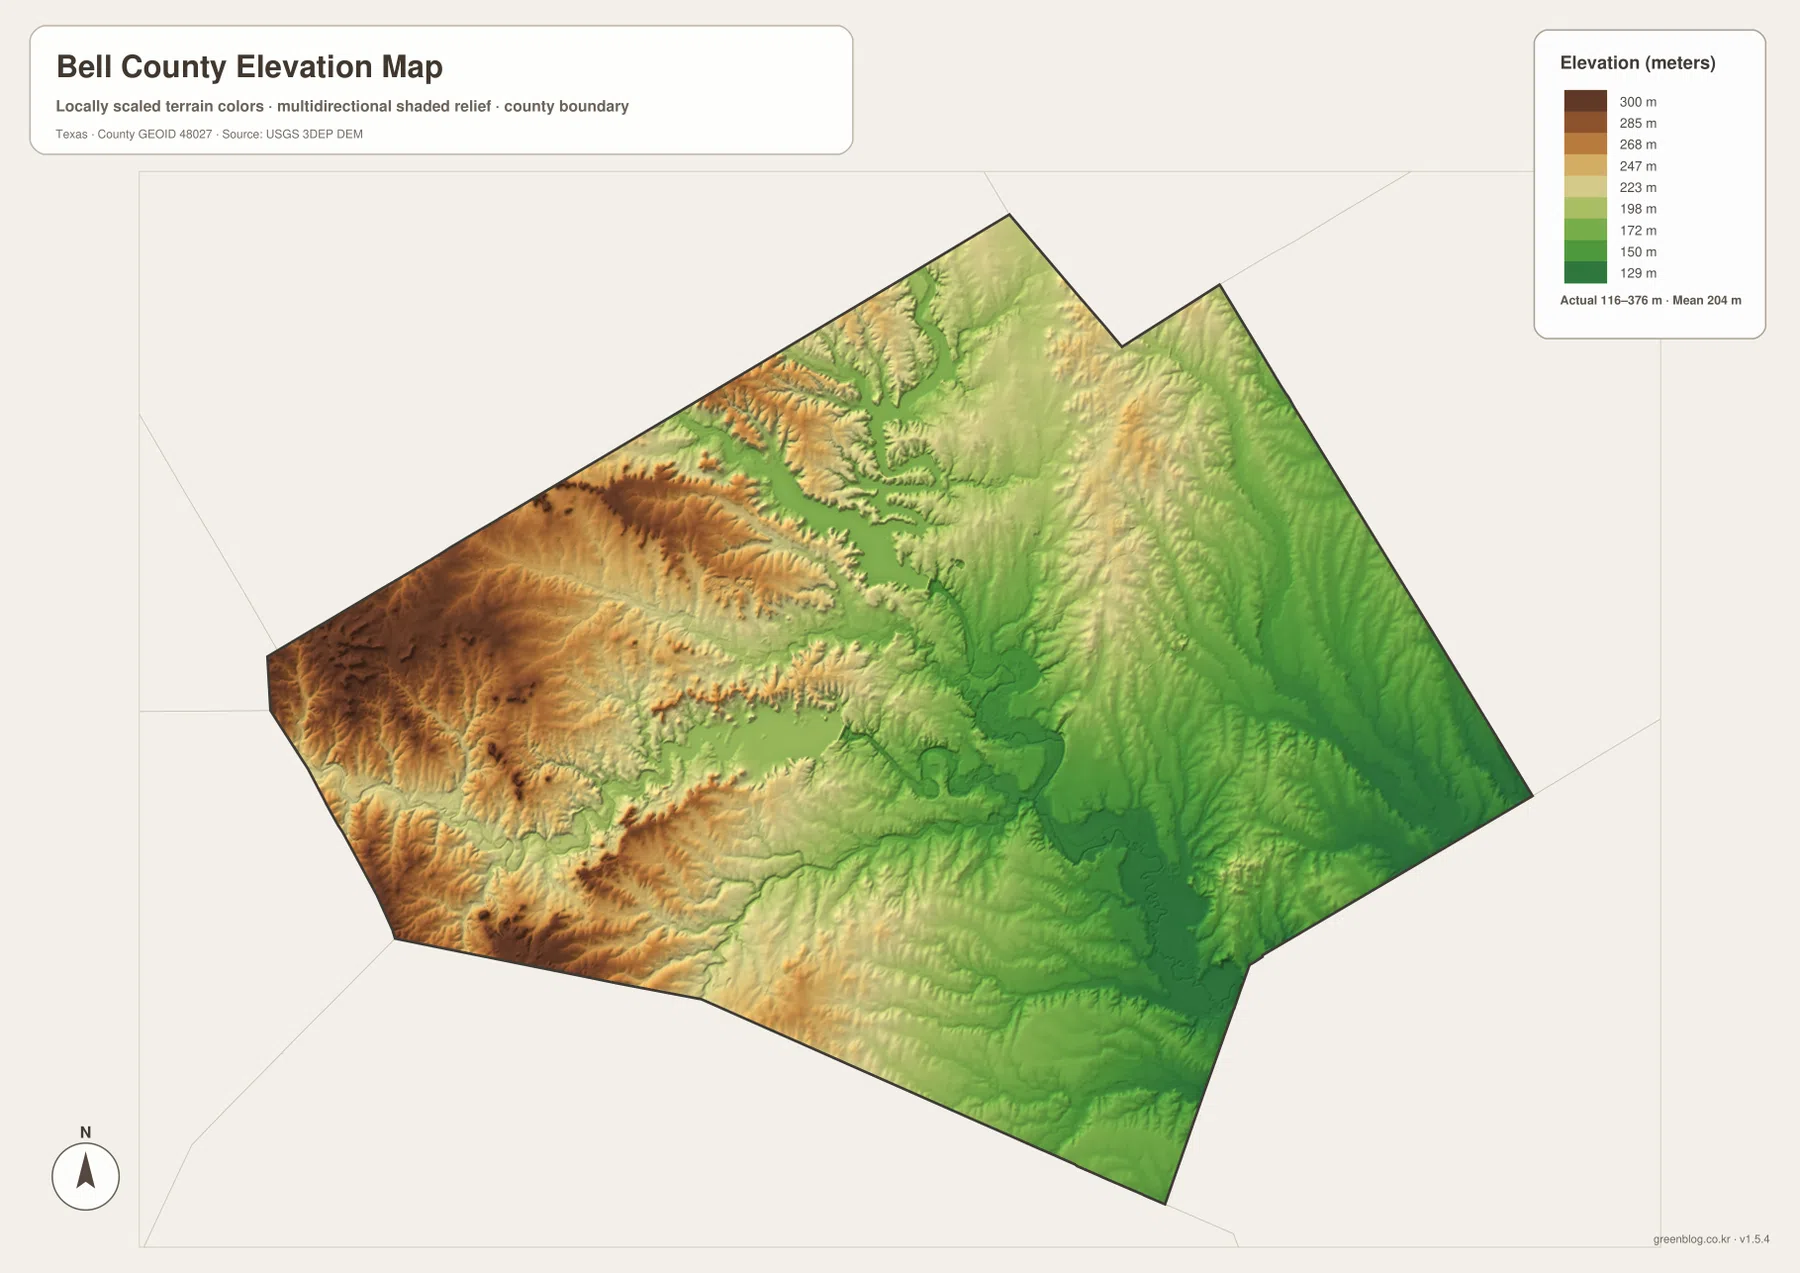
Low corridors can be seen around Belton Lake and along the branching valleys that feed it. Green terrain also follows the central and eastern river system, including the Leon and Little River areas. In contrast, the terrain west of the Killeen area and across parts of the southwest rises into yellow and brown. Looking back at the water map helps connect those green corridors with the rivers and reservoirs rather than treating the colors as isolated elevation patches.
The legend includes intermediate steps at 129, 150, 172, 198, 223, 247, 268, 285, and 300 meters. Those bands are useful for broad comparison, but they do not turn the map into a survey surface. A precise elevation for a parcel, building, construction site, or engineering project should be obtained from more detailed elevation data or field measurements.
What the four maps reveal when used together
Belton is a useful example of how the four views complement one another. The reference map shows Belton in relation to Nolanville, Temple, major roads, and Morgan’s Point Resort. The city map simplifies that information and places Belton fourth in the six-place index. The water map makes Belton Lake, the Leon River, and Nolan Creek easier to trace, while the elevation map shows the lower valleys surrounding those water features and the higher terrain farther west.
Killeen works differently as an orientation point. On the reference map it anchors the western urban area and connects directly with Harker Heights. The city map ranks it first. The water map shifts attention south and east toward the Lampasas River and Stillhouse Hollow Lake system, while the elevation map shows broader high ground to the west. That combination gives more context than a road-only map without requiring the reader to interpret every category at the same time.
Temple provides a third comparison. The county map gives it a dense group of numbered routes and nearby references such as Troy, Rogers, and Little River-Academy. The water view brings Big Elm Creek and Little Elm Creek into the picture, and the elevation view shows extensive lower terrain toward the eastern side. In other words, the same community can be read as a road junction, a ranked city, a location within a drainage network, and a point within the county’s terrain profile.
A practical reading order for first-time users
Start with Killeen, Belton, and Temple on the county map, then note Harker Heights and Nolanville between them. Next, locate Belton Lake in the north and Stillhouse Hollow Lake in the southwest. Adding Salado, Troy, Rogers, and Holland gives enough secondary reference points to understand the county outline without becoming distracted by every label.
After that, use the water map to find the Leon and Lampasas rivers, then trace the Little River and the eastern Big Elm and Little Elm creeks. Finish with the elevation map by comparing the brown western uplands with the green river valleys and eastern lowlands. This sequence moves from familiar map elements—places and roads—to water and relief, so each new layer has a geographic reference already established.
The maps also serve different print and classroom needs. The county map carries the richest mix of place names and roads. The city map is cleaner for explaining where the main communities sit. The terrain-and-water map is the best choice for tracing lakes and creeks, and the elevation map is the clearest graphic for comparing high western terrain with lower drainage corridors. The downloadable archive keeps all four versions together at high resolution.
Frequently Asked Questions
Which places are highlighted on the Bell County city map?
The supplied city index highlights Killeen, Temple, Harker Heights, Belton, Nolanville, and Morgan’s Point Resort. They form a strong west-to-central cluster, with Morgan’s Point Resort separated to the north near Belton Lake.
Which map is best for finding Belton Lake and Stillhouse Hollow Lake?
Use the terrain-and-water map. Belton Lake is the large north-central reservoir and Stillhouse Hollow Lake lies to the southwest. The same map also labels the Leon River, Lampasas River, Little River, Big Elm Creek, Little Elm Creek, and several smaller creeks.
What elevation range is shown for Bell County?
The supplied elevation map states an actual range of about 116 to 376 meters and a mean of 204 meters. Higher terrain is most prominent in the west, while many central and eastern river valleys appear at lower elevations.
Sources and Reference Data
The article is based on the four Bell County maps supplied in the attached package, including their place labels, water features, and elevation legend. For more detailed boundary, hydrography, or elevation work, the following official datasets provide appropriate source material.
- U.S. Census Bureau TIGER/Line Shapefiles — boundary, road, and related geographic files
- USGS National Hydrography — official hydrography resources for rivers, streams, and water bodies
- USGS 3D Elevation Program — elevation and terrain source data
Map File Information
The ZIP contains the four Bell County maps shown on this page as A3 high-resolution JPG files: the county reference map, city map, terrain-and-water map, and elevation map. Use the archive when you need larger images for printing, lessons, presentations, or side-by-side geographic comparison.
- Included Files: 4 A3 high-resolution JPG maps
Related Maps
- Williamson County Texas map
- San Saba County Texas map
- Travis County Texas map
- Robertson County Texas map
- Somervell County
Green Map creates custom-edited map images using open geographic data sources such as geoBoundaries, Natural Earth, OpenStreetMap, and government open data.
These maps are edited visual materials, not raw data files, and are provided for education, documents, presentations, and graphic reference.