A Robertson County Texas Map is easiest to understand when Franklin, Hearne, Calvert, and Bremond are treated as separate reference points rather than as one compact cluster. Robertson County stretches across a broad part of east-central Texas, with a winding river boundary on the west and a long eastern edge. The maps on this page show county boundaries, major roads, city positions, streams and small lakes, and the county’s elevation pattern. High-resolution JPG versions of the same maps are also available in one download for printing or document use.
The four views are useful for different questions without requiring the reader to learn GIS terminology. The county map provides the broadest orientation, including U.S. 79, U.S. 190, Franklin, Hearne, Calvert, and Bremond. The city-connections map simplifies those places around Hearne and labels straight-line distances to the other three towns. The terrain-and-water map adds Little Brazos River, several named creeks, lakes, and reservoirs, while the elevation map makes the contrast between the low southwestern river country and the higher central and northern hills easy to see.
Table of Contents
Franklin as the main reference point inside Robertson County
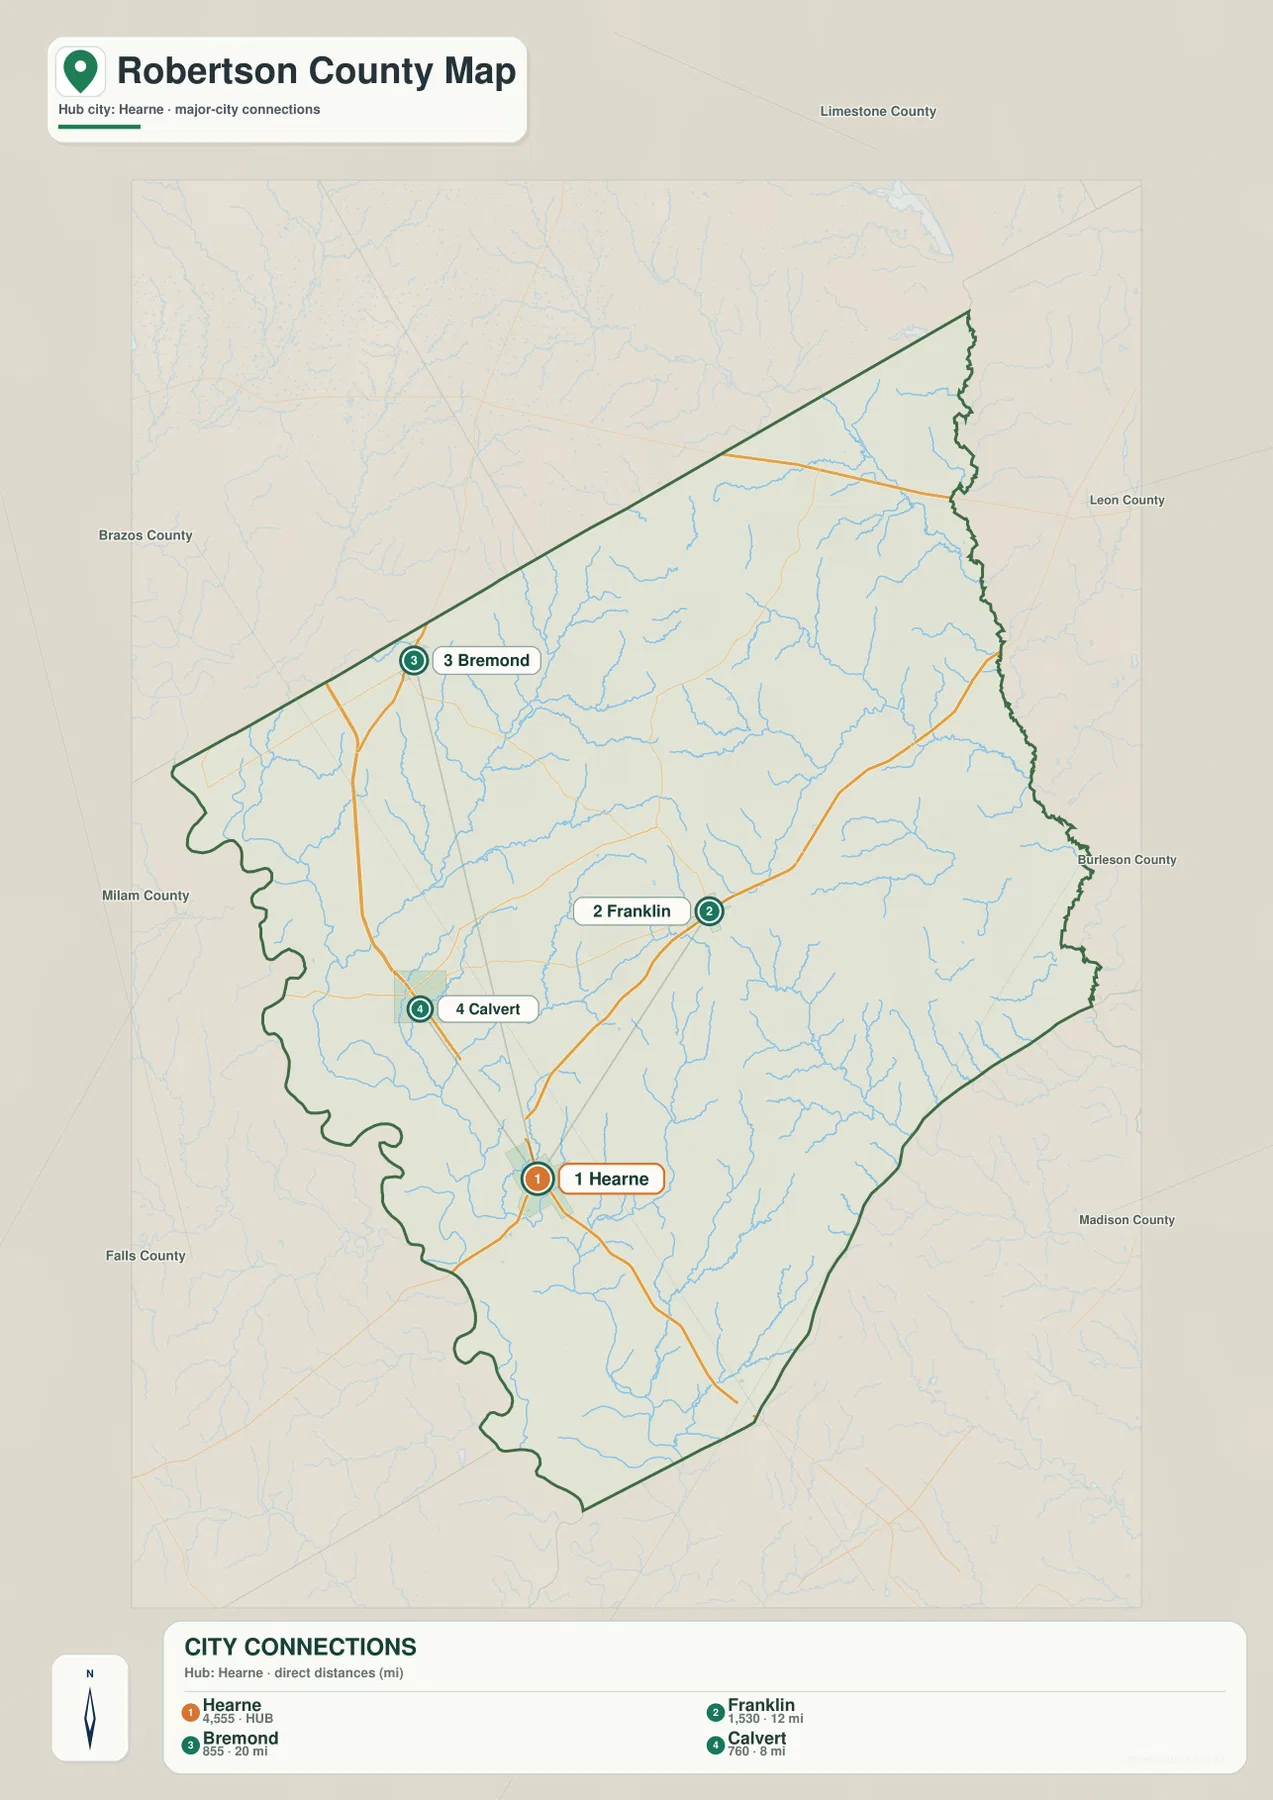
Franklin appears slightly east of the county’s center rather than at its geometric midpoint. As the county seat, it is a practical place to begin orienting the rest of the map. The county reference map also labels the Robertson County Courthouse to the east of Franklin. Hearne lies to the southwest, Calvert is northwest of Hearne, and Bremond is much farther north. Because these communities are spread across the western and central portions of the county, their arrangement says more about Robertson County than a simple list of town names would.
The outer boundary is irregular in several places. On the west, the line bends repeatedly with the river corridor instead of following a simple straight county line. The eastern edge is also long and uneven, while portions of the northern and southeastern boundaries are comparatively straight. That shape matters when reading the map because a place that looks close in a straight line may still sit on the opposite side of a river, a drainage corridor, or a long county edge. Looking at the boundary together with roads and towns gives a more useful picture than looking at the outline alone.
Hearne, Calvert, Franklin, and Bremond form a widely spaced town pattern
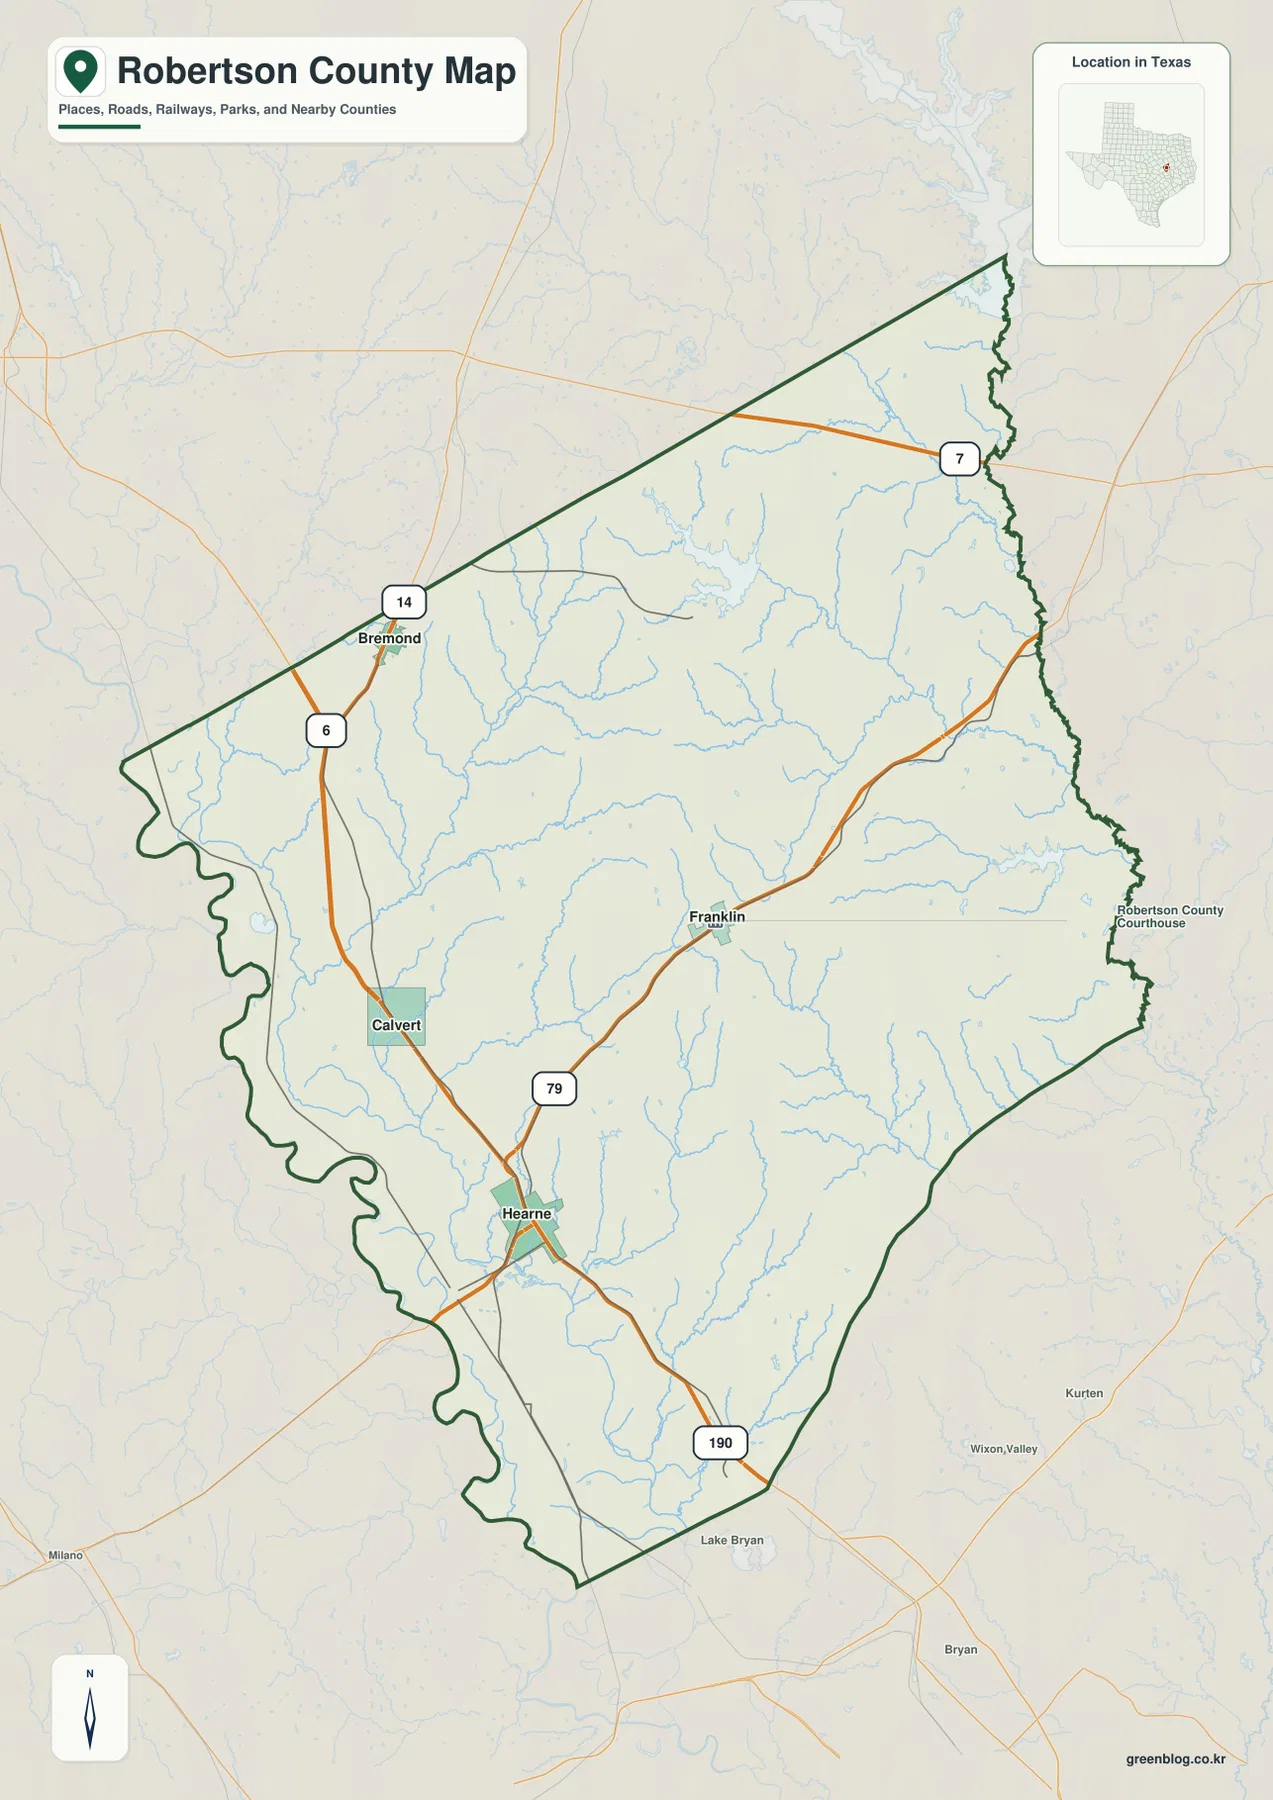
The city-connections map uses Hearne as its hub and gives direct distances to three other mapped communities. Franklin is labeled about 12 miles away, Calvert about 8 miles, and Bremond about 20 miles. These are straight-line distances between the mapped points, not driving distances along the road network. They are best used to compare direction and relative spacing. Franklin lies east-northeast of Hearne, Calvert is to the north-northwest, and Bremond continues much farther north, making the county’s settlement pattern look elongated rather than concentrated around one center.
The existing county material describes Hearne and Calvert in connection with rail and agricultural shipping history, Franklin as the administrative and service center, and Bremond as a small center for the northern farm district. Those descriptions help explain why the towns are useful reference points, but the supplied map is not a historical or economic map. Its main value is present-day geographic orientation. The rail line drawn near Hearne and Calvert can be compared with the road network, while Franklin and Bremond help define the central and northern parts of the county.
U.S. 79 and U.S. 190 provide two clear road references
U.S. 79 is one of the most useful road references on the map because it connects the southwestern part of the county with Franklin. It passes through the Hearne area and continues northeast toward Franklin, making the relationship between those two places immediately visible. U.S. 190 crosses the southern portion of the county and provides an east-west reference closer to the lower county boundary. Additional route shields, including 6 and 14 in the west and northwest and 7 toward the northeast, help locate Calvert, Bremond, and the northern side without relying on the two U.S. highways alone.
Rail lines are also drawn on the general county map. Around Hearne and Calvert, road and rail corridors appear close together, which makes the western side especially easy to compare. The map should not be treated as a navigation service, however. It does not show live road closures, current travel times, or detailed turn-by-turn access. Its purpose is to show how the major routes cross the county, which towns sit near them, and how those routes fit between the river boundaries and the interior terrain.
Little Brazos River and a network of creeks shape the western and interior map
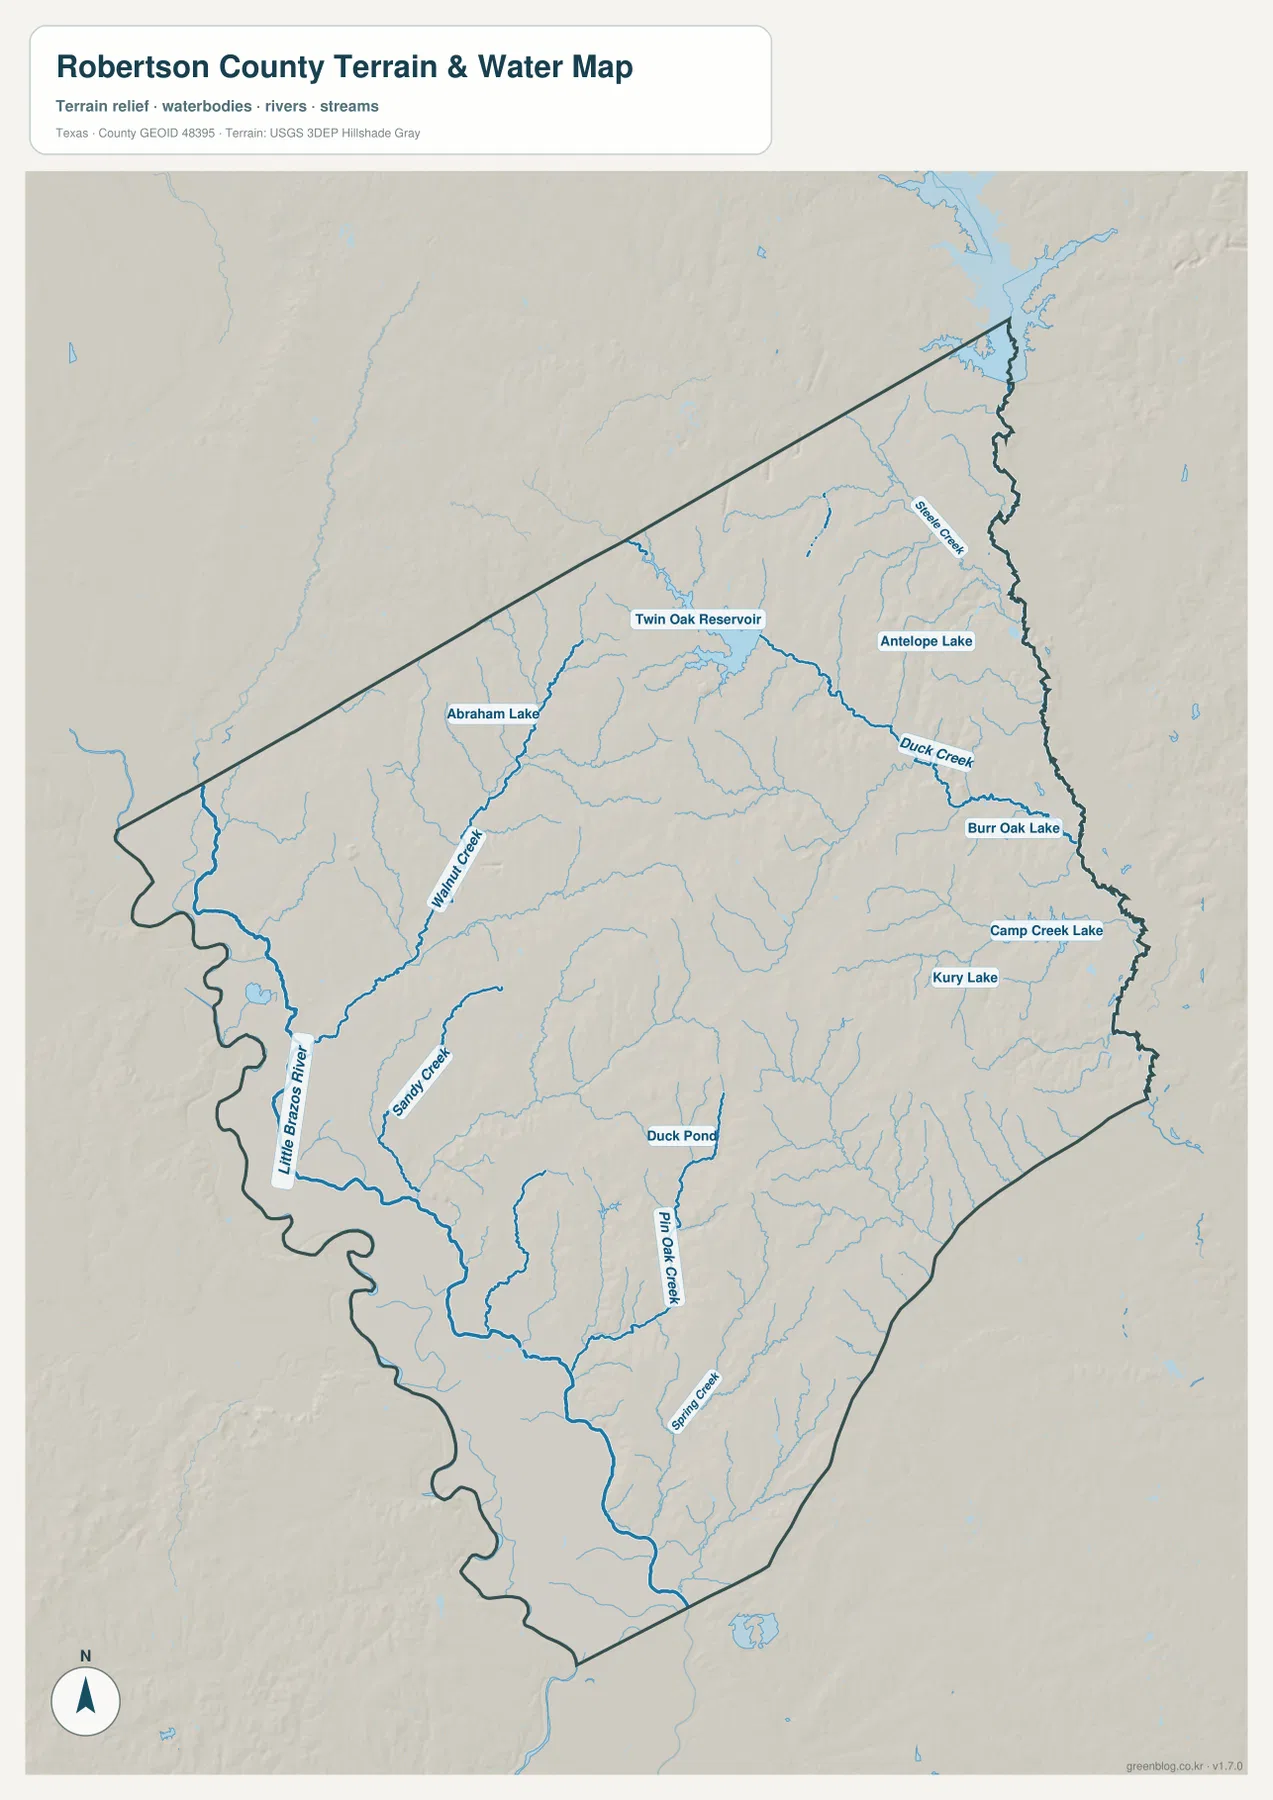
The terrain-and-water view draws attention first to Little Brazos River, which bends along much of the western county edge. Its course helps explain the deeply curved boundary in that part of Robertson County. Inside the county, Walnut Creek and Sandy Creek feed through the western half, while Pin Oak Creek and Spring Creek appear farther south. Duck Creek and other smaller tributaries cross the northeastern and eastern sections. Rather than one dominant stream running through the middle, the map shows many smaller drainages descending from the interior hills toward larger channels.
Several small named water bodies are also shown. Twin Oak Reservoir, Abraham Lake, and Antelope Lake appear in the northern half, while Burr Oak Lake, Camp Creek Lake, and Kury Lake are labeled toward the east. Duck Pond is marked in the south-central area. These labels are useful for locating water features and comparing them with nearby terrain, but they should not be interpreted as information about depth, water quality, public access, or flood risk. This is a geographic reference map of water locations, not a floodplain, parcel, boating, or regulatory product.
Elevation rises from the southwestern river lowlands into the central hills
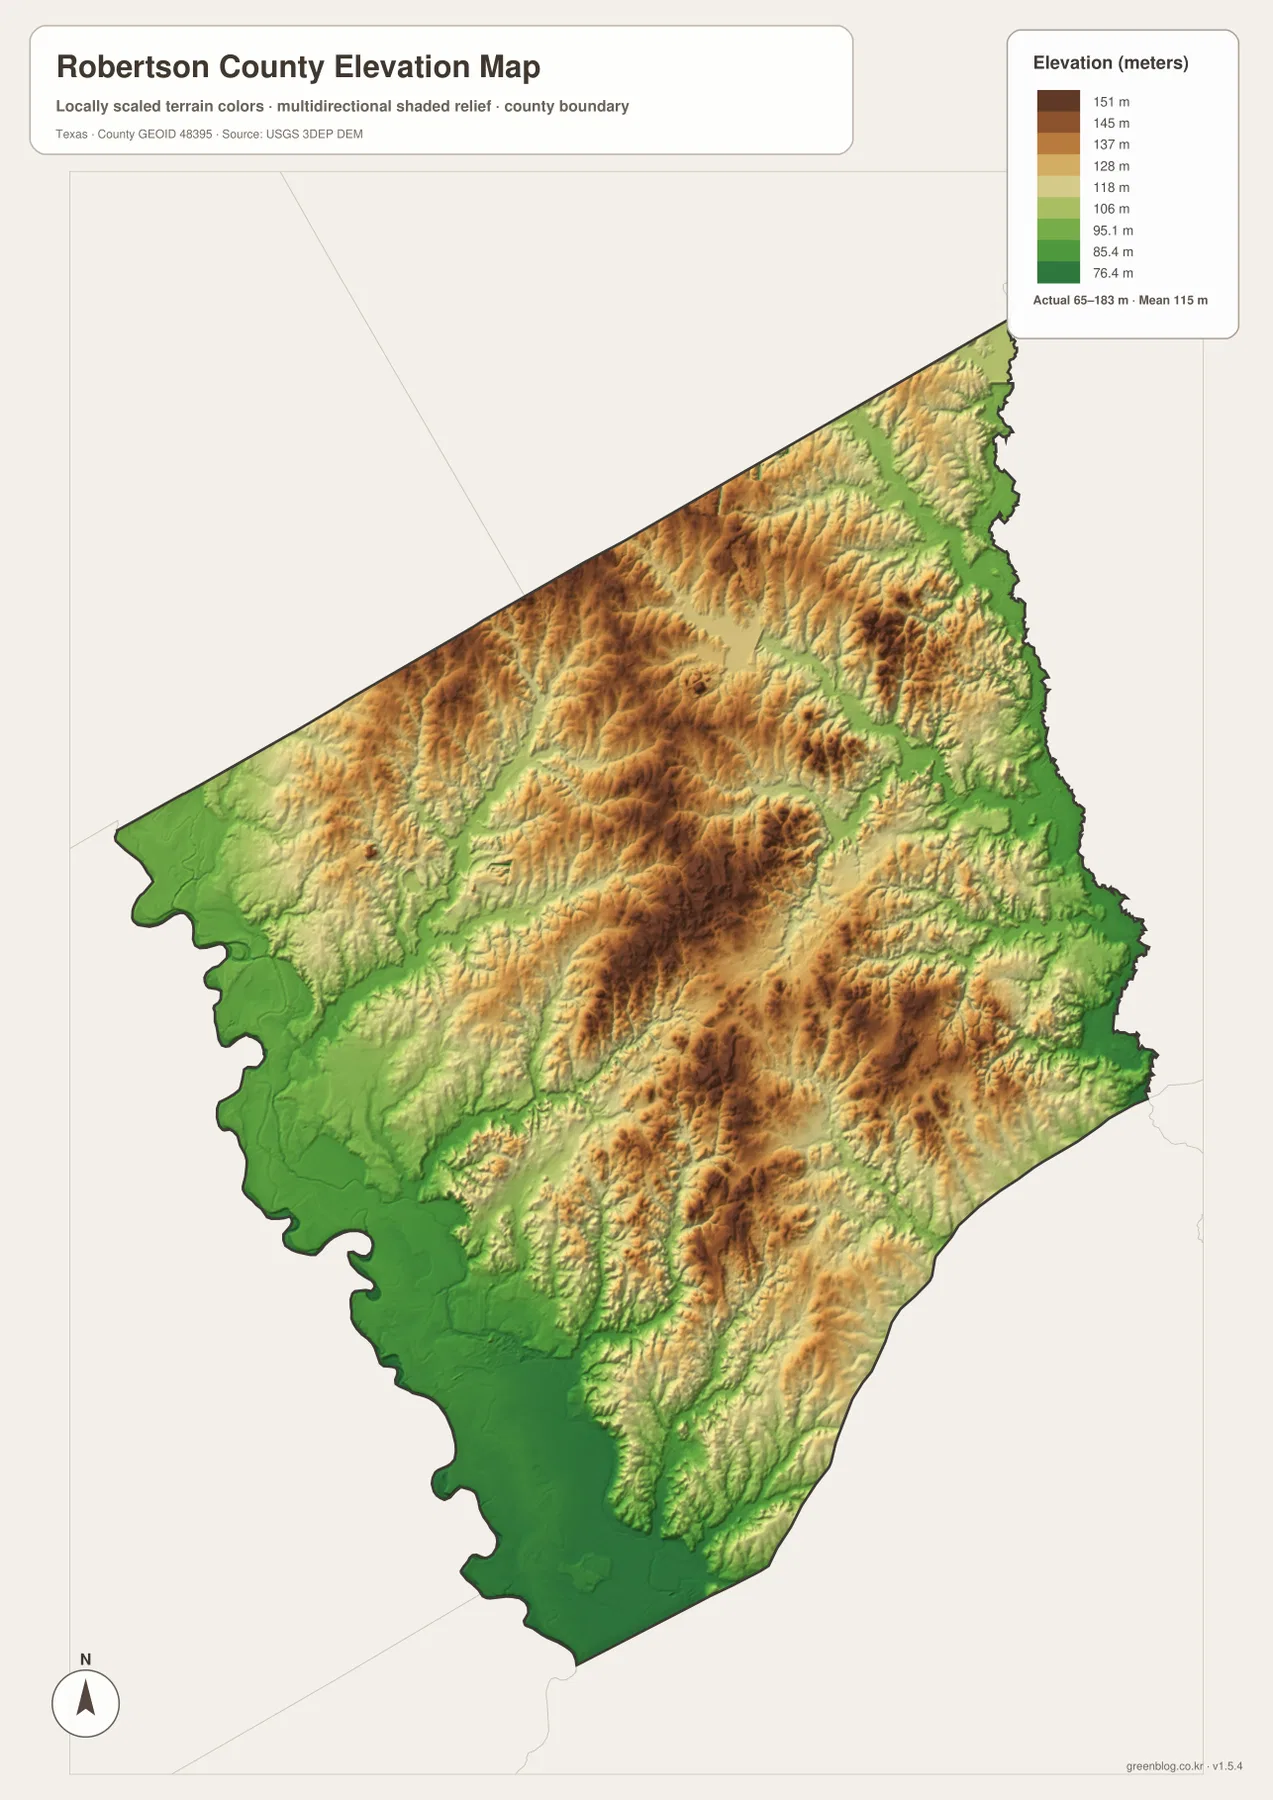
The elevation map provides the clearest visual evidence that Robertson County is not uniformly flat. Its legend reports an actual range of roughly 65 to 183 meters, with a mean elevation of about 115 meters. The lowest green areas are concentrated along the western and southwestern river country. Moving inward, yellow, tan, and brown bands become more common, especially across the central and northern parts of the county. These higher areas form irregular ridges and hill groups rather than one single high point dominating the entire county.
The central brown zones are surrounded by lower green drainage corridors, and similar contrasts appear near the eastern edge. This pattern becomes easier to understand when the elevation and water maps are viewed together: many of the creeks follow lower ground between higher ridges. The shaded relief is designed for county-scale comparison, so it should not be read as survey-grade elevation at a house lot, construction site, or road cut. Where exact height matters, a detailed elevation dataset or field survey is more appropriate.
Reading towns, water, and relief as one county landscape
Putting the four map views together makes the differences within Robertson County easier to see. Hearne and Calvert lie closer to the lower western river country, while Franklin sits farther into the rolling interior. Bremond is a northern reference point where the road network meets a more varied upland surface. That does not imply a ranking among the towns; it simply shows that they occupy different parts of the county’s physical setting. Road and rail corridors, waterways, and settlement points are not laid over identical terrain from one side of the county to the other.
The existing article identifies the Brazos side as the western boundary and the Navasota side as the eastern boundary. The supplied water preview gives more detailed labels for Little Brazos River and the interior creeks, so the general and water maps work best as a pair when tracing the county edges. The western bends, the branching creeks, the low valleys, and the higher interior ridges all reinforce the same geographic picture: water helps shape the irregular boundary and lower ground, while the main roads connect towns across the higher interior and southern crossings.
Choosing the right Robertson County map for the task
For a quick overview, start with the county map. It places the four main mapped towns, major routes, county lines, waterways, and rail lines in one frame, so it works well for basic orientation. If the question is how far Franklin, Calvert, or Bremond lies from Hearne in a simple geographic sense, the city-connections map is cleaner. Remember that its 8-, 12-, and 20-mile labels are direct distances rather than road mileage, so they should not be used to estimate driving time.
The terrain-and-water map is the better choice when a creek, lake, reservoir, or river corridor is the subject. It contains more named water features than the general map and shows them against shaded terrain. The elevation map is most useful when the difference between the low southwestern side and the higher central and northern hills matters. In a school handout, report, or presentation, pairing the general map with the elevation view often explains both location and landform efficiently; a water-focused project can add the terrain-and-water view instead.
The downloadable files are the better option when the maps need to be printed, enlarged, or placed in a document. The archive contains separate high-resolution JPG files for the county reference map, city-connections map, terrain-and-water map, and elevation map. They are geographic reference products rather than legal parcel, flood-risk, engineering, or live-navigation maps. If a project depends on property boundaries, current road restrictions, flood regulation, or precise site elevation, the relevant official dataset should be checked separately.
Frequently Asked Questions
Are the Hearne-to-Franklin, Calvert, and Bremond distances driving distances?
No. The city-connections map labels straight-line distances from Hearne: about 12 miles to Franklin, 8 miles to Calvert, and 20 miles to Bremond. Road mileage can be longer because actual routes follow curves, intersections, and available crossings. Use those values to compare relative spacing and direction, then consult a current road service when planning a trip.
What does the elevation map show about the lowest and highest parts of Robertson County?
The map reports an actual countywide range of about 65 to 183 meters and a mean near 115 meters. Lower green areas are concentrated along the western and southwestern river side, while higher tan and brown hills are more common through the central and northern interior. The surface is generalized for county-scale viewing and should not be used as an exact elevation for an individual property.
Can the water map be used to determine flood risk?
No. It helps locate Little Brazos River, named creeks, reservoirs, ponds, and small lakes, but it does not display flood zones, water-level forecasts, levee conditions, or regulatory boundaries. A flood-risk decision should be based on current official flood information rather than the reference map on this page.
Public data references for boundaries, water, and elevation
Readers who need the underlying public data can consult the U.S. Census Bureau TIGER/Line Shapefiles for boundary and transportation geography, USGS National Hydrography for rivers and streams, and the USGS 3D Elevation Program for elevation data. The maps on this page are simplified county-scale reference views, so authoritative source data should take priority for legal, engineering, or precision measurement work.
Map File Information
Download the Robertson County boundary, city, water-and-terrain, and elevation maps as original high-resolution JPG files. The ZIP is intended for printing, document editing, and closer inspection than the on-page previews.
- Included Files: county map, city-connections map, terrain-and-water map, elevation map
- File Type: four high-resolution JPG files inside one ZIP archive
Related Maps
Green Map creates custom-edited map images using open geographic data sources such as geoBoundaries, Natural Earth, OpenStreetMap, and government open data.
These maps are edited visual materials, not raw data files, and are provided for education, documents, presentations, and graphic reference.