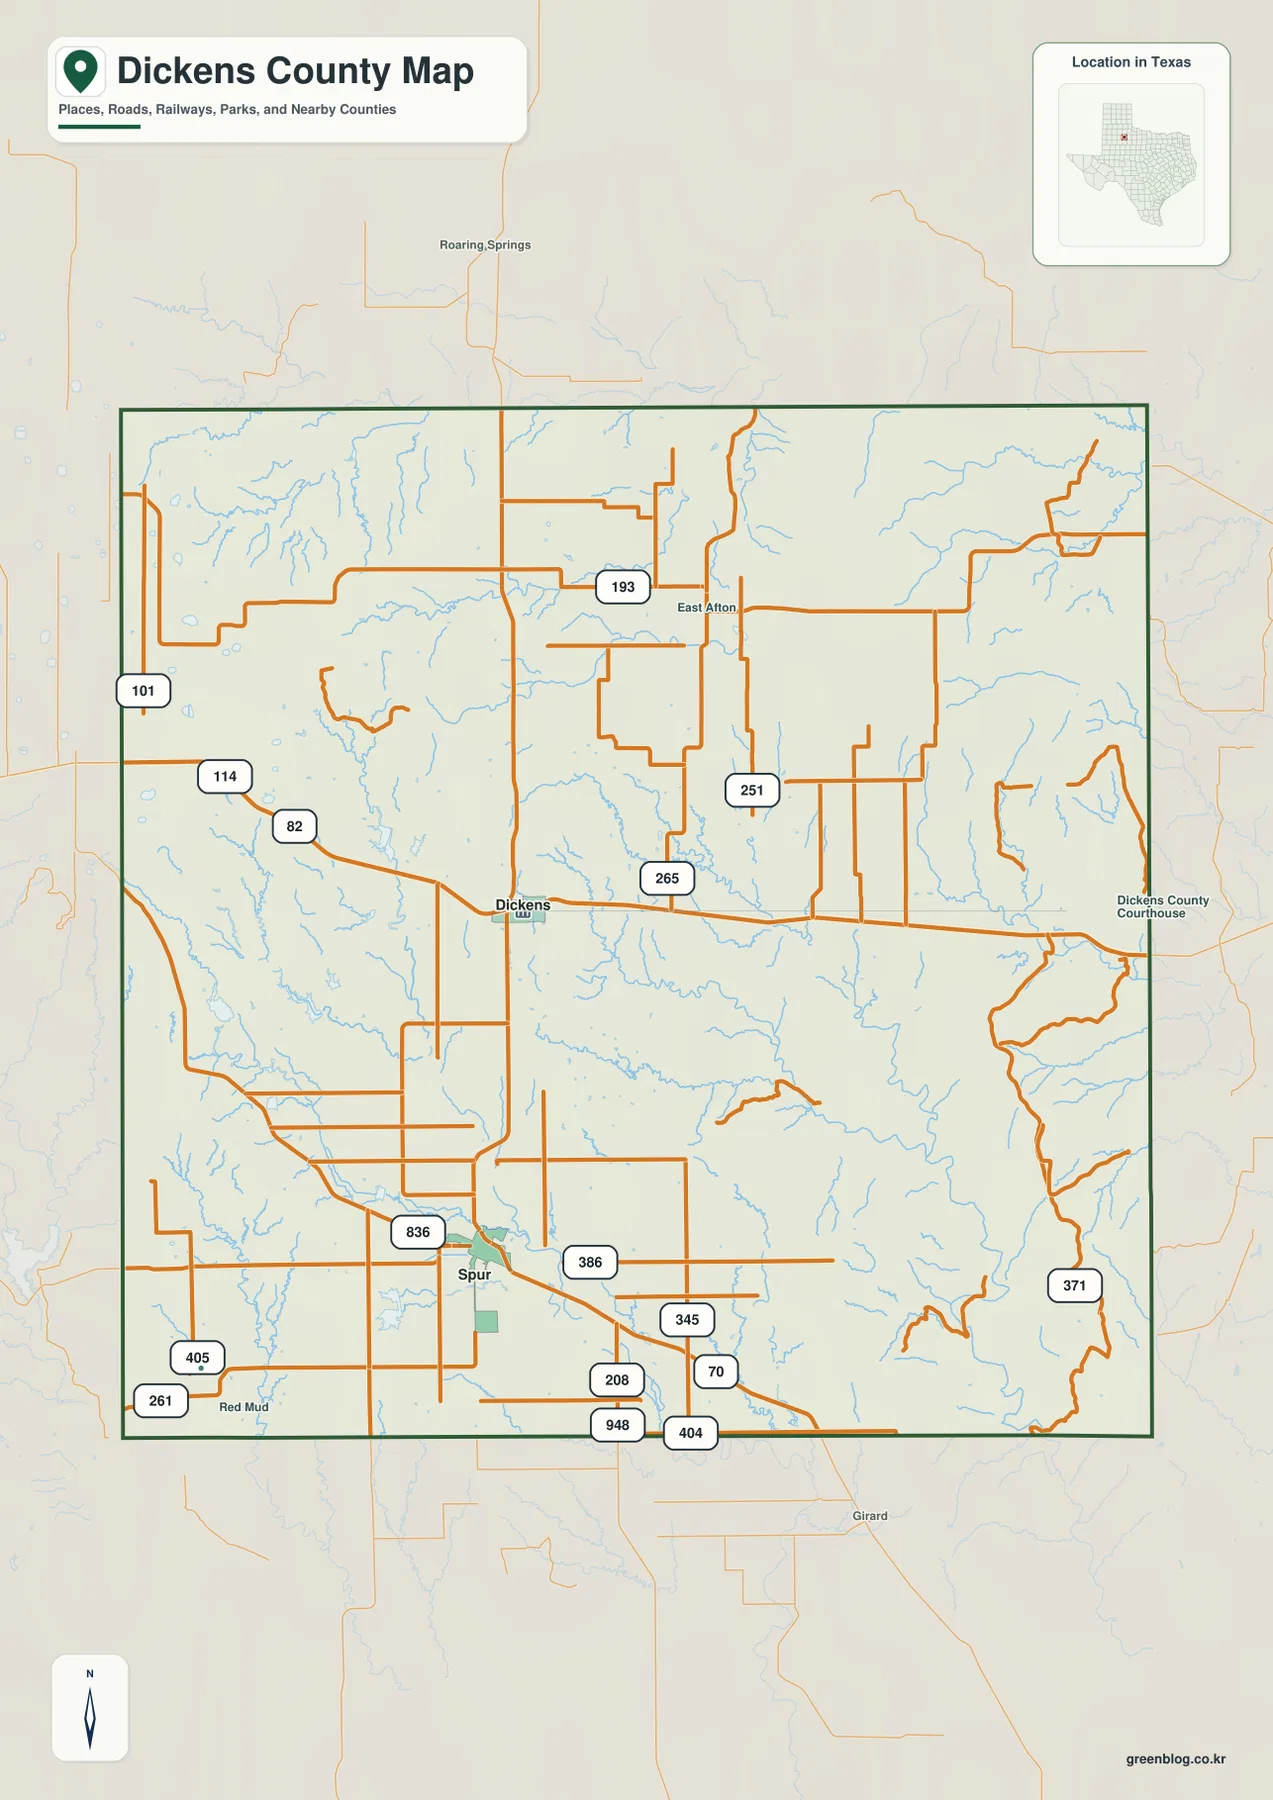
Dickens County is a useful place to compare the high western edge of the Caprock with the lower, more deeply cut terrain to the east. The supplied county map places Dickens near the middle of the county and Spur farther south, with smaller labels such as East Afton and Red Mud adding local reference points. The water map shows North Wichita River, South Wichita River, Croton Creek, Duck Creek, and a dense network of tributaries, while the elevation map makes the west-to-east drop unmistakable. High-resolution A3 JPG versions of all supplied maps are available together in a ZIP download near the end of this page.
The clearest way to read the county is to begin with Spur and Dickens, then compare the road pattern with the drainage and elevation maps. The general county map keeps roads, place names, boundary lines, and streams in one view. The city map removes much of that detail and emphasizes the two ranked major cities. The water and elevation maps then explain why the eastern and southeastern parts of the county look more dissected than the higher western side.
Table of Contents
Starting with Spur, Dickens, and the Main Road Pattern
On the general county map, Dickens sits near the center and Spur lies to the south. U.S. 82 is labeled on the route that enters from the west, reaches the Dickens area, and continues toward the southern part of the county. Around Spur, route markers 70, 208, 386, and 345 appear close together, so the southern road network looks relatively concentrated. North and east of Dickens, longer gaps appear between the larger road lines, and the background is increasingly filled by small drainage channels.
The northern portion includes East Afton and route markers 193 and 251, while 265 is labeled east of Dickens. On the west side, 101 and 114 provide additional reference points, and the southwest around Red Mud includes 261 and 405. The value of the map is not in memorizing every route number. It is in seeing how the roads cluster around the two main communities and how the network thins as it crosses more open or more dissected terrain.
Several labels outside the county boundary, including Roaring Springs to the north and Girard to the south, help orient the page without turning it into a navigation map. They show where the county sits relative to nearby places, but the most reliable information for this article comes from the features drawn inside the county boundary. Current driving directions, road closures, and construction should always be checked with a live transportation source rather than a static map.
What the Two-City Index Reveals
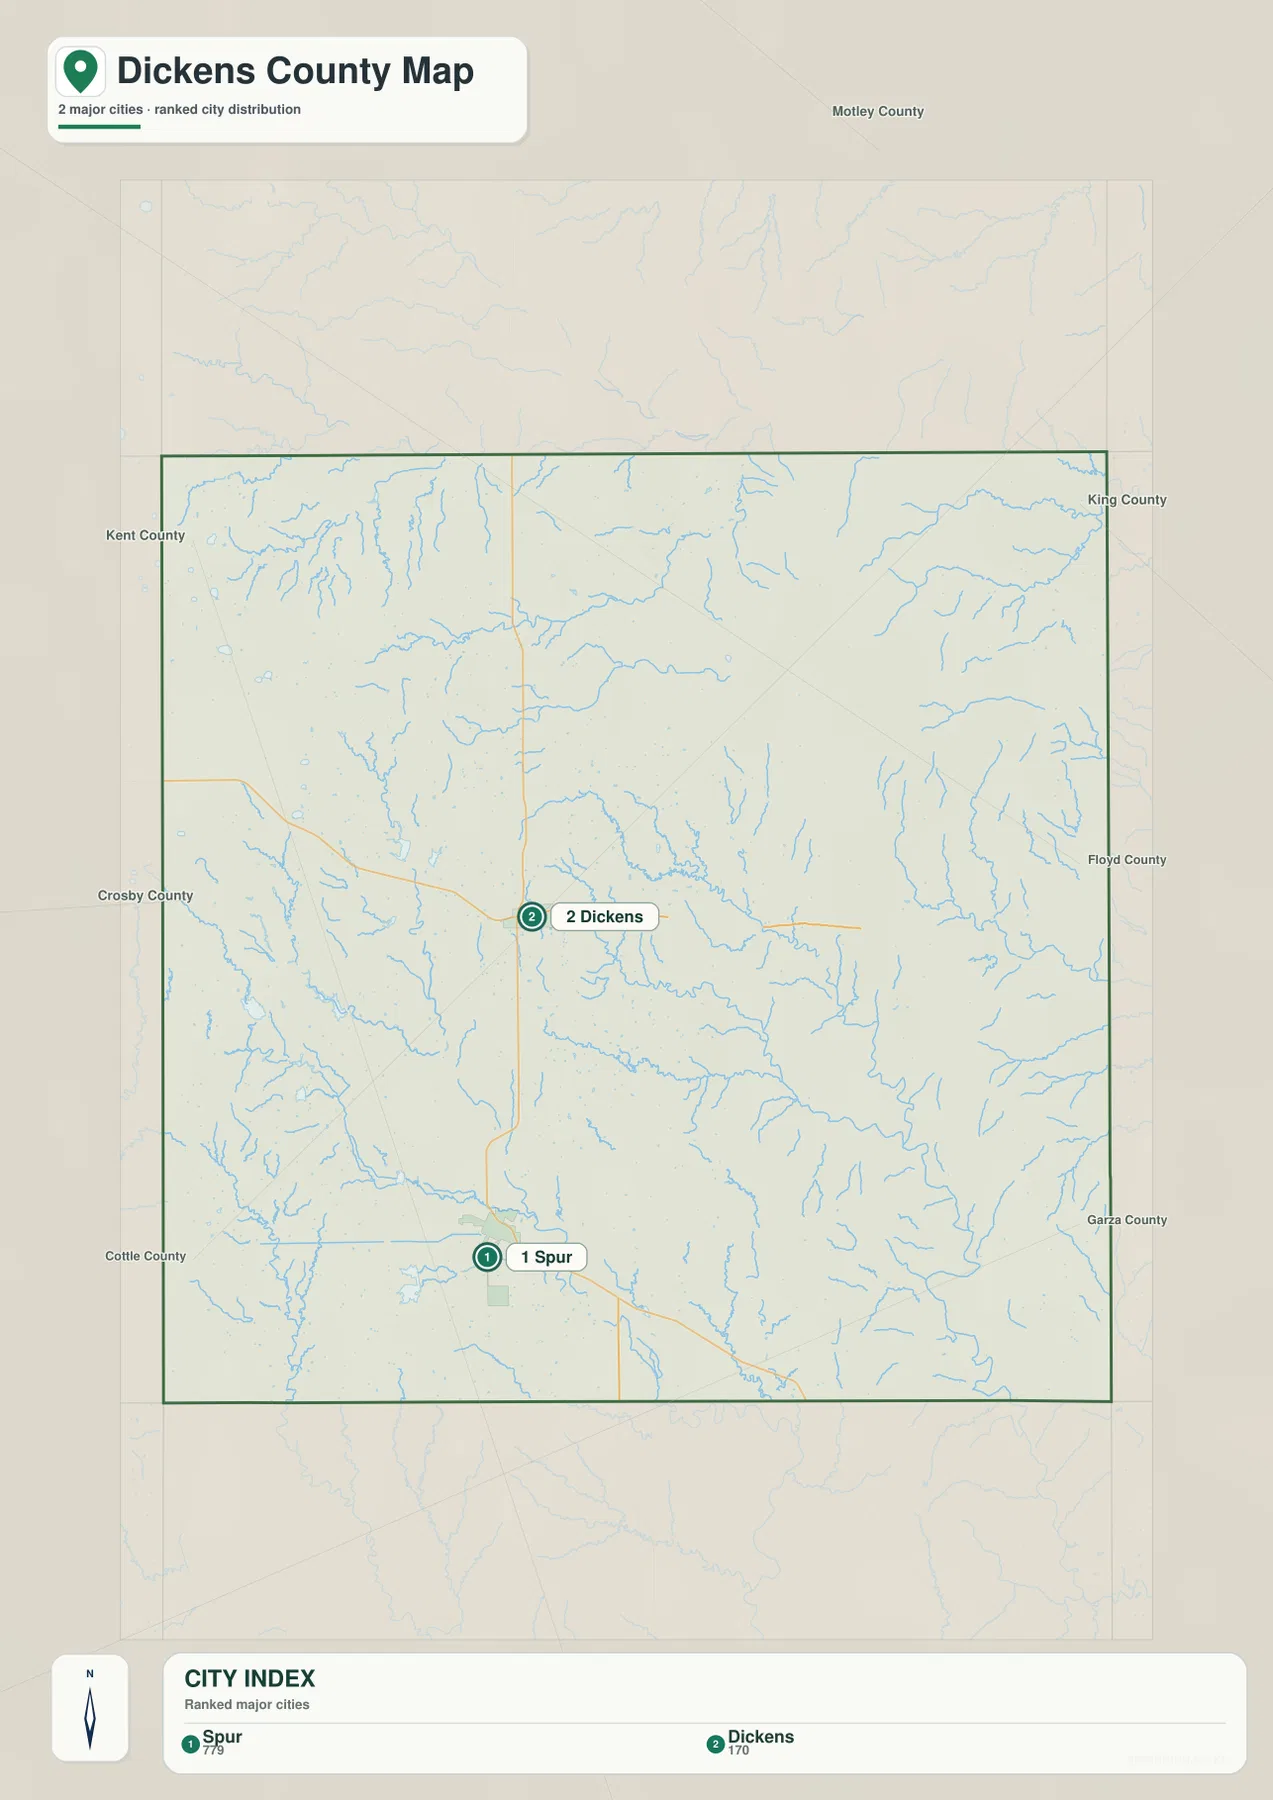
The city map is intentionally simple. It ranks Spur first and Dickens second, placing Spur in the southwestern part of the county and Dickens to the north. Because most road labels have been removed, the north-south separation between the two communities is much easier to see than it is on the general map. This makes the city map a useful orientation tool before returning to the more detailed road and water layers.
The city index should be read as part of this specific map rather than as a complete inventory of every settlement in Dickens County. Smaller communities and local place names remain important on the general map, but the city layer focuses attention on the two locations that dominate the supplied ranking. Spur is farther south and closer to the denser southern road pattern, while Dickens is nearer the center of the county and closer to the transition between higher western ground and the more dissected eastern terrain.
Comparing the city map with the elevation map adds useful context. The western and southwestern side retains more of the higher plateau surface, while the ground east of Dickens drops into greener, lower terrain. The two city markers therefore do more than show population order. They provide reference points for comparing how settlement locations relate to roads, the Caprock transition, and nearby drainage channels.
Wichita River Tributaries, Croton Creek, and Duck Creek
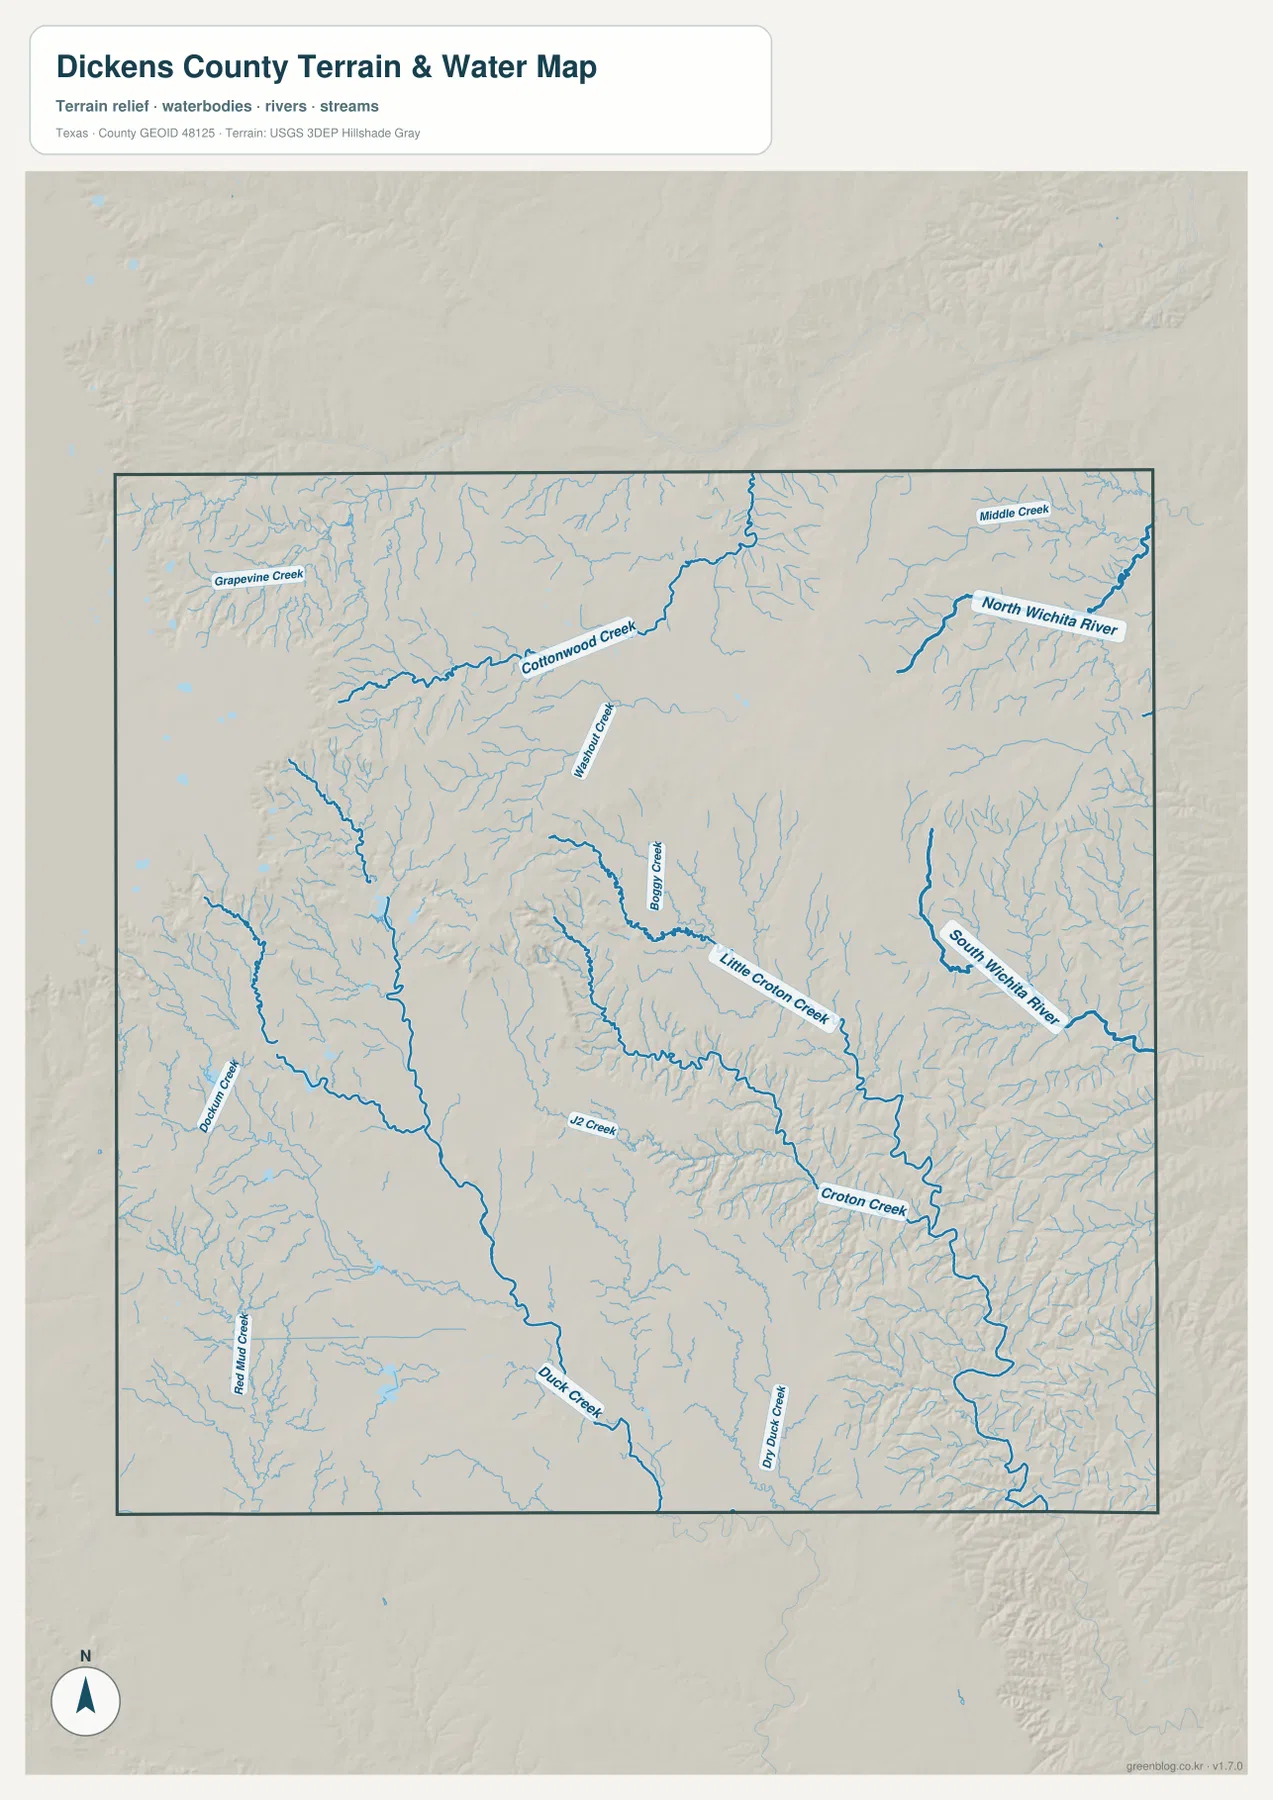
The terrain-and-water map shows that Dickens County is crossed by many more drainage lines than the general road map first suggests. North Wichita River is the strongest labeled channel in the northeast, while South Wichita River forms another major drainage line farther south on the eastern side. Between them, tributaries such as Middle Creek, Cottonwood Creek, and Buggy Creek spread through the central and northern parts of the county.
Croton Creek is the dominant labeled stream in the southeast, winding through a dense network of smaller branches. Little Croton Creek joins the same general drainage area from farther west. In the south-central part of the county, Duck Creek and Dry Duck Creek are clearly labeled, while Red Mud Creek and Roaring Creek appear on the western side. Grapevine Creek is labeled in the northwest, giving the map named reference points in nearly every part of the county.
It is easier to understand this map by grouping the waterways rather than treating every blue line as a separate feature. The Wichita River branches organize much of the east, Croton Creek dominates the southeast, and Duck Creek provides a strong reference in the south. Once those larger names are located, the smaller tributaries show how deeply the lower eastern terrain has been cut. The map is not a flood-risk or real-time streamflow product, so water levels and hazard decisions require current official information.
The Sharp Elevation Change from the Caprock to the East
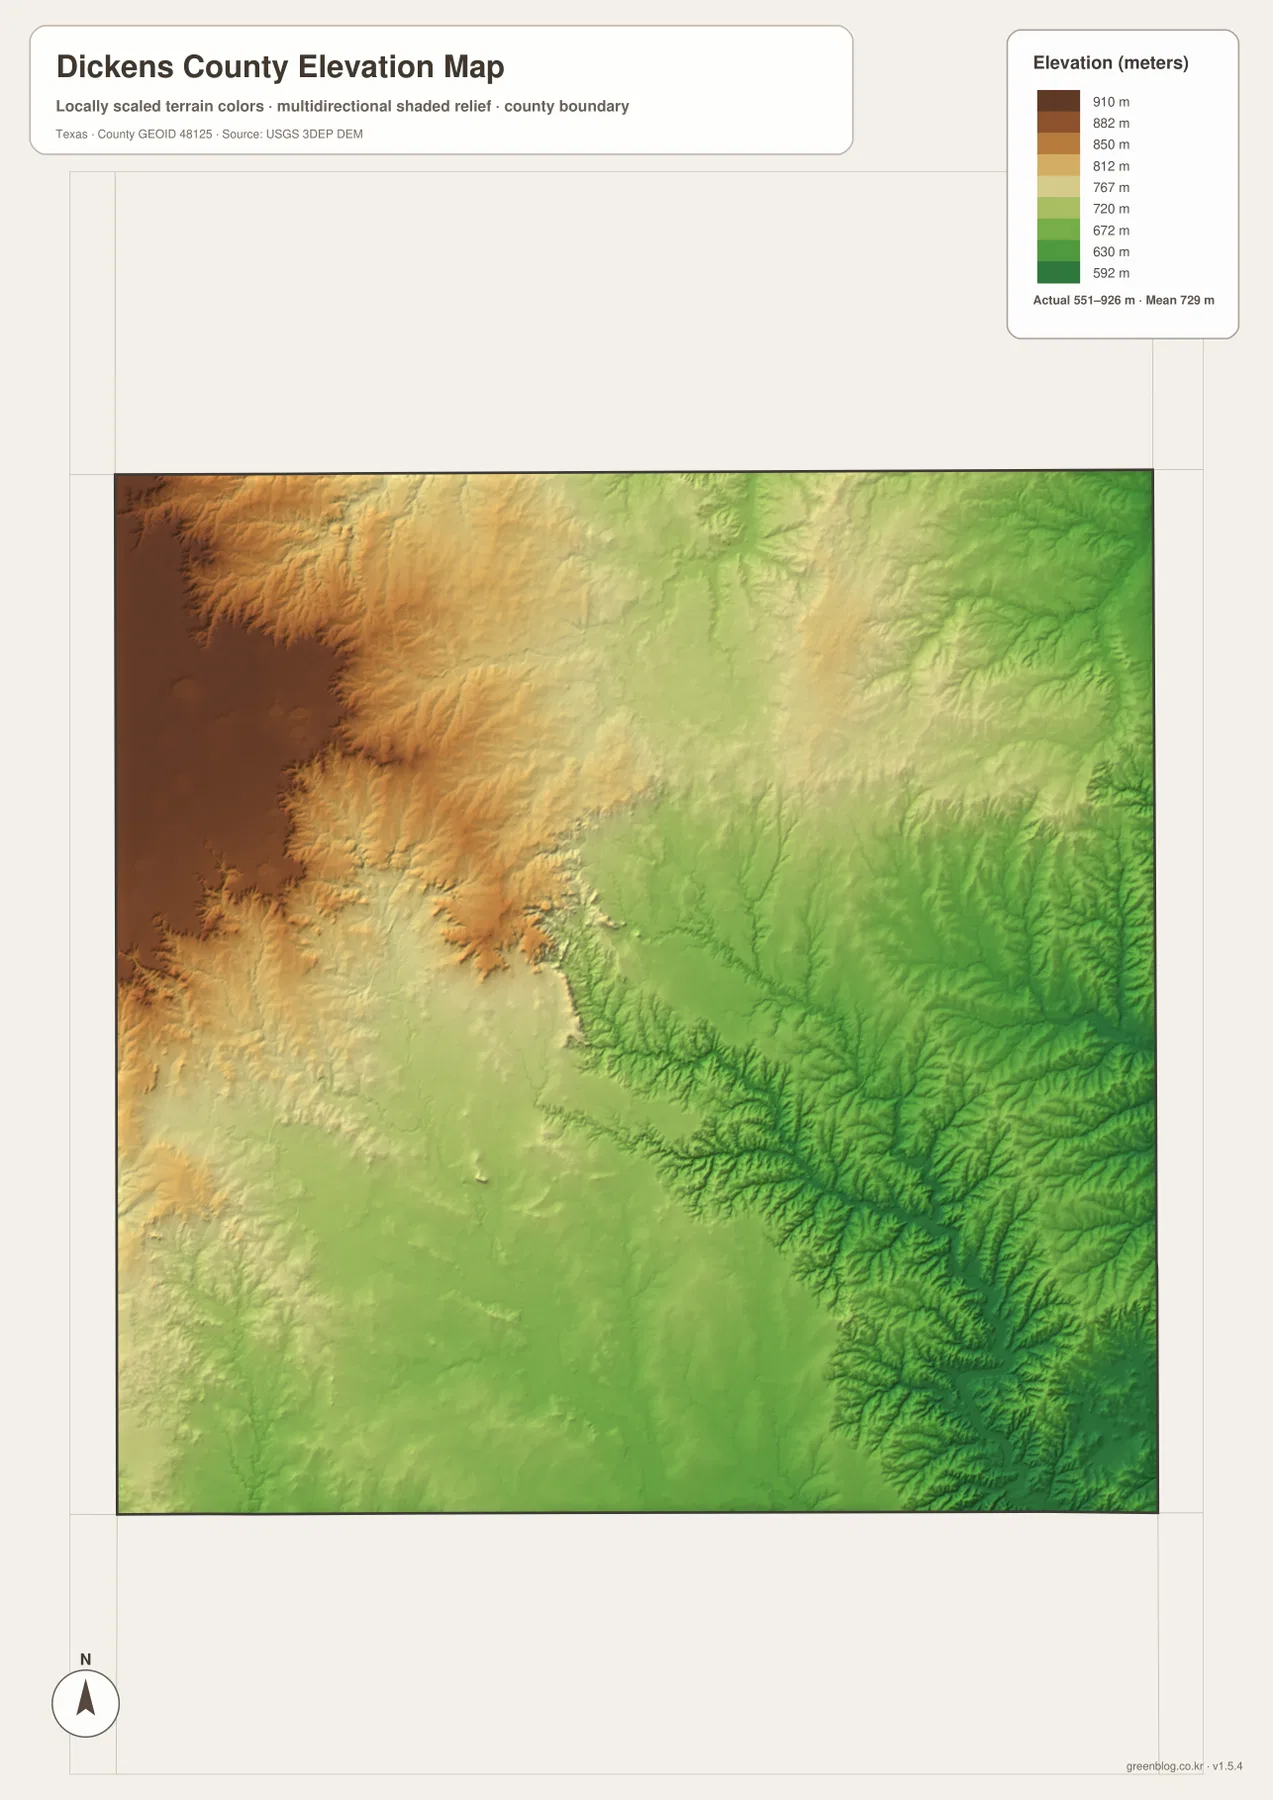
The elevation map provides the strongest visual explanation for the county’s physical geography. Its legend shows an actual elevation range of about 551 to 926 meters, with a mean near 729 meters. Dark brown and brown colors occupy much of the west and northwest, identifying the highest terrain. Moving eastward, the colors pass through tan and yellow into broad green areas, and the southeastern corner contains some of the lowest elevations shown on the map.
This is the Caprock transition in map form. The western plateau surface is higher and relatively broad, but the edge breaks down into a much more dissected landscape toward the center and east. In the lower green terrain, branching valleys are visible in the shaded relief, especially where the Wichita River and Croton Creek systems have cut into the surface. The map is therefore most useful for understanding the large west-to-east change rather than for locating a single isolated summit.
The water and elevation maps reinforce one another. Where the colors drop toward green, stream valleys become denser and more distinct. Where the western plateau remains brown, the surface appears broader and less finely divided. That relationship helps explain why the road map looks different on opposite sides of the county: transportation lines cross a relatively open high surface in the west but encounter more drainage cuts and relief farther east.
Using the Maps Together Instead of Separately
The general map is the best first choice when the goal is to place Spur, Dickens, roads, and the county boundary in one view. The city map is better when the main question is simply where the two ranked communities sit relative to each other. The water map brings the Wichita River branches, Croton Creek, Duck Creek, and smaller tributaries forward, and the elevation map explains the high-west, low-east contrast that shapes those drainage patterns.
For a classroom comparison, one useful sequence is to mark Spur and Dickens on the general map, trace one or two major road corridors, then switch to the water map and identify where the drainage becomes most complex. The elevation map can be used last to explain why that complexity increases toward the lower eastern side. For print projects, the A3 JPG files provide more room for labels and annotations than the smaller on-page WebP previews.
A Simple Reading Order for Dickens County
Begin with Spur and Dickens rather than the smallest place names. Next, notice the broad road pattern around those two communities and the longer gaps toward the outer parts of the county. Then compare the elevation colors from west to east before opening the water map. Once the high-to-low transition is clear, the dense eastern creek network becomes much easier to interpret.
Small labels such as East Afton, Red Mud, Grapevine Creek, and Little Croton Creek become more meaningful after the county’s larger structure is understood. Nearby-county labels around the city map should be treated as orientation aids rather than the main evidence for this page, because that layer is designed to emphasize city ranking. The article therefore relies most heavily on the features drawn inside the Dickens County boundary and on the four supplied map types.
Frequently Asked Questions
Where are Spur and Dickens on the county maps?
The city map places Spur in the southern to southwestern part of the county and ranks it first, while Dickens is farther north and ranked second. The general map adds roads and streams around both locations, making it easier to compare their surroundings.
How does the Caprock show up on the elevation map?
The western and northwestern side is shown in brown as the highest terrain, and the colors shift toward green as elevation drops eastward. The supplied legend spans roughly 551 to 926 meters, and the lower east contains a much denser pattern of valleys.
Which waterways are easiest to identify first?
Start with North Wichita River and South Wichita River in the east, Croton Creek in the southeast, and Duck Creek in the south. Smaller names such as Cottonwood Creek, Buggy Creek, and Little Croton Creek are easier to place after those larger drainage lines are found.
Map File Information
The ZIP contains the four supplied Dickens County maps as high-resolution A3 JPG files, suitable for printing, classroom use, and side-by-side geographic comparison.
- File Type: ZIP containing 4 JPG files
Related Maps
- Motley County Texas map
- Swisher County Texas map
- Scurry County Texas map
- Stonewall County Texas map
- Armstrong County Texas map
Sources and References
The descriptions on this page are based first on the four supplied Dickens County maps. The following official data services provide additional reference layers for boundaries, hydrography, roads, and elevation.
- USGS The National Map Viewer – official U.S. geographic layers for map comparison.
- U.S. Census Bureau TIGER/Line Shapefiles – official boundary and transportation line data.
- USGS National Hydrography – official hydrography reference for rivers and streams.
- USGS 3D Elevation Program – national elevation data and terrain resources.
Green Map creates custom-edited map images using open geographic data sources such as geoBoundaries, Natural Earth, OpenStreetMap, and government open data.
These maps are edited visual materials, not raw data files, and are provided for education, documents, presentations, and graphic reference.