Greene County has one of the clearest land-cover contrasts in eastern New York. Broad forest dominates the Catskill portion of the county, especially across the west and south, while farmland, developed land, wetlands, and water become more noticeable toward the eastern and northeastern lowlands. The 2025 summary puts forest at 75.11 percent, so the county is overwhelmingly wooded, yet the map also shows where that forest gives way to a more settled landscape.
This page provides four complementary views: general land cover, forest and farmland, impervious surface and developed land, and mapped class differences from 1985 to 2025. WebP versions appear in the article for quick viewing, and the four original JPG maps are available together in one ZIP download. Moving from the broad land-cover pattern to the more focused maps makes it easier to compare the Catskill interior with the Hudson-side edge without treating every colored patch as the same kind of information.
Table of Contents
A county shaped by forest and an eastern lowland
Across the general land-cover view, dark green forest forms an almost continuous background through the southwest, south, and much of the center. Agricultural colors appear more often in the north and northeast, and developed patches become stronger near the eastern side of the county. That arrangement gives Greene County a clear geographic split: large wooded mountain areas occupy most of the interior, while the eastern edge contains a finer mixture of farms, settlements, wetlands, and water.
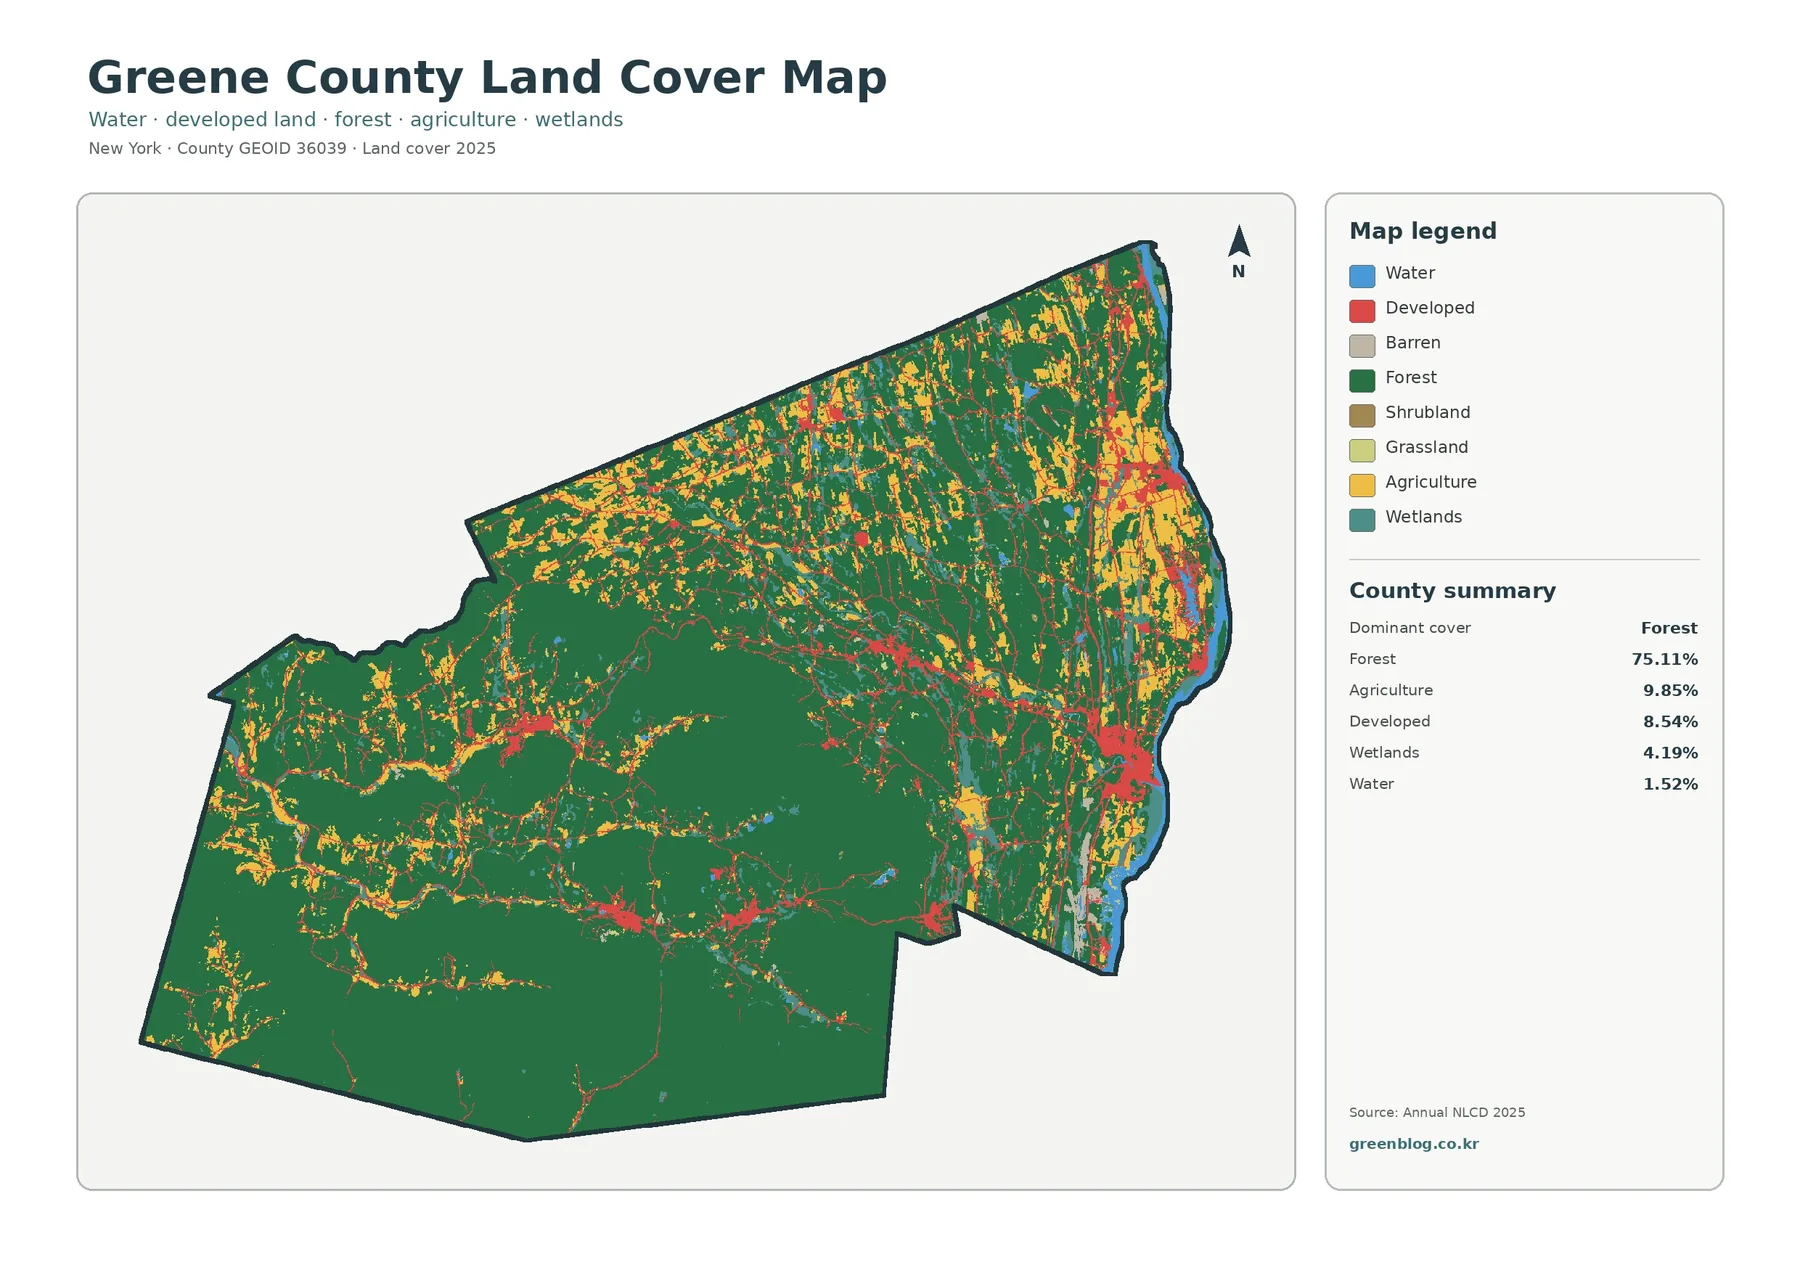
Countywide figures help put those colors in perspective. Forest accounts for 75.11 percent, agriculture 9.85 percent, developed cover 8.54 percent, wetlands 4.19 percent, and water 1.52 percent. A list of percentages, however, does not show where those classes occur. Agriculture is concentrated much more heavily toward the east and northeast than in the Catskill interior, and developed land tends to occupy compact settlement areas or narrow transportation corridors rather than broad countywide blocks.
Wetlands and open water make up smaller shares, yet their positions matter when the map is used for environmental context. They appear along low areas, drainage routes, and the eastern edge, often close to agricultural or developed cover. Looking at those relationships can help a reader identify places that deserve more detailed watershed or habitat study. By itself, that relationship does not establish ownership, zoning, flood risk, or regulatory status.
Surface classification is the key idea behind land-cover data. A green cell represents forest cover, for example, but it does not say whether the land is public or private. Developed classes describe visible built or maintained surfaces rather than legal land-use designations. This distinction matters in Greene County because large forest areas overlap the broader Catskill setting, but forest cover and protected-land boundaries are not interchangeable.
Forest dominance becomes clearer next to farmland
Simplifying the display to forest, farmland, wetlands, water, and a few secondary classes makes the county’s main contrast easier to follow. Large wooded areas fill the Catskills and extend across the center, whereas crop and pasture colors cluster in the east and northeast. Along the northern portion of the county, smaller agricultural openings also interrupt the forest in a patchwork pattern.
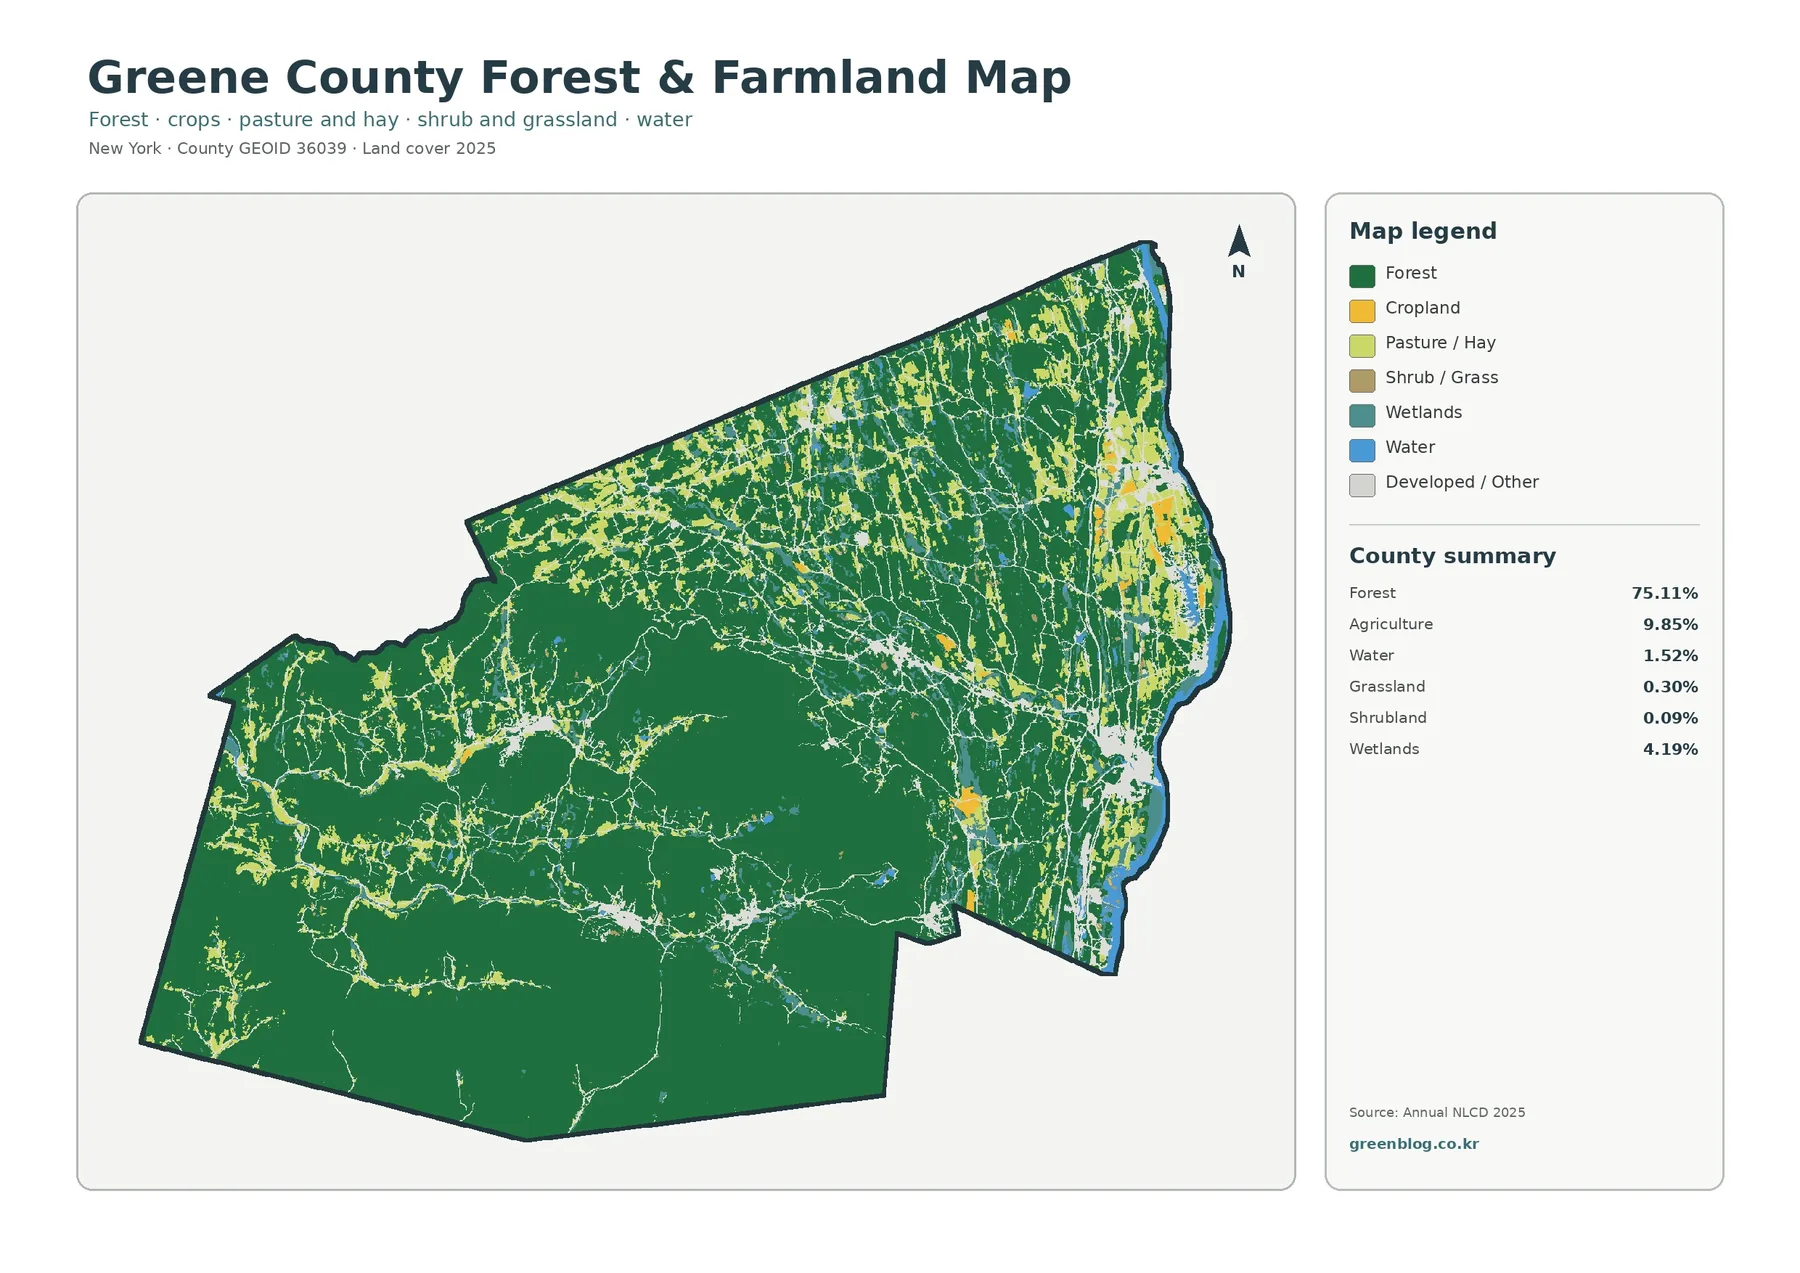
Forest at 75.11 percent and agriculture at 9.85 percent describe very different spatial patterns. The wooded share is not only larger; it also forms broad connected areas. Farmland is more fragmented and generally sits closer to settled valleys and lower terrain. This visual difference is useful for classroom comparisons, conservation discussions, or presentations because it shows why two land-cover classes with simple countywide percentages can have very different effects on the appearance of a landscape.
Other classes provide smaller but useful details. Wetlands account for 4.19 percent, water for 1.52 percent, grassland for 0.30 percent, and shrubland for 0.09 percent. Thin wetland features and small open areas can mark transitions between forest, farms, and drainage corridors even when they occupy only a small fraction of the county. At this scale, they are best treated as clues to broader patterns rather than exact field or property boundaries.
The Catskill setting also provides important context for the western and southern forest. State-managed Forest Preserve lands are extensive in the Catskills, and New York provides official information about that landscape. Still, the green forest class on this page cannot be used as a Forest Preserve map. Some forest cells may be privately owned, and protected boundaries require a separate authoritative source.
Impervious surfaces trace the settlement network
Removing the dominant forest colors reveals a much lighter but informative pattern of pavement, rooftops, parking areas, and other surfaces that shed water rather than absorbing it directly. Greene County’s mean impervious share is 1.70 percent. Areas where impervious cover exceeds 50 percent occupy 0.77 percent of the county, while the broader developed land class covers 8.54 percent. Those figures explain why much of the impervious map remains pale even though several settlement clusters stand out clearly.
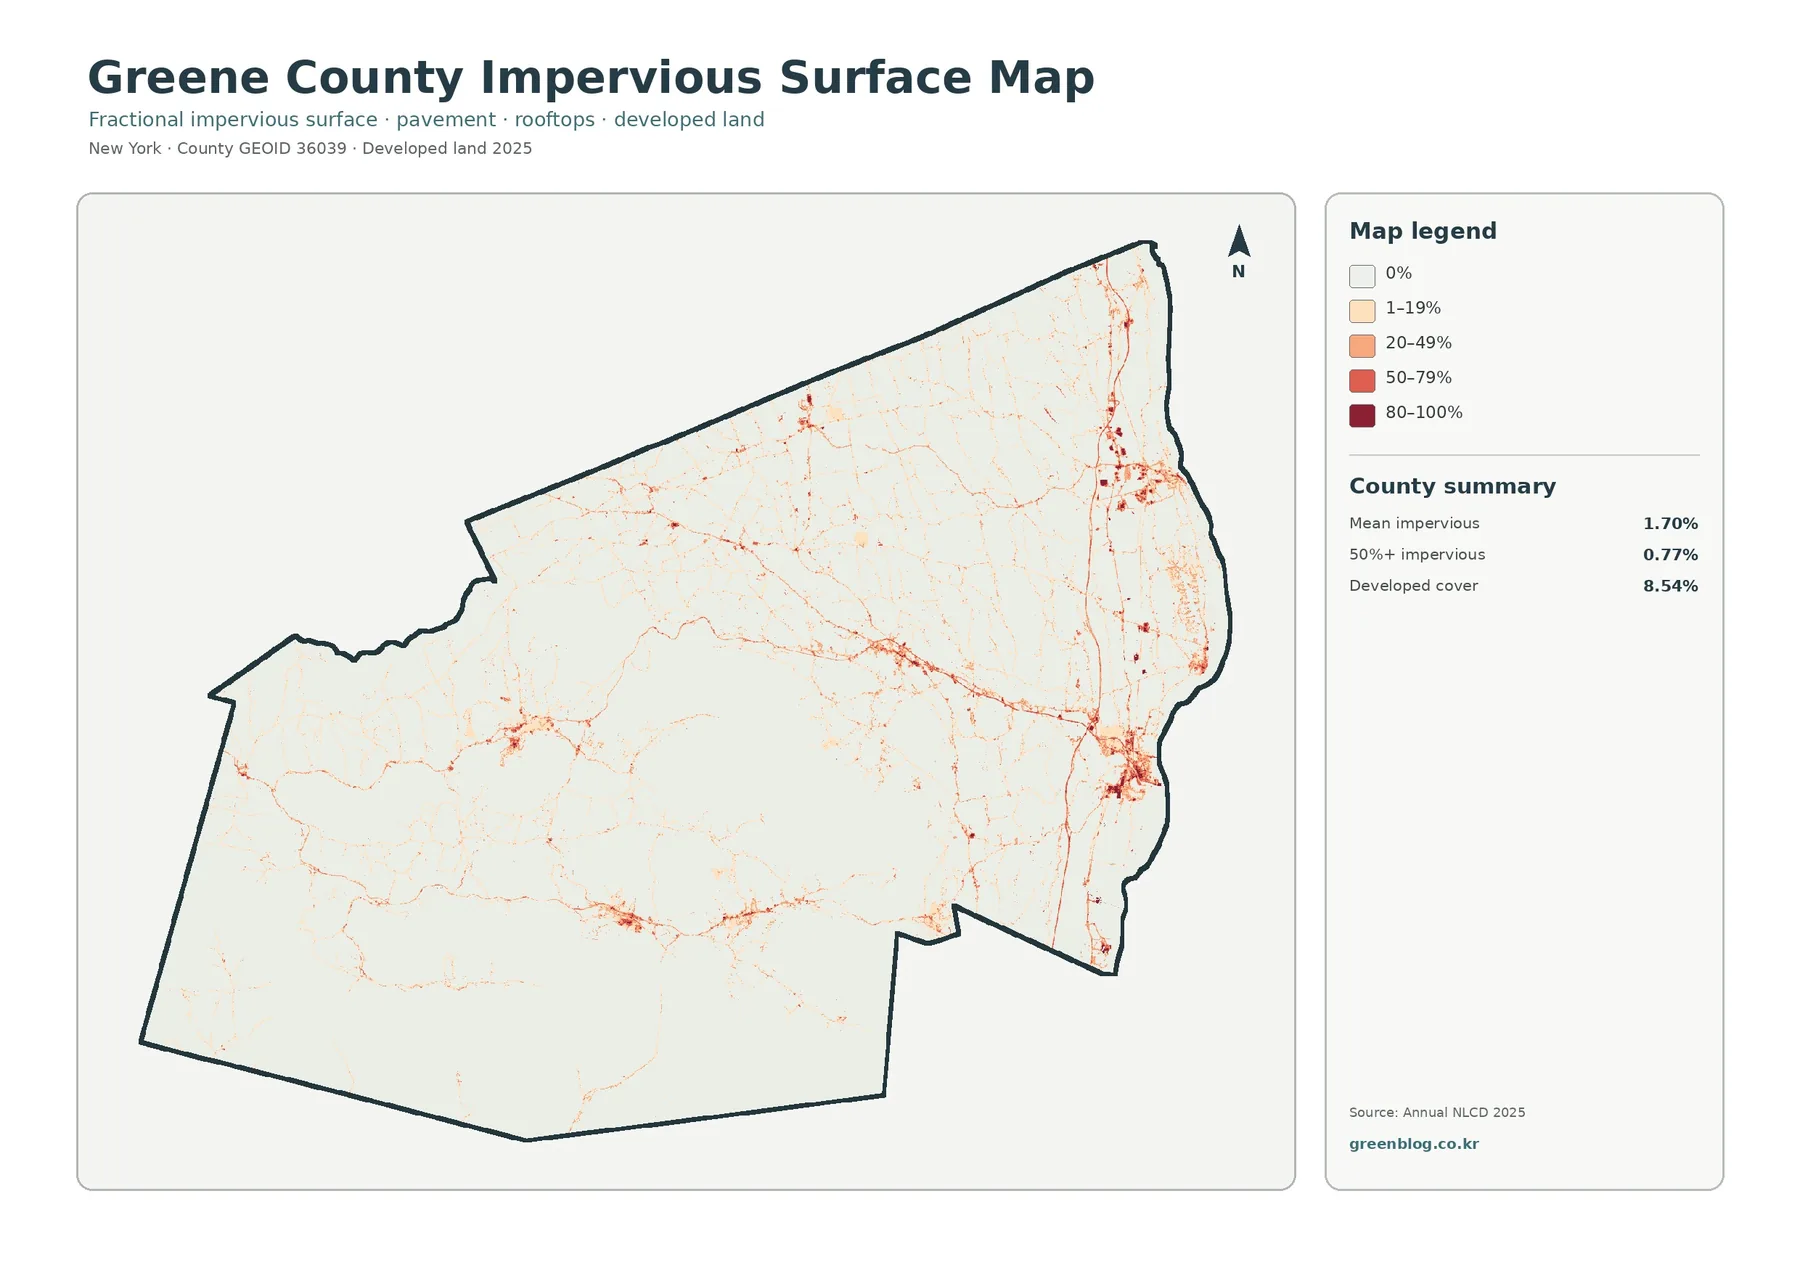
Eastern Greene County contains the strongest red concentrations, including several compact clusters near the county’s Hudson-side edge. A separate concentration is visible farther north, while thin linear traces follow road corridors across the county. Smaller developed pockets also appear inside the forested interior, but they remain isolated compared with the more connected eastern network. The focused display therefore makes the settlement geography easier to recognize than the general land-cover map alone.
For watershed screening, impervious cover can be compared with nearby wetlands, streams, and developed corridors. A higher proportion of paved or roofed surface generally leaves less ground available for direct infiltration, so the map can help identify places where a closer stormwater review may be worthwhile. It is not a flood map, however. Elevation, soils, drainage infrastructure, rainfall, and stream conditions all affect runoff and must be considered separately.
Raster generalization also affects the appearance of narrow features. Roads, building edges, lawns, and vegetation may share the same cell, and one representative value must be assigned to that cell. As a result, this county-scale image is suitable for finding patterns and comparing areas, not for measuring the exact width of a road or the footprint of a particular building.
Where the 1985–2025 classifications differ
Long-term comparison adds a different question: where did the mapped class change between 1985 and 2025? The summary identifies class differences across 5.09 percent of Greene County. Of the total area, 1.22 percent is classified as change to developed cover, 0.70 percent as forest loss, 0.29 percent as agricultural loss, and 2.73 percent as other class differences. Most of the county stays in the no-difference category, which is just as important as the colored change patches.
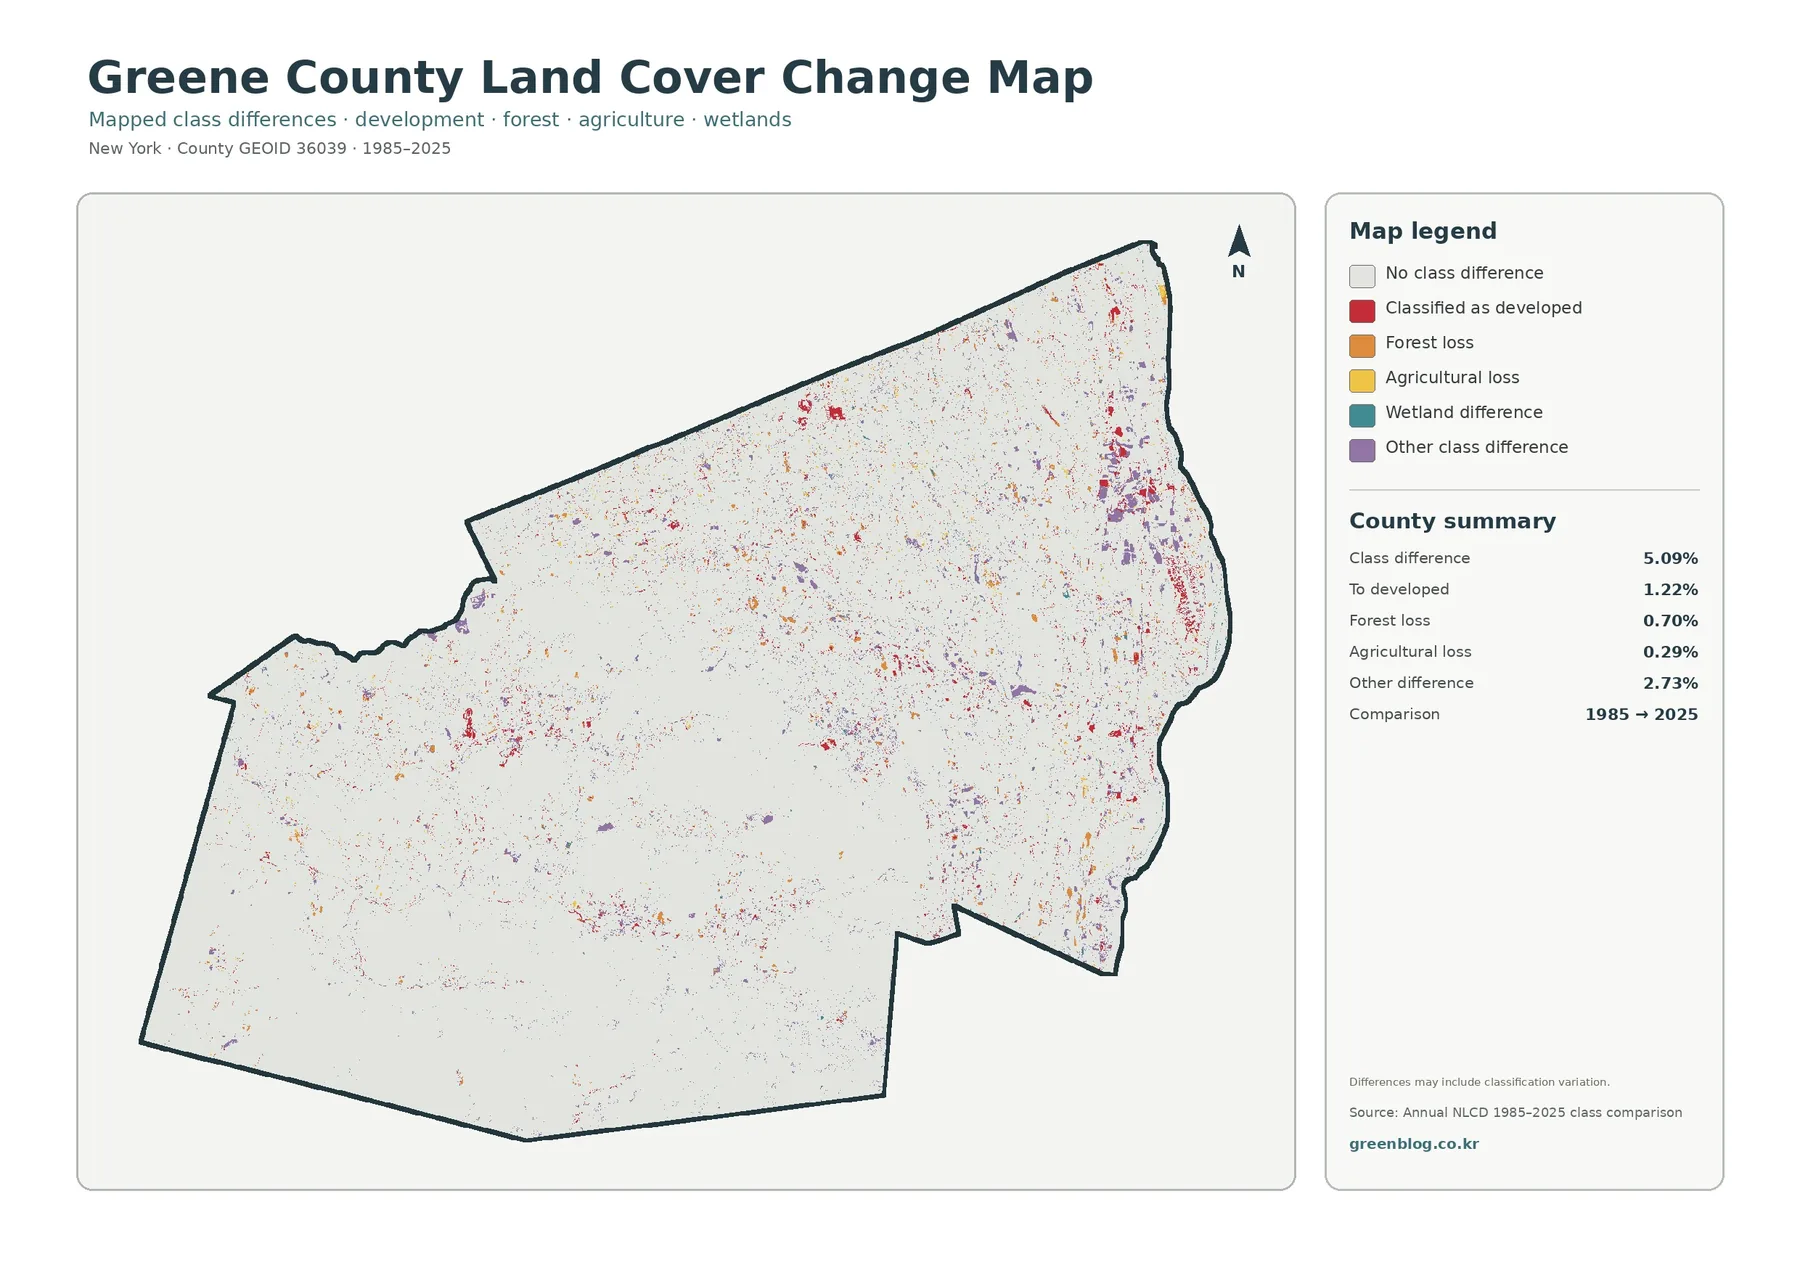
Change points are scattered throughout the county, with denser clusters in parts of the east and northeast. Smaller patches also occur across the wooded interior and along transportation routes. Because the colored areas do not form one continuous zone, the map works best as a way to locate groups of possible change for follow-up. A reader interested in one site should zoom out first to understand the surrounding cluster and then compare that location with historical aerial imagery or local records.
A class difference is not automatically evidence of a specific event such as construction, logging, or farm abandonment. Satellite observations from different years can vary in season, image quality, vegetation condition, and classification confidence. Mixed pixels along forest edges, fields, lawns, and wetlands may also switch categories without a dramatic ground-level transformation. The change layer should therefore be treated as a screening tool rather than a complete history of land-use decisions.
How to use the four Greene County maps
A practical comparison starts with the full land-cover map. Locate the broad Catskill forest first, then notice where agriculture and development become more frequent toward the east. Next, use the forest-and-farmland view to separate large wooded blocks from the more fragmented farm pattern. If the question concerns settlements or transportation surfaces, the impervious map removes much of the visual clutter and makes those features easier to follow.
For the time comparison, it helps to become familiar with the present-day pattern first. A cluster of class differences near an eastern settlement can then be compared with the impervious network, while a small patch inside the forest can be checked against the forest-and-farmland view. This sequence prevents the change colors from being interpreted in isolation and encourages the reader to use each map for the question it is designed to answer.
Different users may emphasize different comparisons. Environmental education can focus on the transition from mountain forest to lower, more settled landscapes. Watershed discussions can compare wetlands and water with nearby impervious surfaces. Presentation graphics may use the simplified forest-and-farmland map when the full legend contains more detail than the audience needs. Planning context can begin with developed areas but should always move to parcel, zoning, and infrastructure data before any site-specific conclusion is made.
Limits to keep in mind
- Land cover describes the mapped surface. It does not identify zoning, ownership, tax status, development rights, or legal land use.
- Raster cells generalize small features, so narrow roads, small wetlands, field edges, and building boundaries may not line up exactly with conditions on the ground.
- Mixed cells can contain forest, grass, pavement, or other surfaces together even though only one class or representative value is displayed.
- The 1985–2025 layer shows differences between classifications; it does not establish the cause of each difference.
- Changes after the 2025 observation period will not be represented in these images, so current site conditions should be checked with newer sources when necessary.
Download the Greene County map files
The ZIP archive includes four original JPG maps: general land cover, forest and farmland, impervious surface and developed land, and mapped land-cover change from 1985 to 2025. The WebP images above are intended for quick browser viewing, while the JPG files are the versions to save for printing, classroom use, presentations, or offline reference.
Frequently Asked Questions
What is the dominant land cover in Greene County?
Forest is the dominant 2025 class at 75.11 percent. The broadest connected forest areas occupy the western and southern Catskill portion of the county, while agriculture and development are more common toward the east and northeast.
Where is impervious cover most concentrated?
The strongest concentrations appear around eastern settlements and transportation corridors, with another notable cluster toward the northeast. The countywide mean is 1.70 percent, so most of Greene County remains lightly impervious despite those local concentrations.
Does the change map prove that land was developed or cleared?
No. It shows differences between the 1985 and 2025 classifications. A site that appears important should be checked with historical aerial imagery, planning records, or field information before a specific cause is assigned to the mapped difference.
Map File Information
Download the four original Greene County land-cover JPG maps together in one ZIP archive.
- Included Files: Land cover, forest/farmland, impervious/developed land, and 1985–2025 change maps
- File Type: Original JPG maps in one ZIP archive
- Intended Use: Printing, education, presentations, and map reference
Related Maps
- Albany County Land Cover Map
- Bronx County New York Land Cover Map
- Cattaraugus County New York Land Cover Map
Sources and references
- MRLC Annual NLCD Data — official access to annual land-cover data and related products.
- USGS Annual NLCD Land Cover Classification — official background on land-cover classes and interpretation.
- U.S. Census Bureau TIGER/Line Shapefiles — county boundary and geographic reference data.
- New York State DEC: Welcome to the Catskills — official context for the Catskill Forest Preserve and regional environment.
Green Map creates custom-edited map images using open geographic data sources such as geoBoundaries, Natural Earth, OpenStreetMap, and government open data.
These maps are edited visual materials, not raw data files, and are provided for education, documents, presentations, and graphic reference.