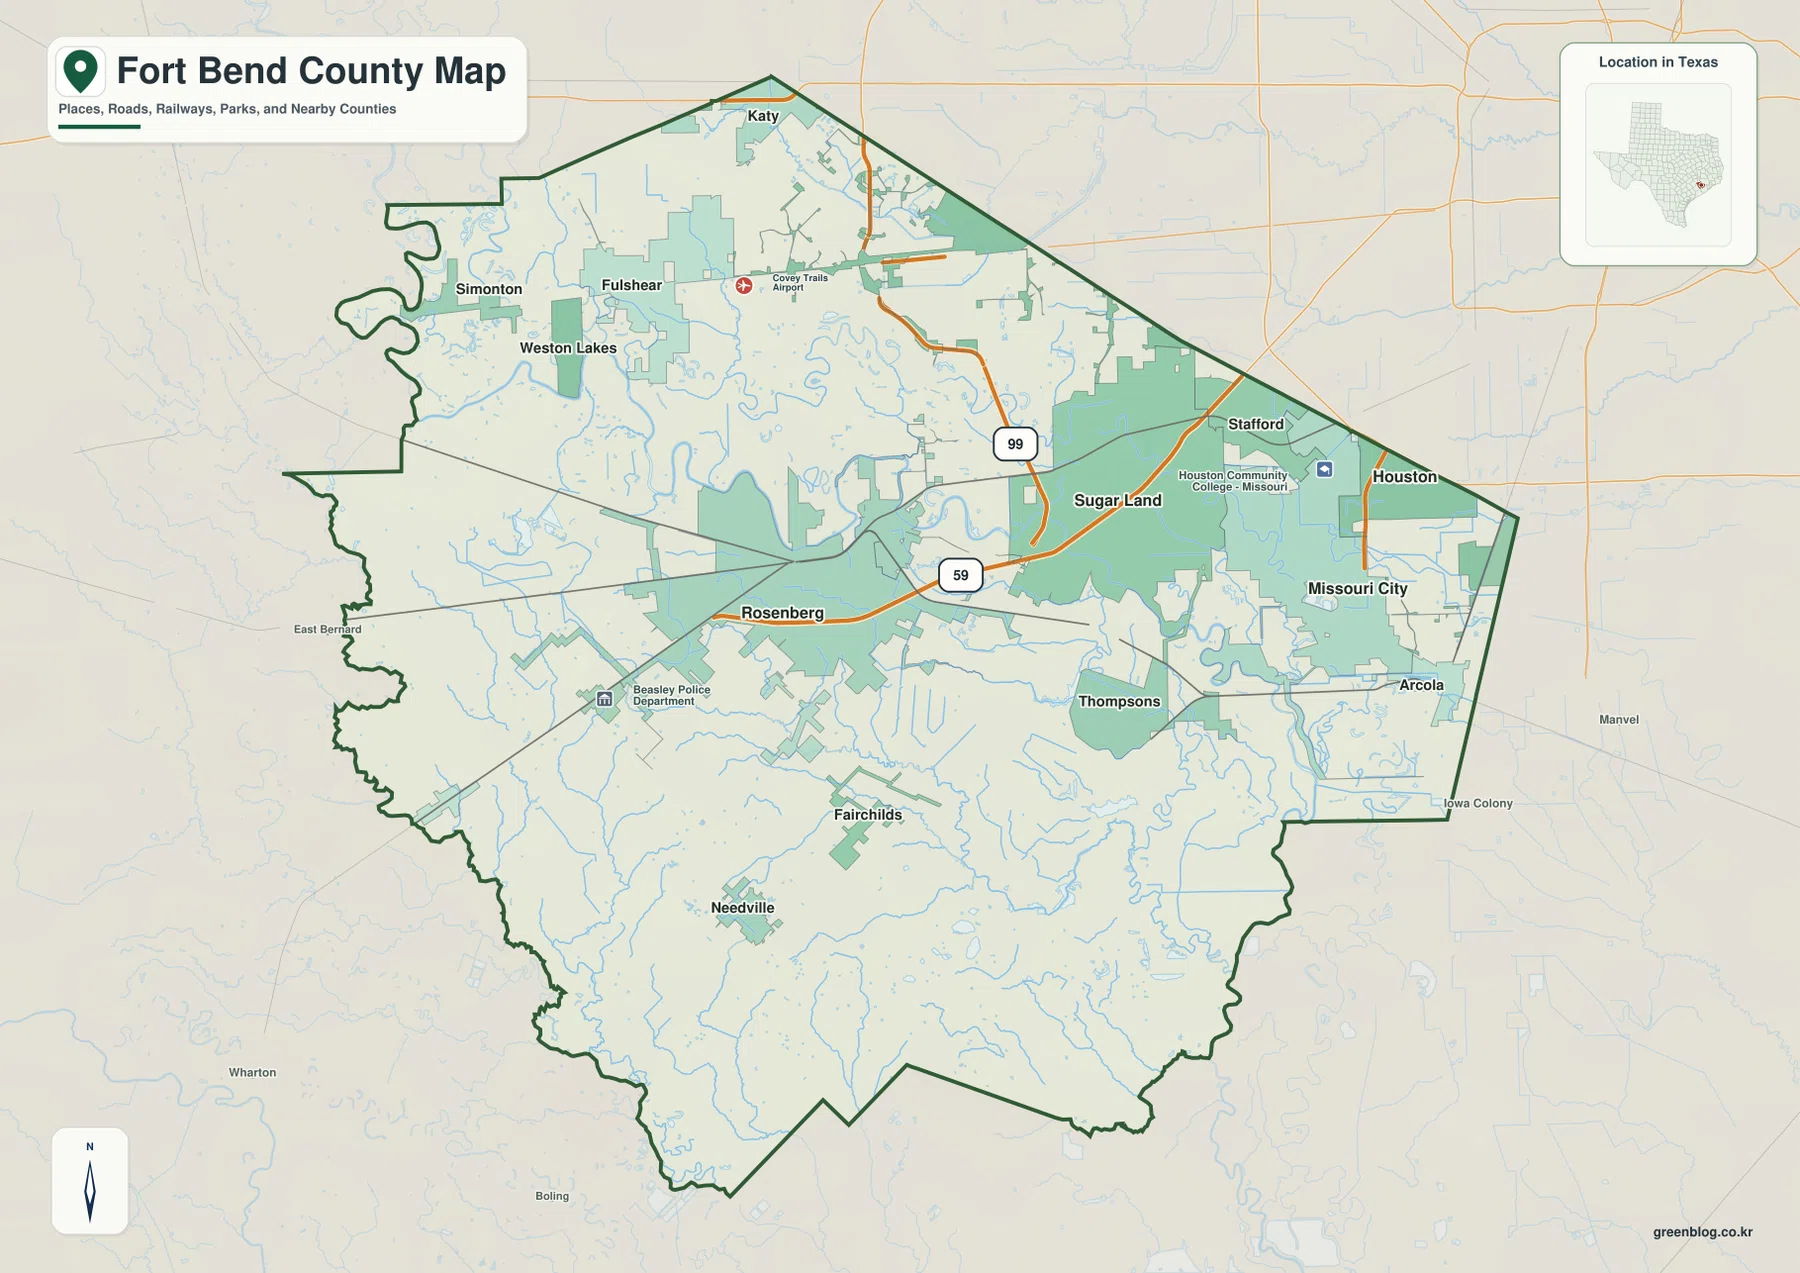
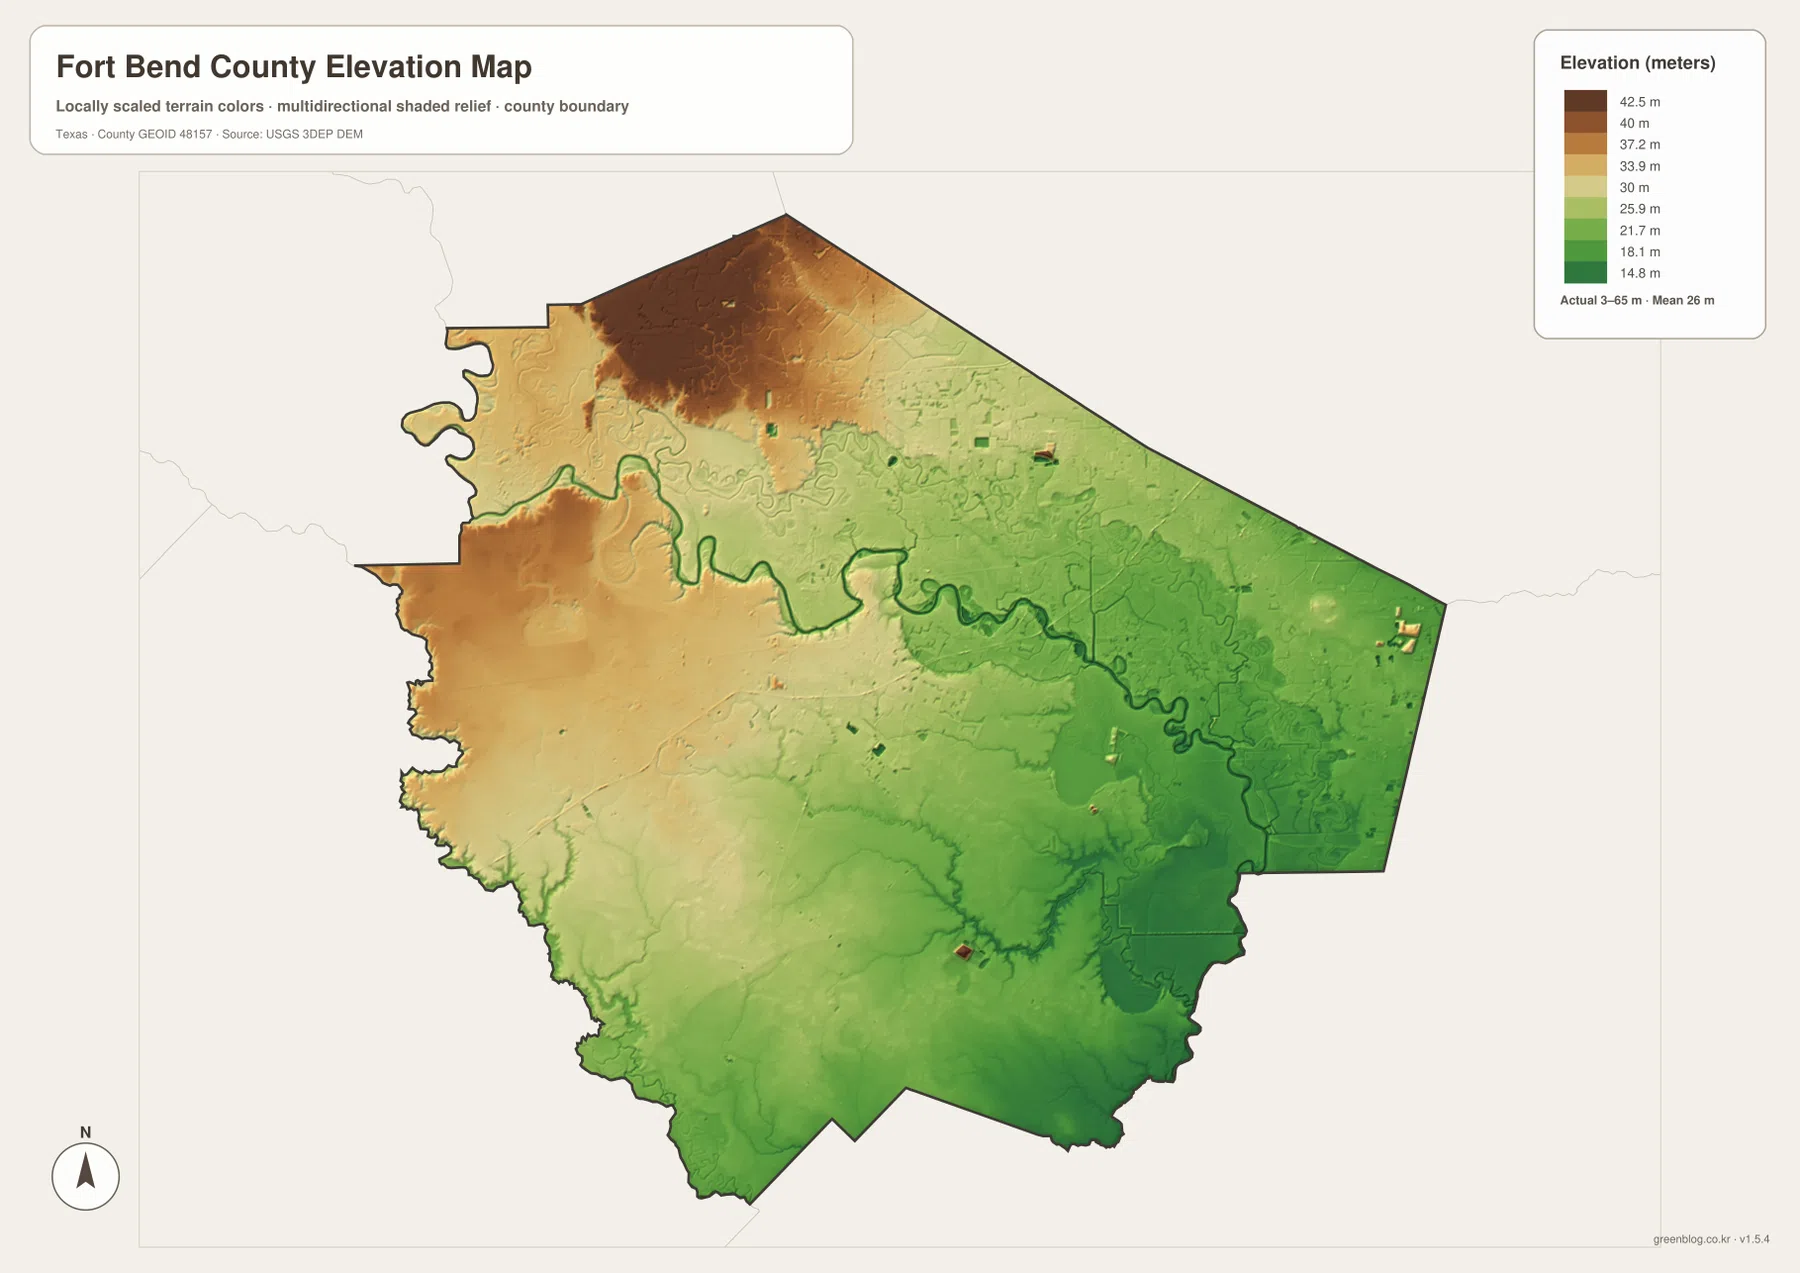
You can download high-resolution A3 JPG versions of the Fort Bend County county, city, water, and elevation maps together in the ZIP box on this page. The maps show a county with several distinct geographic settings: Sugar Land, Missouri City, and Stafford form a dense eastern cluster; Richmond and Rosenberg occupy a more central position near the Brazos River; and Fulshear, Simonton, Needville, and other communities are separated by much larger open spaces. The elevation surface adds another layer, with higher ground toward the northwest and west and lower terrain along the Brazos corridor and across much of the east and southeast.
A good way to orient yourself is to locate Sugar Land, Richmond, and Rosenberg before following the 59 and 99 road corridors. Those features establish the most heavily labeled part of the county. From there, the map opens toward Fulshear and Simonton in the northwest and Needville and Fairchilds in the south. The Brazos River cuts across this pattern with broad bends, so road density, city density, water, and elevation do not all change in the same direction.
Table of Contents
Sugar Land, Richmond, and the 59–99 Road Pattern
The general county map is busiest in the east and east-central area. Sugar Land sits near the center of that urban cluster, with Missouri City and Stafford close by. Richmond and Rosenberg lie farther west, and the road marked 59 runs through this sequence of communities. Route 99 passes north and northwest of Sugar Land and provides another strong visual reference between the more developed eastern area and the communities toward Fulshear and the northwestern side of the county.
Richmond is the county seat, but it is not the largest city in the supplied city ranking. On the general map, Richmond and Rosenberg appear close together near the Brazos River, while Sugar Land is the next major center to the east. Missouri City and Arcola lie farther southeast, and Thompsons is shown south of the main Sugar Land–Richmond band. The result is a multi-centered urban pattern rather than one single city dominating every part of the county.
The west and south are much more open. Fulshear, Simonton, and Weston Lakes occupy the northwest, while Needville and Fairchilds are spread across the southern half. The gaps between these labels are visibly larger than the spacing among Sugar Land, Missouri City, and Stafford. That contrast makes the county map especially useful for comparing the dense Houston-facing side of Fort Bend County with the more dispersed communities farther west and south.
Six Ranked Cities and a Strong Eastern Concentration
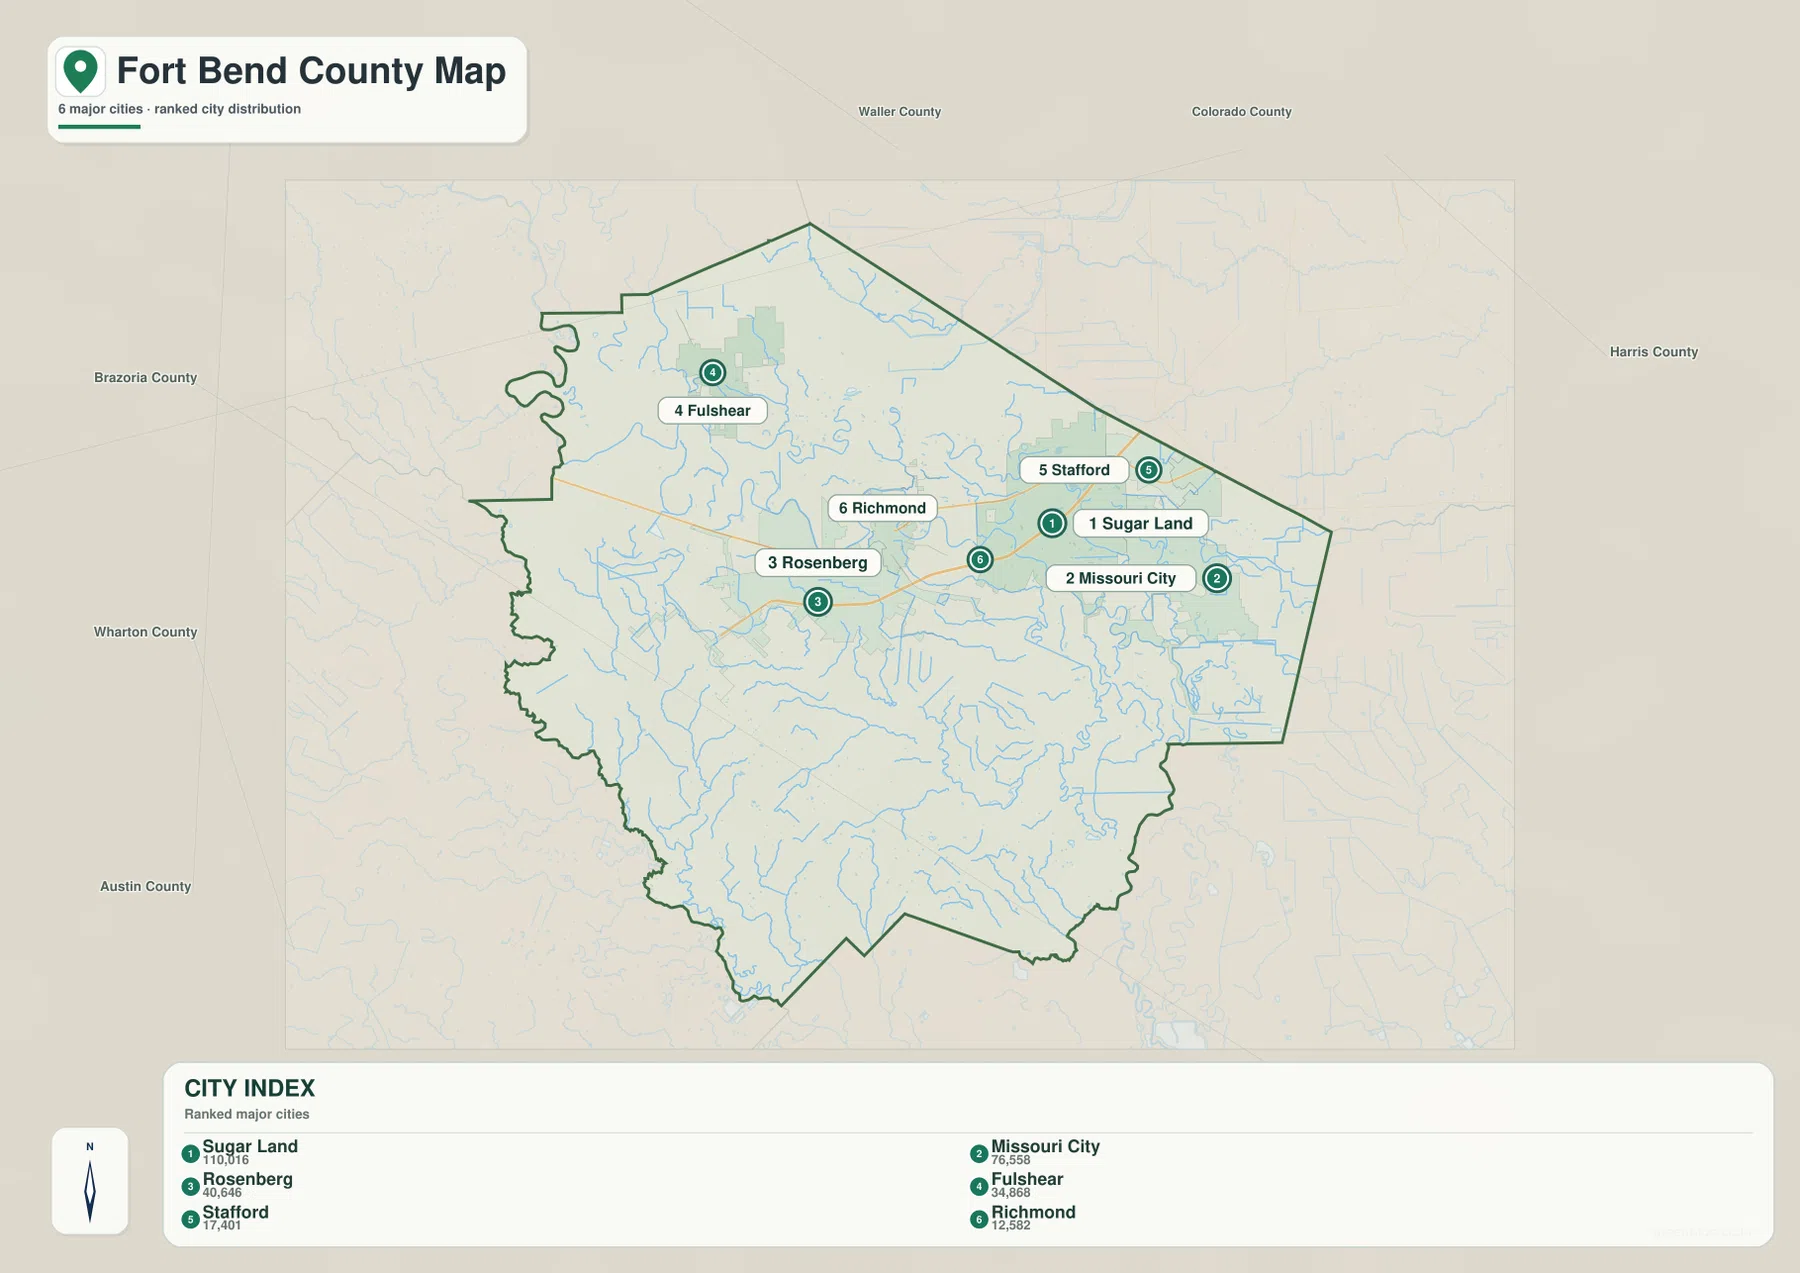
The city map highlights six communities: Sugar Land, Missouri City, Rosenberg, Fulshear, Stafford, and Richmond. Sugar Land is ranked first in the supplied CITY INDEX, Missouri City second, and Rosenberg third. Fulshear is fourth but stands apart geographically in the northwest. Stafford lies close to Sugar Land on the northeast side of the cluster, and Richmond is ranked sixth near the county’s central urban corridor.
The ranking becomes more useful when it is read together with position. Sugar Land, Missouri City, and Stafford are tightly grouped in the east, while Richmond and Rosenberg form another nearby pair farther west around the Brazos corridor. Fulshear breaks that pattern by sitting well to the northwest. The city graphic does not show straight-line distance connectors, so it should be used for relative direction, spacing, and city ranking rather than for estimating mileage between communities.
Richmond’s lower city-index rank also illustrates why a population ranking and a county reference map answer different questions. The city view emphasizes relative settlement size, while the county map shows Richmond’s central relationship to Rosenberg, Sugar Land, the Brazos River, and the road system. Reading both views prevents the county seat from being mistaken for the county’s largest urban center.
Brazos River Bends, Oxbow Lakes, and Oyster Creek
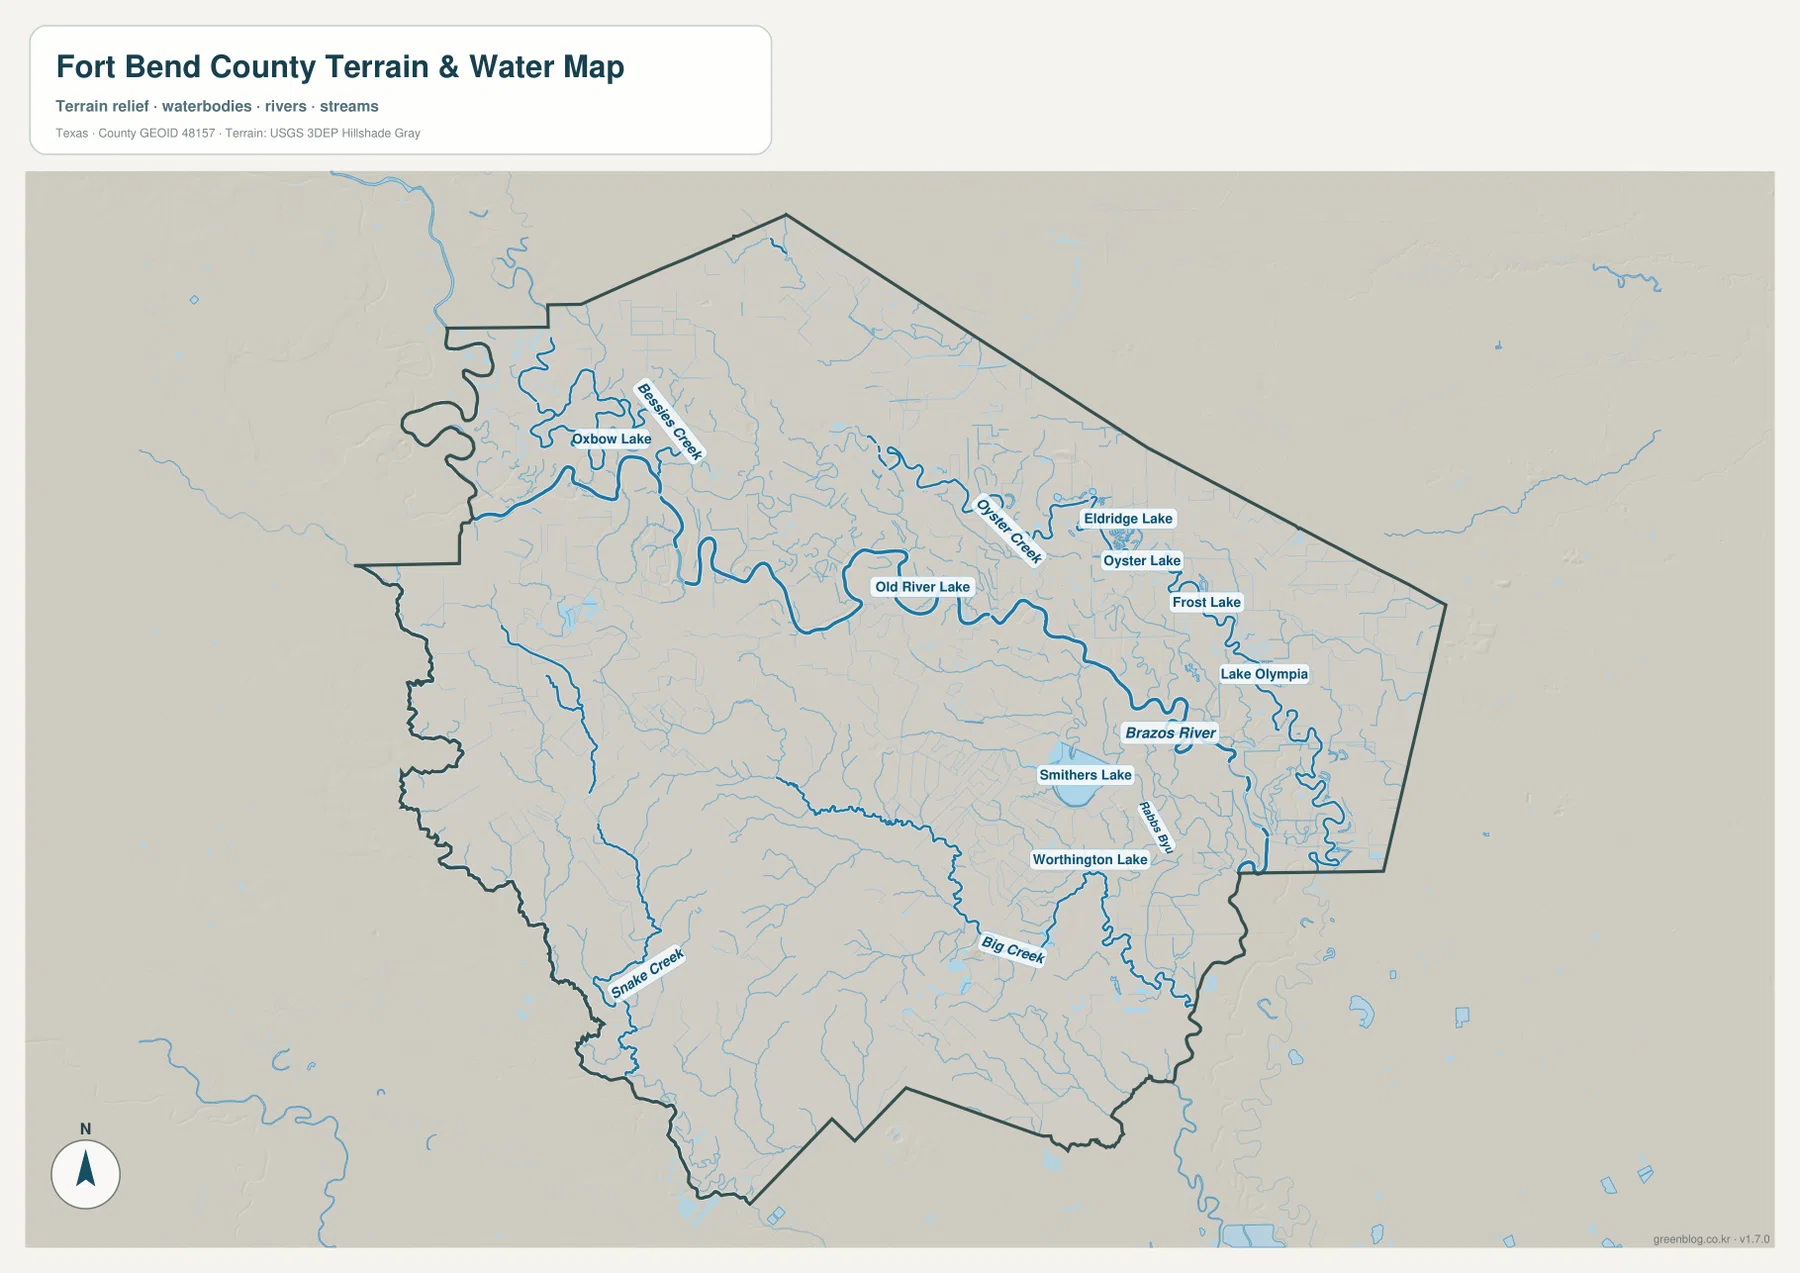
The Brazos River is the dominant feature on the water map. It enters from the western side, bends repeatedly through the middle of Fort Bend County, and continues toward the southeast. Several named water bodies sit close to this winding corridor, including Old River Lake and Oxbow Lake. The names and shapes make the old-meander character of the landscape easy to recognize without turning the map into a technical river-geomorphology diagram.
Oyster Creek extends across the northern and eastern part of the mapped interior, while Bessies Creek is labeled farther northwest. The eastern side contains a cluster of smaller lakes such as Eldridge Lake, Oyster Lake, Frost Lake, and Lake Olympia. Smithers Lake and Worthington Lake appear farther south and west of that group, and Big Creek and Snake Creek add separate drainage lines across the southern half. Water is therefore distributed through a large river, creeks, lakes, and former river bends rather than concentrated in one channel alone.
This map is intended for locating waterways relative to communities and terrain. It is not a flood-hazard map, a parcel boundary product, a depth chart, or a navigation map. Its practical value is showing how the Brazos River threads between the Richmond–Rosenberg area and the eastern urban side of the county, while Oyster Creek and numerous small lakes occupy land much closer to Sugar Land and Missouri City.
From Higher Northwest Ground to the Brazos Lowlands
The elevation map lists an actual county range of about 3 to 65 meters and a mean near 26 meters. The highest broad areas appear in the northwest and parts of the west, where brown and tan shades dominate. A lower green corridor follows the winding Brazos River through the center, and much of the east and southeast is also shown in lower colors. The overall pattern is not mountainous, but the local elevation difference is large enough to produce a clear west-to-east and northwest-to-southeast contrast.
The river relationship is especially clear when the elevation and water views are compared. Low green terrain follows many of the Brazos bends, with smaller low channels branching toward nearby creeks. Higher colors expand around the northwestern side near the Fulshear direction and across parts of the west. The eastern urban area is generally lower, so the county’s most densely settled side occupies a different elevation setting from the higher northwestern edge.
The locally scaled colors are designed for county-wide comparison and are not survey-grade measurements. They should not be used to determine the exact height of a home site, engineering grade, flood elevation, or legal building requirement. For map reading, the important takeaway is the relationship among the higher northwest, the lower Brazos River corridor, and the broad lowlands that continue across the east and southeast.
Why Eastern Fort Bend Looks Different from the West and South
Eastern Fort Bend County has the tightest combination of city labels and major roads. Sugar Land, Missouri City, and Stafford are close together, and the 59 and 99 corridors pass through or near the same developed area. Richmond and Rosenberg extend that urban pattern westward along the Brazos corridor, but the map becomes progressively more open toward Fulshear, Simonton, Needville, and Fairchilds.
The water and elevation maps show that the contrast is not only about settlement. The Brazos River creates a long low corridor through the middle of the county, Oyster Creek and several lakes add water features near the eastern urban side, and the northwest rises to the county’s highest mapped ground. Looking at these layers together gives a much more specific picture than simply describing Fort Bend County as part of the Houston metropolitan area.
Choosing a Map for Roads, Cities, Water, or Elevation
Start with the county map when you need Sugar Land, Richmond, Rosenberg, the road labels 59 and 99, and the county outline in the same view. Use the city map to compare the six ranked communities without the extra road detail. The water map is the best choice for the Brazos River, Oyster Creek, Old River Lake, Oxbow Lake, and the smaller lakes, while the elevation map makes the higher northwest and lower river corridor immediately visible.
The WebP images are optimized for viewing on the page, but the ZIP contains the matching high-resolution A3 JPG files for printing, larger displays, classroom work, local reference, presentations, or personal archiving. You can keep the full set or use only the map that fits the question you are trying to answer.
Frequently Asked Questions
Where is the densest city cluster on the Fort Bend County maps?
The supplied city map places Sugar Land, Missouri City, and Stafford close together on the eastern side. Richmond and Rosenberg form another nearby pair farther west, while Fulshear is separated from the main eastern cluster in the northwest.
How does the Brazos River cross Fort Bend County?
The Brazos enters from the west, makes several broad bends through the central part of the county, and continues toward the southeast. Its route passes between the Richmond–Rosenberg area and the eastern side of the county, making it a useful reference on both the water and elevation maps.
What elevation range is shown on the supplied Fort Bend County map?
The elevation map lists an actual range of about 3 to 65 meters and a mean near 26 meters. Higher terrain is concentrated toward the northwest and west, while the Brazos corridor and much of the east and southeast are lower.
Sources and Reference Data
USGS The National Map Viewer — Official map service for terrain, roads, hydrography, and other geographic layers.
USGS National Hydrography — Official reference for rivers, streams, creeks, lakes, and hydrographic data.
USGS 3D Elevation Program — U.S. Geological Survey program for elevation and terrain data.
U.S. Census Bureau TIGER/Line Shapefiles — Official source for county boundaries, roads, and related base geography.
Map File Information
Download the Fort Bend County county map, city map, water map, and elevation map as high-resolution A3 JPG files. The ZIP contains the original map files shown on this page.
- File Type: JPG
Related Maps
- Austin County Texas map
- Waller County Texas map
- Wharton County Texas map
- Bastrop County Texas map
- Washington County Texas map
Green Map creates custom-edited map images using open geographic data sources such as geoBoundaries, Natural Earth, OpenStreetMap, and government open data.
These maps are edited visual materials, not raw data files, and are provided for education, documents, presentations, and graphic reference.