Download the high-resolution A3 JPG map set for Foard County from the ZIP box below; it includes the county, city, water, and elevation maps shown on this page. Foard County is a sparsely settled North Texas county where Crowell stands out as the main urban reference and the land changes noticeably from higher, deeply cut country in the west to lower ground in the east and southeast. The supplied maps show Crowell, Vivian, Foard City, the numbered road network, Beaver Creek and North Wichita River drainage, and an elevation range of roughly 369 to 574 meters.
Crowell is the easiest point from which to understand the county. It sits near the middle of the mapped road system, with Vivian to the west and Foard City farther south. The western half is visibly rougher because streams have cut numerous valleys through higher terrain, while the eastern half is broader, lower, and more gently shaped. With only one city highlighted in the city index, the roads, creeks, and elevation differences become especially important for reading Foard County.
Table of Contents
Crowell at the Center of the Numbered Road Network
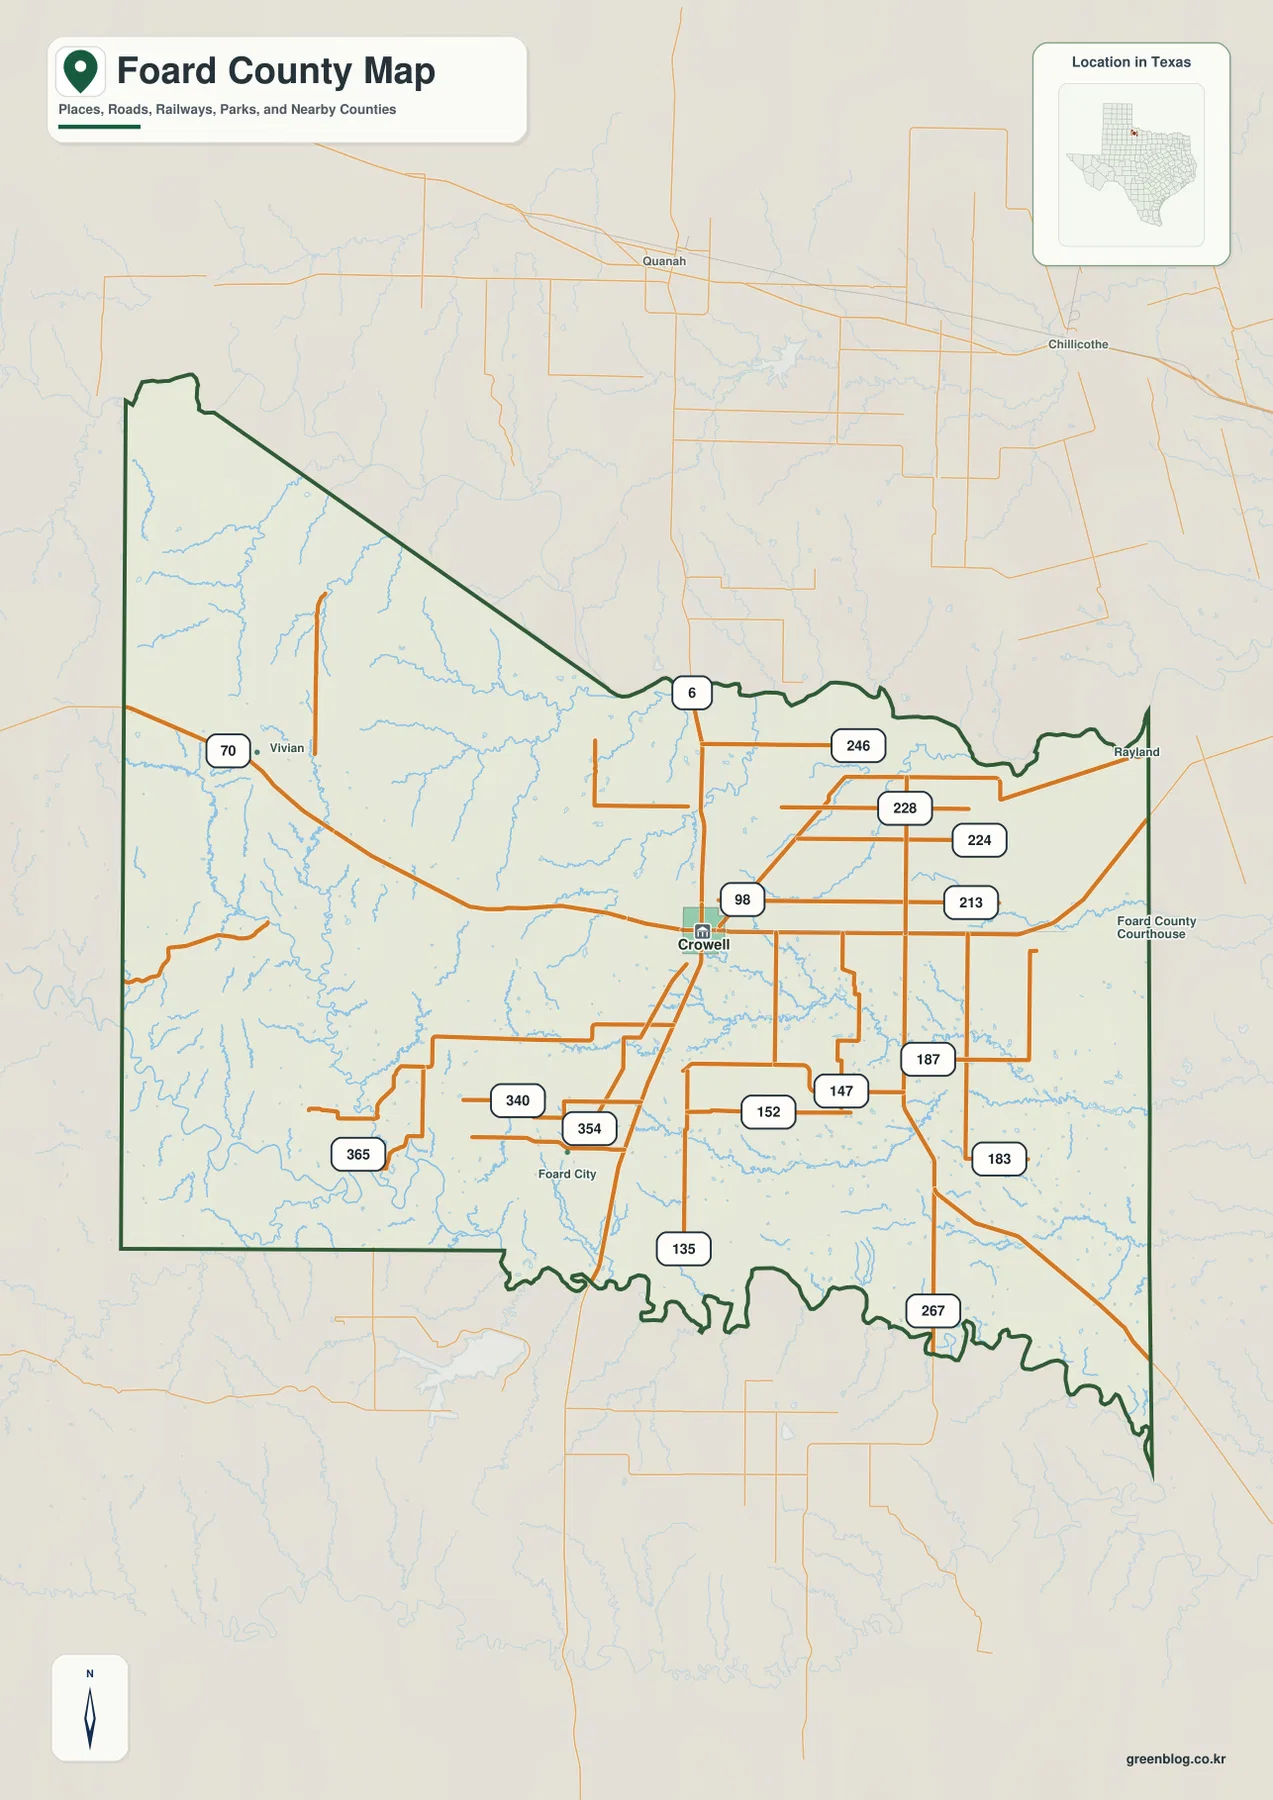
The general county map places Crowell at the most obvious road junction. Route 70 approaches from the west through Vivian and continues into Crowell, where several other numbered roads branch toward the north, south, and east. Routes 98, 147, 152, and 187 are visible around the central and southeastern part of the county. North of Crowell, Route 6 is marked near the upper boundary, while Routes 246, 228, 224, and 213 form a denser set of lines across the northeast.
Foard City appears southwest of Crowell with Routes 340, 354, and 365 nearby. The western and southwestern road pattern bends more often than the grid-like roads northeast of Crowell, matching the more broken terrain visible beneath the map. Vivian is positioned along the western approach of Route 70, giving it a straightforward connection to Crowell. The map is therefore useful not only for locating the county outline but for seeing how almost every clearly labeled local route ultimately relates back to the Crowell area.
Parts of the northern and southern boundary are irregular rather than straight, while the western edge is comparatively simple. A few labels outside the county preview—including surrounding-county text and the courthouse label—are not reliable enough to use for compass-direction claims. For that reason, this article bases its geographic descriptions on places, roads, waterways, and terrain that are clearly shown inside the Foard County boundary.
A City Index Dominated by Crowell
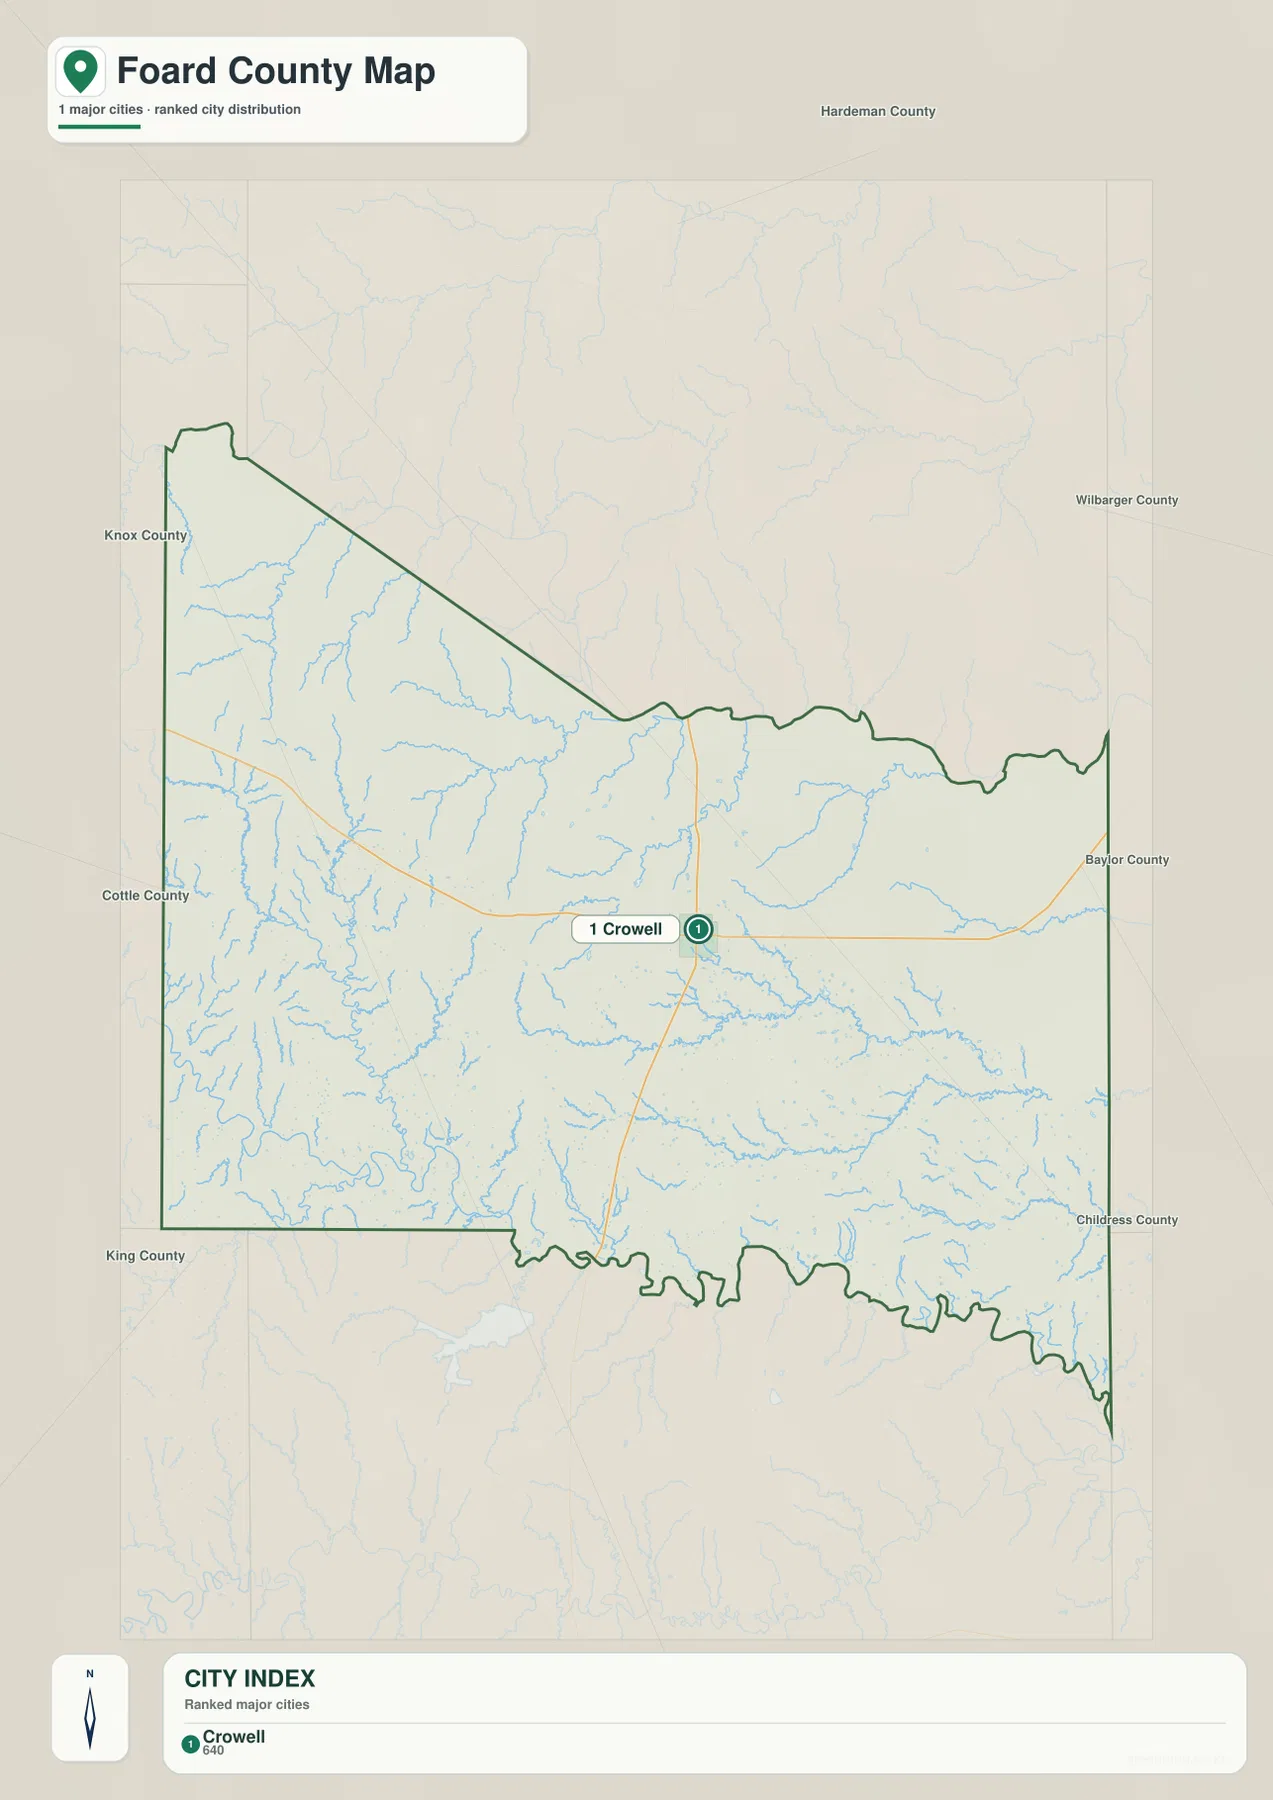
The city map highlights just one major city: Crowell. It is ranked first in the CITY INDEX and appears near the central part of the county. There are no straight-line connector distances to other ranked cities because no second city is included in this particular index. That makes the graphic unusually simple. Its main purpose is to show where the county’s principal settlement sits within a much larger rural area.
The general county map adds smaller labels such as Vivian and Foard City, but neither receives the same emphasis in the city view. Crowell also sits where multiple numbered roads converge, reinforcing the same pattern from a transportation perspective. Instead of comparing several similar city centers, readers can use Crowell as the fixed reference and then move outward to the western, southern, and northeastern sections of the county.
Beaver Creek, North Wichita River, and a Dense Creek Network
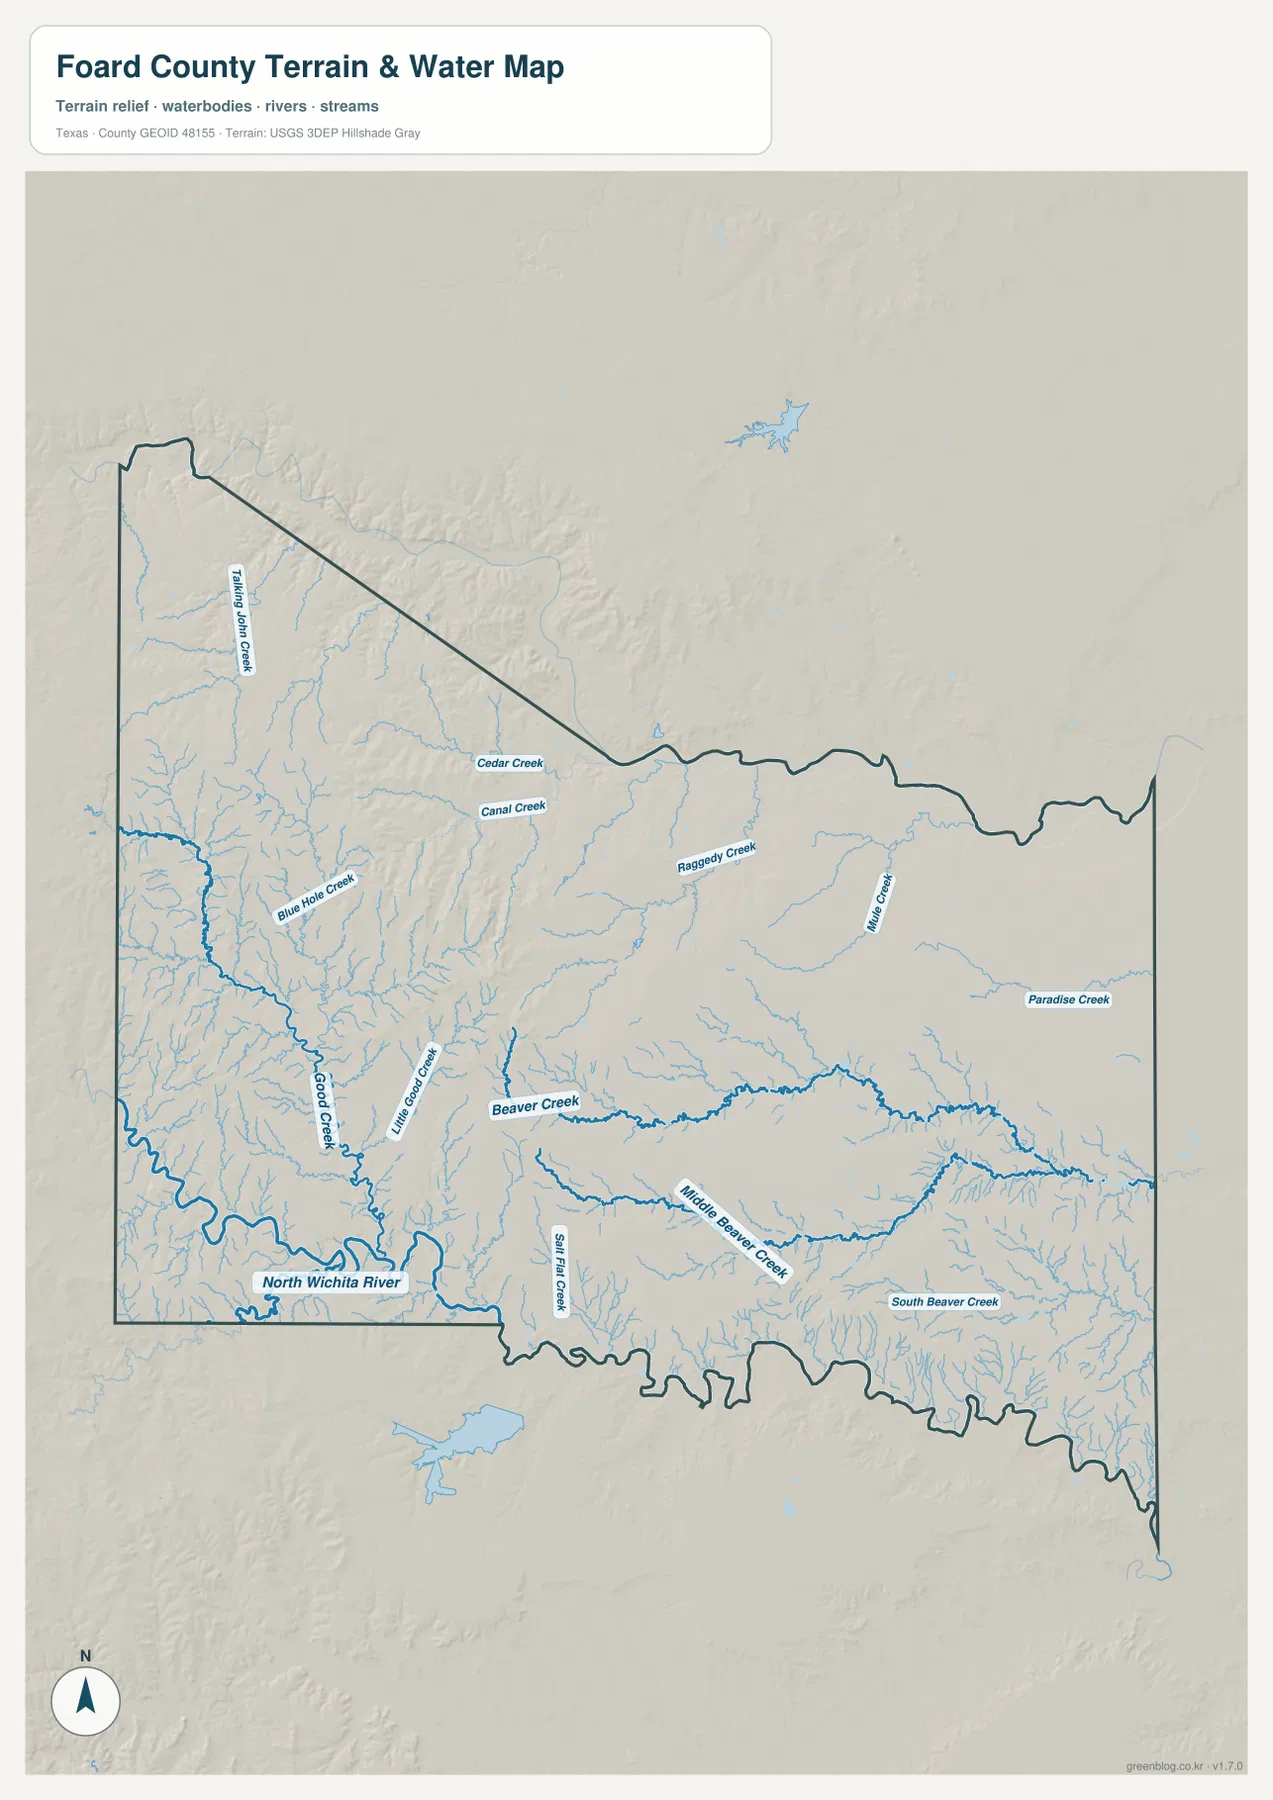
Beaver Creek is one of the clearest waterways on the supplied terrain-and-water map, crossing the central part of the county toward the east. Middle Beaver Creek and South Beaver Creek are labeled farther south, creating a family of similarly named drainage lines across the southeastern half. On the western side, Good Creek and Little Good Creek run through rougher ground, and Black Hole Creek follows another incised valley farther northwest.
North Wichita River is the strongest named river feature near the southwest boundary. Numerous smaller tributaries feed toward its valley, while Salt Flat Creek appears in the south-central area. The northern half includes Cedar Creek and Canal Creek, and the northeast and east show Raggedy Creek, Mule Creek, and Paradise Creek. The water network is therefore spread across the county rather than concentrated in a single river corridor.
This water map is a location reference, not a flood, legal-boundary, or navigation product. A blue line does not establish year-round flow, channel depth, or flood risk. Its practical value is in showing how creeks divide the western uplands into narrow valleys and how the Beaver Creek system crosses the lower central and eastern terrain.
Higher Western Ridges and Lower Eastern Ground
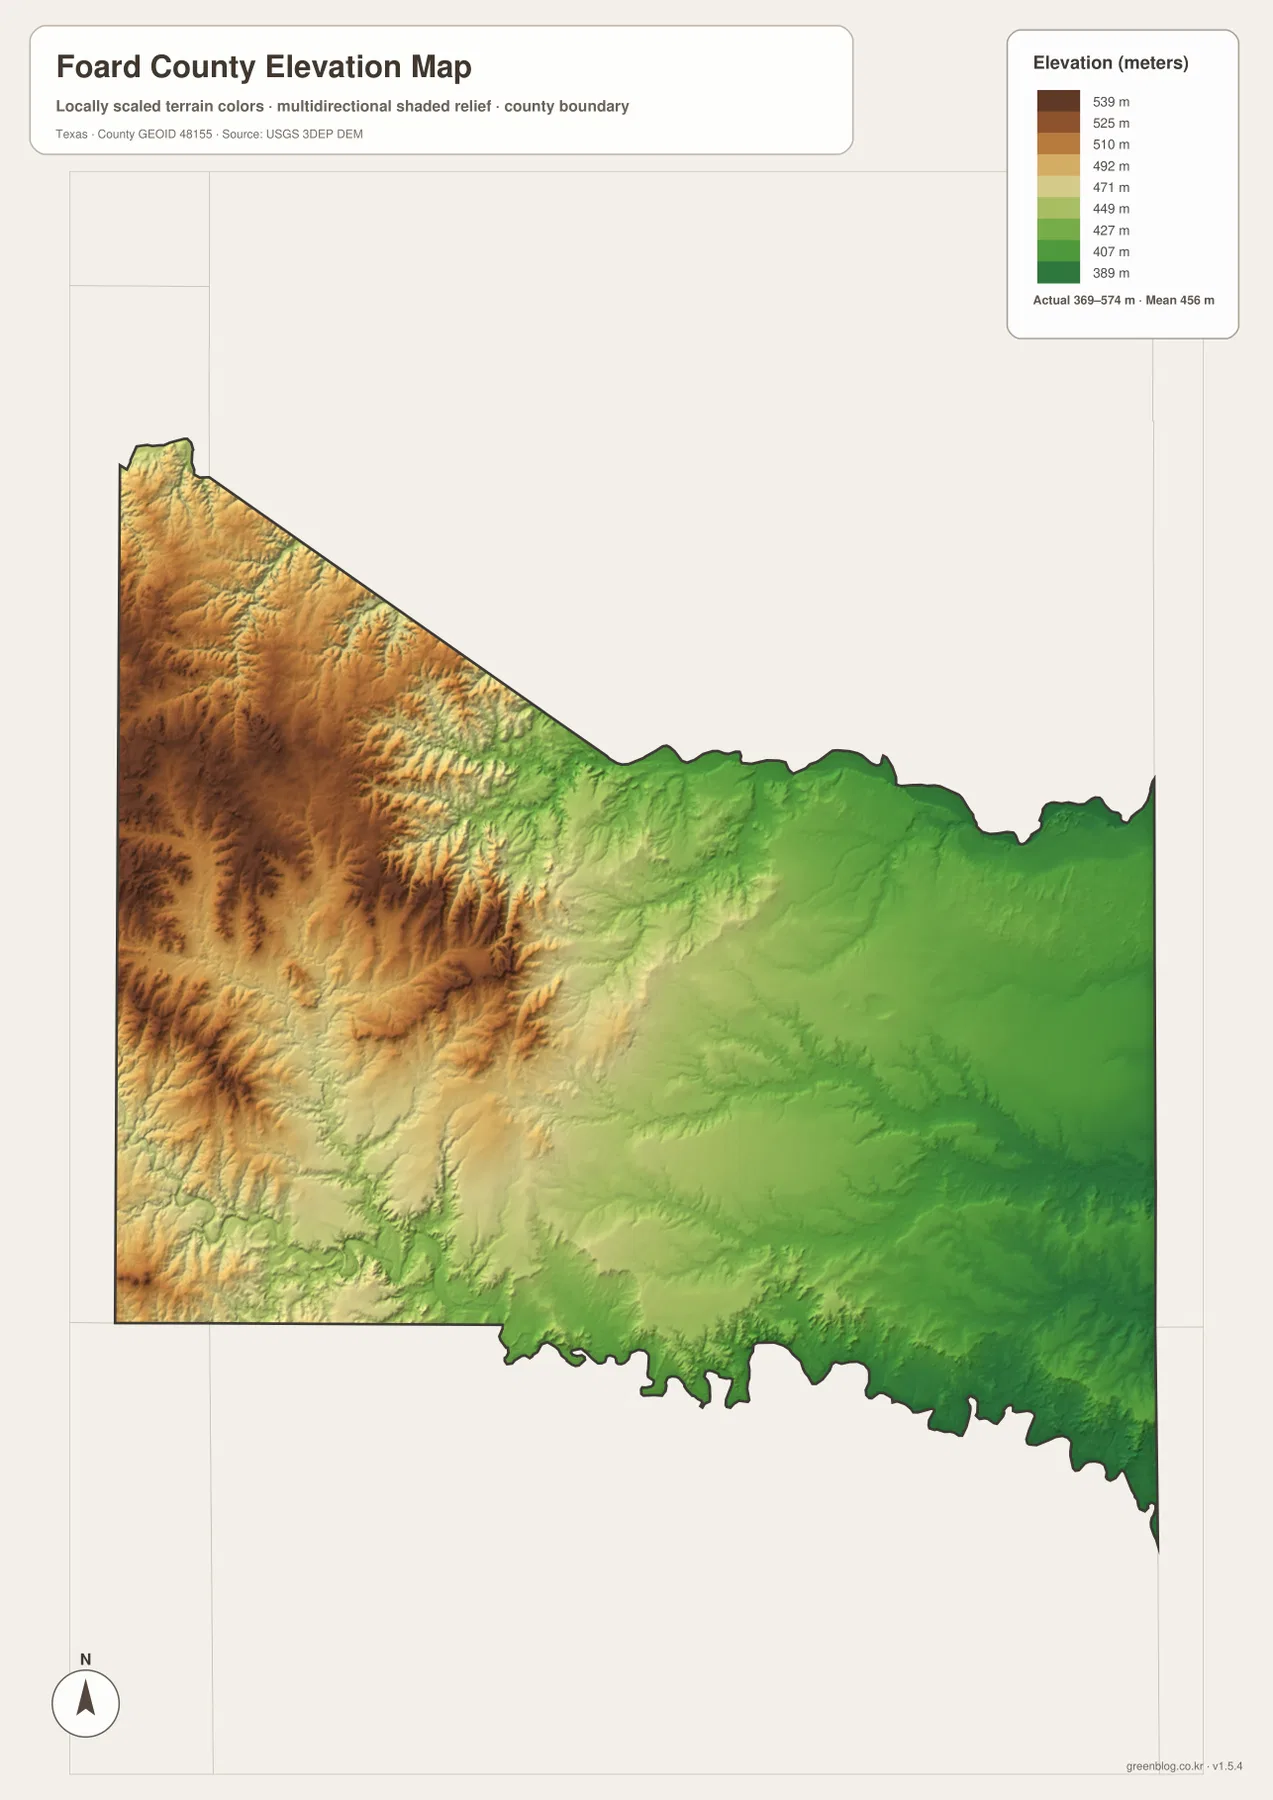
The elevation map lists an actual county range of about 369 to 574 meters and a mean near 456 meters. Brown and darker tan colors dominate the west and northwest, showing that the county’s highest terrain is concentrated there. The center transitions through yellow and light green, while broad green areas cover much of the east and southeast, where elevations are generally lower.
The western uplands are not a smooth plateau. Creek valleys cut repeatedly into the higher surface, producing a dense pattern of ridges and lower channels. Comparing the elevation surface with the water map makes those incisions easy to recognize around Good Creek, Little Good Creek, Black Hole Creek, and nearby tributaries. Farther east, relief becomes gentler and the lower Beaver Creek drainage occupies a broader area.
The colored surface is designed for county-scale comparison rather than parcel or engineering work. It should not be used to determine an exact road grade, construction elevation, or survey point. At this scale, however, the nearly 200-meter difference between the lowest and highest mapped elevations explains why the western side looks much rougher than the eastern half.
Reading the West-to-East Change from Crowell
Crowell provides a convenient point for comparing the county’s two broad terrain settings. Traveling west toward Vivian on the mapped Route 70 corridor leads into higher and more deeply cut ground. Stream valleys become more numerous and the shaded relief grows stronger. East of Crowell, the land drops into a smoother, lower surface where the numbered road pattern is more regular and the creek valleys are less dramatic at this scale.
The south adds another variation. Foard City lies in an area with many small drainage lines, and the North Wichita River valley approaches the southwestern edge. The northwest, meanwhile, contains some of the highest colors on the elevation map. Moving between the county, water, and elevation views helps distinguish a simple road direction from the actual land those roads cross.
Using the Right Map for Roads, Water, or Terrain
The county map is the best starting point for Crowell, Vivian, Foard City, numbered routes, and the boundary. The city index gives a cleaner view of Crowell as the single highlighted settlement. Use the water map when you need Beaver Creek, North Wichita River, Good Creek, or the smaller named tributaries, and use the elevation map to compare the high western uplands with the lower east and southeast.
The WebP images are convenient for on-page viewing, while the downloadable originals are intended for larger display and printing. The ZIP below contains high-resolution A3 JPG copies of the county, city, water, and elevation maps. You can keep the complete set or print only the map that fits a classroom assignment, local reference task, presentation, or personal project.
Frequently Asked Questions
What is the best place to start when reading a Foard County map?
Start with Crowell. It is the only city highlighted in the city index and the main cluster point for numbered roads on the general county map, making it a convenient reference for Vivian, Foard City, and the eastern half of the county.
Which waterways stand out on the supplied water map?
Beaver Creek is prominent across the central area, while North Wichita River is the strongest river label near the southwest boundary. Middle Beaver Creek, South Beaver Creek, Good Creek, and several smaller named tributaries show how widely the drainage network is distributed.
Where are the higher and lower parts of Foard County?
The elevation map places the highest terrain mainly in the west and northwest and the lower ground across much of the east and southeast. Its listed actual range is about 369 to 574 meters, with a mean near 456 meters.
Sources and Reference Data
USGS The National Map Viewer — Official map service for terrain, roads, hydrography, and other geographic layers.
USGS National Hydrography — Official reference for rivers, creeks, lakes, and hydrographic data.
USGS 3D Elevation Program — U.S. Geological Survey program for elevation and terrain data.
U.S. Census Bureau TIGER/Line Shapefiles — Official source for county boundaries, roads, and related base geography.
Map File Information
Download the Foard County county map, city map, water map, and elevation map as high-resolution A3 JPG files. The ZIP contains the original map files shown on this page.
- File Type: JPG
Related Maps
- Wilbarger County Texas map
- Motley County Texas map
- Stonewall County Texas map
- Baylor County Texas map
- Victoria County Texas map
Green Map creates custom-edited map images using open geographic data sources such as geoBoundaries, Natural Earth, OpenStreetMap, and government open data.
These maps are edited visual materials, not raw data files, and are provided for education, documents, presentations, and graphic reference.